
May 12, 2026
The Leverage No One Talks About: How Gold Mining Equities Multiply Bullion Gains
Most investors treat gold as a single trade. Buy the metal, hold through uncertainty, exit when calm returns. But this framing misses an entirely different dimension of the precious metals market, one that has been quietly delivering returns in 2025 and 2026 that broad equity investors can only observe from the outside looking in. The real story behind gold stocks outperformance is not gold's price alone. It is the structural relationship between gold's price and the profitability of the companies that pull it from the earth, and why that relationship creates periodic windows that disciplined investors can systematically target.
When big ASX news breaks, our subscribers know first
Why Mining Equities Are Built Differently From Bullion
Gold bullion moves dollar for dollar with the market price. Mining equities do not work this way. The economics of gold production create what analysts call operational leverage, a mechanism where relatively modest movements in the gold price translate into dramatically amplified changes in mining company profitability.
The arithmetic is straightforward. If a mining company produces gold at an all-in sustaining cost of $2,000 per ounce and gold trades at $2,500, the operating margin is $500 per ounce. If gold rises to $3,000, that same cost structure now generates a $1,000 margin. The gold price rose 20%, but the operating margin doubled. That profit amplification flows through to earnings, free cash flow, and ultimately share price, often with a multiplier effect that bullion simply cannot replicate.
This is why, in periods of genuine gold strength, the miners tend not to merely track gold but to substantially exceed it. Understanding the gold price impact on mining equities is, consequently, the foundation of any serious precious metals strategy.
The 2025-2026 Performance Gap Is Difficult to Ignore
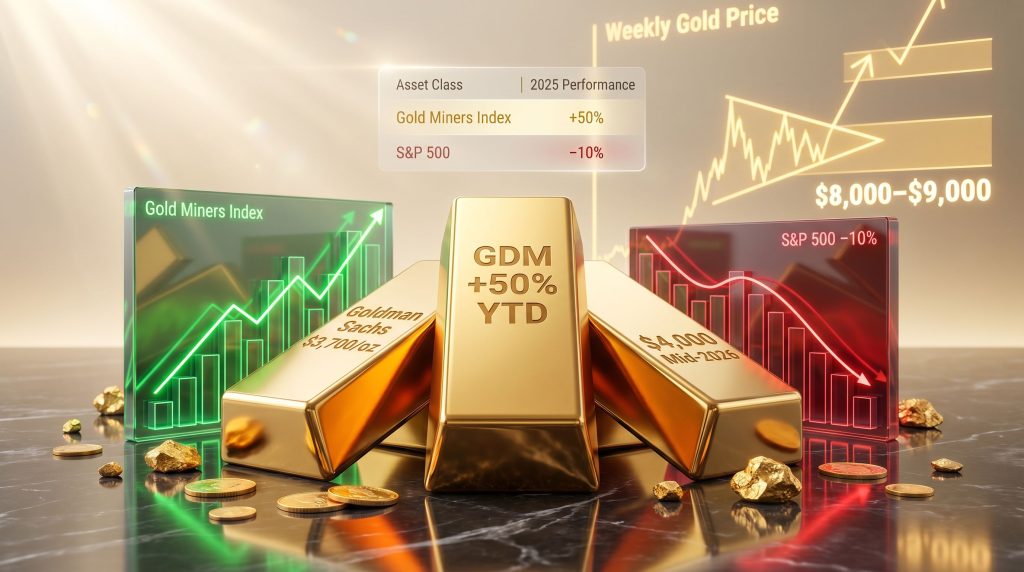
The performance divergence between gold mining equities and the broader market through 2025 and into 2026 has been extraordinary. The Gold Miners Index (GDM) registered approximately +50% year-to-date through April 2026, according to analysis published by Stewart Thomson of Graceland Investment Management on Gold-Eagle.com. During that same window, the S&P 500 declined approximately 10%. That is not a marginal outperformance gap. That is a structural argument.
| Asset Class | 2025-2026 YTD Performance | Key Observation |
|---|---|---|
| Gold Miners Index (GDM) | +50% (through April 2026) | Leveraged outperformance vs. bullion |
| S&P 500 | -10% | Broad equity market weakness |
| Energy Stocks (Oil/Gas) | Flat to negative | FCF yield comparable but weaker price momentum |
| NASDAQ 100 | Lagged gold since late 2022 | Gold annualised ~18% in 2020s vs. S&P ~15% |
Free cash flow yield for gold mining equities has approached approximately 7.5%, comparable to energy stocks, but with a critical difference: gold's price has surged by roughly $600 per ounce in a single quarter while oil and gas commodities remained flat or declined. The FCF yield comparison looks similar on paper. The underlying momentum driving future earnings does not.
What Is Actually Pushing Gold Higher Over the Long Term
The conventional explanation for gold strength is that central banks print money, currencies weaken, and gold rises. This explanation is partially correct but incomplete in ways that matter to investors trying to position intelligently. Furthermore, understanding the broader gold-stock market relationship through secular cycles adds important context to this dynamic.
Thomson's analysis on Gold-Eagle.com points to a dynamic that rarely receives sufficient attention: commercial bank lending, not government quantitative easing, is the dominant driver of private money supply growth. The distinction matters because it explains why gold can rise even when central bank balance sheets are shrinking.
Between 2024 and 2025, the Federal Reserve's balance sheet actually contracted, and yet gold delivered some of its most powerful upward moves in years. Looking back further, during 2010 and 2011, the Fed's balance sheet grew only modestly relative to expectations, and yet gold staged a historic rally. The common thread is not the Fed. It is the relentless expansion of private credit through commercial bank lending, a process that operates continuously regardless of what central banks are doing at any given moment.
The private money supply, driven by commercial bank credit creation, has expanded persistently across decades. This structural reality creates a long-term gravitational pull against fiat currency that gold, as a fixed-supply monetary asset, directly reflects.
Beyond monetary mechanics, gold's price is shaped by a genuinely complex web of factors. Asian import duties, seasonal festival demand, geopolitical conflict, central bank reserve management, interest rate cycles, and currency dynamics all intersect simultaneously. Some analysts believe Iranian and Russian central banks have been selling gold to fund war-related fiscal needs, creating periodic price suppression. Indian government policies on bullion banking taxation and import duties have introduced additional friction on the demand side.
However, here is the counterintuitive insight that separates disciplined gold investors from reactive ones: that unpredictability is not a weakness in the investment thesis. It is a signal. Rather than chasing forecasts, sophisticated participants use gold's price volatility as a systematic accumulation trigger, targeting pre-identified support zones where probability-weighted risk-reward tilts decisively in their favour.
The Buy Zone Framework: Entry Timing as the Critical Variable
Gold stocks outperformance is not a static condition. It is episodic, concentrated at specific moments in the price cycle, and most powerful in the period immediately following capitulation lows. This distinction transforms how one should think about mining equity exposure.
The question Thomson addresses in his Gold-Eagle analysis is one that many investors ask: when do miners outperform gold? His answer is specific and actionable. Outperformance occurs when miners are purchased at or near key technical support zones in both gold's price and broader equity indices. Outside of those zones, the timing advantage disappears and the outperformance mechanism is far less reliable.
Identifying a High-Probability Entry Point
The framework for locating these windows involves several sequential observations:
- Monitor gold's price approach toward established technical support levels
- Cross-reference with broad equity index support zones, using benchmarks like key Dow levels as confirmation signals
- Observe ETF price deceleration at support, using instruments like GDX and GDXJ as the primary measurement tools
- Scale into positions using disciplined capital allocation rather than lump-sum deployment
- Maintain a return expectation framework of 20% or more in unleveraged gains within one to two months from entry
- Reduce or exit exposure as gold and equity benchmarks approach resistance zones
By May 2026, GDX had already delivered two separate rounds of dramatic outperformance from identified buy zones within the year. A third cycle, described as potentially offering even larger gains, was reported as in progress at the time of Thomson's analysis. Silver mining equities tracked the same framework, with enthusiasts in both previous buy windows reporting gains exceeding 20%.
Thomson identified the $4,400 gold support zone and the Dow 45,000 support zone as the key reference levels where miners demonstrated their characteristic behaviour: price deceleration at support, followed by a surge in mining equity prices. The pattern has been observed across multiple cycles, suggesting that this mechanism is structural rather than coincidental.
The Nasdaq Analogy That Reframes Everything
One of the most useful conceptual tools for understanding mining equity dynamics comes from comparing them to high-momentum technology stocks. Seeking long-term outperformance from Nasdaq growth names versus the broader Dow is a low-probability pursuit under most conditions. However, when technology stocks are purchased during moments where the Dow itself is approaching major support, those same names can deliver gains in one or two months that the broader market would take multiple years to achieve.
Gold stocks operate on the same principle, arguably with even more force. The leveraged profit amplification of mining operations, combined with discipline around entry timing, creates the conditions for returns that compressed-multiple equity markets simply cannot match over comparable timeframes. According to analysis from VanEck, this leverage dynamic positions miners for continued outperformance as the gold price environment remains constructive.
Long-Term Price Targets and the Bull Case for Gold
Gold's weekly chart, as analysed by Thomson, displays a flag-like rectangular drift pattern that technical analysts regard as constructive for continued upside. The long-term price target zone derived from this pattern sits between $8,000 and $9,000 per ounce, though this is a technical projection rather than a guaranteed outcome and should be interpreted within the framework of gold's acknowledged price unpredictability.
Near-term, institutional forecasters including Goldman Sachs have published targets of approximately $3,700 per ounce by end-2025 and $4,000 per ounce by mid-2026, reflecting a combination of safe-haven demand, monetary expansion, and geopolitical risk premiums. The gold price outlook for miners remains compelling given these institutional projections. Gold's price has already exceeded the inflation-adjusted 1980 peak that once defined the ceiling of the market's historical imagination.
| Forecast Source | Target Price | Timeline |
|---|---|---|
| Goldman Sachs | ~$3,700/oz | End-2025 |
| Goldman Sachs | ~$4,000/oz | Mid-2026 |
| Technical Pattern Analysis | $8,000-$9,000/oz | Long-term bull target |
| 1980 Inflation-Adjusted Peak | Exceeded | Historical reference only |
These price targets represent analyst projections and technical interpretations only. They should not be construed as investment advice or guaranteed outcomes. All forecasts carry material uncertainty.
Are Gold Mining Equities Still Undervalued?
Despite the GDM's 50% year-to-date move, structural valuation arguments suggest the sector may not be as extended as surface-level performance figures imply. In fact, a closer look at undervalued mining stocks reveals a compelling case for continued allocation.
- Projected earnings per share growth for gold miners stands at approximately +13% to $3.92/share in 2025, followed by +8% to $4.23/share in 2026, based on FactSet consensus estimates
- Free cash flow yields for gold equities sit near 7.5%, matching energy stocks but with demonstrably superior price momentum in the underlying commodity
- The ratio of the GDM to the S&P 500 has traded in a multi-year range for approximately a decade, suggesting that mean-reversion to historical highs would imply substantial additional upside from current levels
- Gold ETF allocations represent less than 0.5% of total equity ETF assets, indicating that institutional underownership of the sector remains a structural feature rather than an exception
That final point deserves particular emphasis. In a world where passive equity investment has directed trillions of dollars into broad market index funds, gold mining equities have remained largely off the institutional radar. The moment that allocation percentage begins to shift, even modestly, the demand implication for a relatively small sector could be disproportionate.
The next major ASX story will hit our subscribers first
Silver and Copper: The Companion Outperformance Thesis
The buy zone framework that governs gold mining equities applies with equal force to silver and copper mining stocks. Silver, as both a monetary and industrial metal, carries the same leverage mechanism through operational margins and tends to amplify gold's directional moves with additional volatility. Both rounds of the 2026 buy zone cycle delivered 20%-plus gains for silver mining equity investors.
Copper presents a distinct but complementary investment case. The global buildout of artificial intelligence infrastructure, data centres, and autonomous robotics systems is generating a structural demand surge for copper that some analysts compare to oil's role in the 20th century industrial economy. Thomson's analysis frames this dynamic succinctly, suggesting that copper has effectively become the new oil in terms of strategic infrastructure necessity.
The same support zone discipline that governs gold and silver mining entries applies directly to copper equities. Key gold support levels and major equity index floors serve as the trigger conditions for copper miner accumulation as well.
This convergence is practically useful. Rather than maintaining separate monitoring frameworks for three different commodity sectors, the buy zone methodology unifies the approach, using gold price and Dow support as the master signal for deploying capital across all three metals.
Macro Forces Amplifying the Structural Case
Several macro-level conditions are simultaneously reinforcing the structural argument for hard asset exposure, though none should be interpreted as a guarantee of continued performance.
- Inflation and tariffs continue to erode real returns on fixed income instruments, pushing yield-seeking investors toward real assets
- War cycle dynamics through the 2021-2026 period have elevated geopolitical risk premiums across commodity markets
- Debt ceiling uncertainty in the United States adds a structural risk discount to government debt instruments that historically benefits gold as an alternative store of value
- Empire transition dynamics, a contested but increasingly discussed concept, suggest a long-cycle shift in global monetary dominance that historically has coincided with gold appreciation
- Asian demand, particularly from China and India (despite policy friction), remains a persistent and often underappreciated driver of physical gold absorption globally
Building a Gold Equity Allocation: A Practical Framework
For investors seeking structured exposure to gold stocks outperformance, a widely referenced starting point is a dual-layer allocation approach. Furthermore, understanding the types of gold mining stocks available is essential before committing capital.
- 5% in physical gold or gold-backed instruments serves as a core monetary hedge against currency debasement
- 5% in gold mining equities provides the leveraged return amplification mechanism, deployed with buy-zone discipline rather than continuous exposure
Within the equity component, the choice between GDX and GDXJ depends on risk tolerance and investment objective.
| ETF | Exposure | Risk Profile | Best Suited For |
|---|---|---|---|
| GDX (NYSE Arca Gold Miners ETF) | Large-cap producers | Moderate | Core long-term allocation |
| GDXJ (Junior Gold Miners ETF) | Small/mid-cap explorers | Higher | Trading positions at buy zones |
The distinction between core and trading positions matters here. A core position holds through the cycle with a long-term horizon aligned to the structural gold bull thesis. A trading position is deployed specifically at identified buy zones, sized to capture the episodic outperformance window, and reduced or exited as resistance zones are approached.
Illustrative Scenario: An investor deploying capital into GDX when gold approaches a key technical support level has historically observed the position generate 20% or more in unleveraged returns within 30 to 60 days, as gold rebounds and mining operational leverage amplifies the move. Across three such cycles in a single year, total compounded returns may substantially exceed what broad equity markets deliver across multiple years. Past patterns do not guarantee future results.
This scenario is illustrative only and does not constitute financial advice. All investments carry risk of loss, including total loss of capital. Independent, qualified financial advice should be sought before making any investment decision.
Frequently Asked Questions: Gold Stocks Outperformance
When do gold stocks actually outperform gold bullion?
Mining equities deliver their strongest relative outperformance when purchased at or near established technical support zones in both gold's price and key equity index levels. The phenomenon is episodic rather than continuous. It concentrates in the period immediately following capitulation lows and dissipates as prices approach resistance. Research from Canadian Mining Report similarly confirms that top analysts expect miners to outperform bullion through 2026, reinforcing this cyclical framework.
How significant can the outperformance be in a single cycle?
Based on observed 2026 market behaviour, disciplined entry at key support zones has delivered unleveraged gains exceeding 20% within one to two months from the entry point, a return magnitude that diversified equity market exposure may require multiple years to achieve.
Do silver and copper stocks use the same framework?
Yes. The same gold price and equity index support zones that trigger gold miner buy signals function as the entry conditions for silver and copper mining equities. The underlying mechanism is consistent across all three metals, though silver and copper carry their own commodity-specific demand and supply dynamics.
Is gold's long-term bull market still intact?
Technical pattern analysis, institutional price forecasts, and the structural monetary dynamic of relentless private credit expansion all point toward continued gold strength over the long term. Gold has already exceeded its inflation-adjusted 1980 peak, and multiple institutional frameworks project further appreciation toward the $4,000 per ounce range in the near term.
How does gold protect against fiat currency erosion?
Regardless of central bank policy shifts, commercial bank lending expands the private money supply persistently. This continuous credit creation dilutes the purchasing power of paper currency over time. Gold, as a commodity with constrained supply growth, maintains its relative value against a monetary base that expands without equivalent constraint.
Key Takeaways
- Gold mining equities offer structurally leveraged exposure to gold price gains through the operational profit amplification mechanism inherent in fixed-cost production models
- Gold stocks outperformance is episodic and entry-point dependent, making buy zone discipline the single most important variable in the mining equity investment approach
- The GDM delivered approximately +50% year-to-date through April 2026, while the S&P 500 fell 10% over the same period
- Institutional price targets range from $3,700 to $4,000 per ounce in the near term, with long-term technical pattern analysis suggesting $8,000 to $9,000 as a potential multi-year target
- Silver and copper mining equities follow analogous frameworks and offer complementary outperformance opportunities within the same buy zone methodology
- Gold ETF allocations remain below 0.5% of total equity ETF assets, pointing to significant and persistent institutional underownership
- A structured dual-layer allocation of 5% physical gold and 5% mining equities represents a widely referenced starting framework for structured precious metals exposure
Disclaimer: This article is for informational purposes only and does not constitute financial, investment, or professional advice. All investment decisions involve risk, including the potential loss of capital. Readers should consult qualified, licensed financial advisors before making any investment decisions. Price targets and performance data referenced herein are drawn from publicly available analyst commentary and market analysis and carry no guarantee of future performance.
Want to Know When the Next Major ASX Mineral Discovery Could Deliver Outsized Returns?
Discovery Alert's proprietary Discovery IQ model scans ASX announcements in real time, instantly identifying high-potential mineral discoveries across gold, silver, copper, and more than 30 other commodities — translating complex data into clear, actionable opportunities for both traders and long-term investors. Explore how historic discoveries have generated exceptional market returns on Discovery Alert's dedicated discoveries page, and begin your 14-day free trial today to position yourself ahead of the broader market.