
July 21, 2026
Understanding the Macroeconomic Foundation Behind Record Gold Valuations
The Federal Reserve's monetary policy stance creates a complex environment where rate cut expectations collide with economic resilience indicators. Real interest rates, calculated as nominal yields minus inflation expectations, remain deeply negative across multiple time horizons, making non-yielding assets increasingly attractive to yield-seeking investors. This dynamic intensifies when Treasury Inflation-Protected Securities (TIPS) breakeven spreads widen, signaling market concerns about future purchasing power erosion.
Dollar weakness emerges as a structural catalyst when analyzing gold climbs to fresh records throughout 2026. The Dollar Index (DXY) performance demonstrates inverse correlation patterns with precious metals, particularly during periods when fiscal uncertainty undermines confidence in U.S. monetary stability. Furthermore, government shutdown scenarios create additional pressure on currency markets, as delayed economic data releases and suspended government operations generate uncertainty about policy implementation effectiveness.
International reserve diversification trends accelerate as central banks reduce dollar-denominated holdings in favour of gold accumulation. This shift represents a fundamental change in global monetary architecture, where emerging market central banks actively purchase physical gold to hedge against currency volatility and geopolitical risks. In addition, the People's Bank of China, Reserve Bank of India, and various Eastern European central banks have substantially increased gold reserves, creating sustained demand pressure that supports elevated price levels.
Real Interest Rate Dynamics and Monetary Policy Implications
Current monetary conditions reveal significant distortions in traditional risk-free rate calculations. When the federal funds rate remains below core inflation measures, real borrowing costs turn negative, effectively penalising cash holdings and encouraging alternative asset allocation. This phenomenon becomes particularly pronounced during periods when Federal Reserve communication suggests prolonged accommodation despite economic strength indicators.
Options market positioning reflects institutional hedging behaviour as uncertainty about future rate trajectories increases. Gamma exposure calculations show concentrated option interest around key psychological levels, suggesting potential volatility acceleration if gold climbs to fresh records beyond current resistance zones. Consequently, these technical factors amplify fundamental demand drivers, creating feedback loops that sustain momentum in precious metals markets.
When big ASX news breaks, our subscribers know first
Historical Valuation Context and Inflation-Adjusted Price Analysis
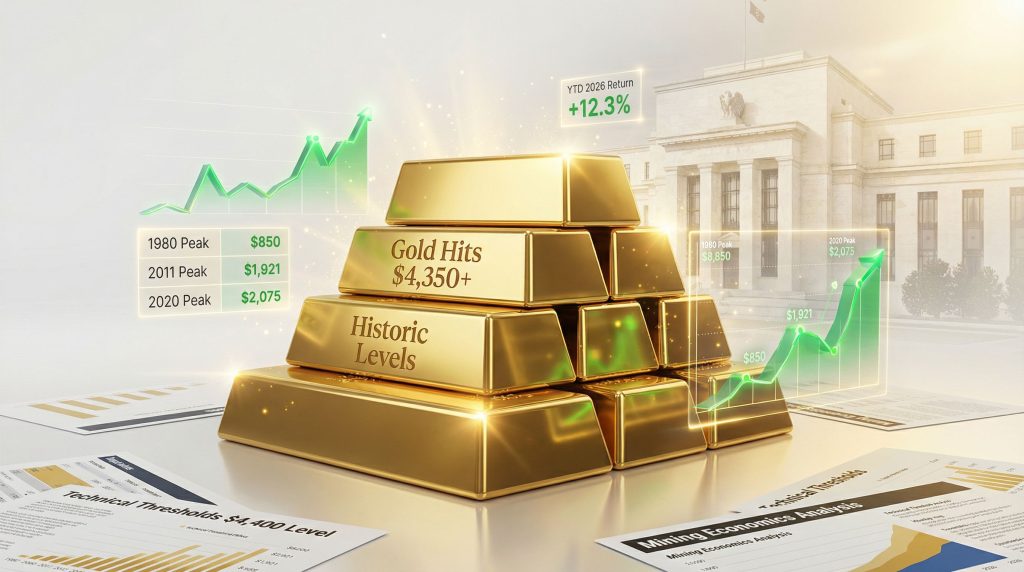
Purchasing power parity analysis reveals critical insights about current gold valuations relative to historical precedents. The 1980 peak of $850 per ounce translates to approximately $3,200 in 2026 dollars when adjusted for cumulative inflation, suggesting current levels above $4,300 represent a significant premium to historical norms. However, this comparison overlooks structural changes in global monetary systems, including expanded central bank balance sheets and increased financial market complexity.
Historical Gold Price Milestones in Real Terms:
| Period | Nominal High | 2026 Inflation-Adjusted | Current Premium/Discount |
|---|---|---|---|
| 1980 Peak | $850 | $3,200 | +34% premium |
| 2011 Peak | $1,921 | $2,650 | +63% premium |
| 2020 Peak | $2,075 | $2,450 | +76% premium |
The 2011 bull market peak occurred during European sovereign debt crises and quantitative easing program implementations across major central banks. Current conditions share similarities with that period, including concerns about government debt sustainability and unconventional monetary policies. However, 2026 market dynamics incorporate additional factors such as cryptocurrency adoption, increased retail investor participation, and heightened geopolitical tensions that were less prominent during previous cycles.
Real gold prices demonstrate cyclical patterns that correspond with long-term inflation trends and monetary policy cycles. The Bretton Woods system collapse in 1971 marked the beginning of fiat currency dominance, creating structural demand for gold as an alternative monetary asset. For instance, each subsequent inflation cycle has driven gold to new nominal highs, though real price appreciation depends on the magnitude of currency debasement relative to precious metals supply growth.
Comparative Analysis with Previous Bull Market Cycles
The 2008-2012 gold rally coincided with aggressive central bank intervention following the global financial crisis. Quantitative easing programs expanded money supply dramatically, while zero interest rate policies eliminated opportunity costs for holding non-yielding assets. Current conditions mirror this environment, with additional complexities including trade wars, pandemic-related fiscal stimulus, and increased financial market interconnectedness.
Mining production costs have increased significantly since previous bull markets due to environmental regulations, labour cost inflation, and resource depletion at existing operations. All-in sustaining costs (AISC) for major gold producers now average above $1,200 per ounce, providing fundamental support for higher price levels. This cost structure creates a floor beneath gold prices that was lower during earlier cycles when production economics were more favourable.
Geopolitical Risk Premium and Safe-Haven Demand Analysis
Quantifying safe-haven demand requires analysing capital flows during periods of increased uncertainty. Risk-off episodes typically drive institutional investors toward assets perceived as stores of value, with gold benefiting from its historical role as a monetary metal. Current geopolitical tensions span multiple regions, including trade disputes, territorial conflicts, and sanctions regimes that complicate international commerce and currency relationships.
Central bank gold accumulation patterns reflect strategic diversification away from traditional reserve assets. The World Gold Council reports that official sector purchases reached multi-decade highs in recent years, with emerging market central banks leading this trend. These institutional purchases represent price-insensitive demand that provides fundamental support during market volatility periods.
Factors Contributing to Geopolitical Risk Premium:
• Trade tariff implementation creating currency market instability
• Military conflicts affecting commodity supply chains
• Sanctions regimes limiting access to traditional financial systems
• Cyber warfare threats targeting financial infrastructure
• Climate change impacts on agricultural and energy resources
Retail versus institutional demand composition has shifted substantially compared to previous cycles. Exchange-traded fund (ETF) holdings represent a larger portion of total investment demand, while retail coin and bar sales remain elevated in regions experiencing currency instability. This diversified demand base provides stability during market corrections, as different investor categories respond to varying catalysts.
Currency Debasement Concerns and International Monetary Stability
Emerging market currency pressures create indirect demand for dollar-denominated gold as local purchasing power erodes. Countries experiencing high inflation or currency volatility often see increased precious metals demand from citizens seeking to preserve wealth. This phenomenon becomes self-reinforcing when local currency weakness accelerates, driving additional safe-haven flows into internationally traded assets.
Cryptocurrency adoption presents both competition and complementary demand for traditional safe-haven assets. While digital currencies attract younger investors seeking inflation hedges, gold maintains appeal for institutions requiring regulatory clarity and established market infrastructure. The coexistence of these asset classes suggests expanded overall demand for alternatives to traditional fiat currencies rather than direct substitution.
Technical Resistance Levels and Market Structure Analysis
Mathematical support and resistance frameworks provide insights into potential price trajectories based on historical trading patterns. Fibonacci retracement analysis from multi-decade price ranges suggests key resistance levels around $4,400 and $4,500, where previous momentum accelerations have encountered profit-taking pressure. These technical levels often coincide with options market concentration points, amplifying volatility during approach phases.
Volume-weighted average price (VWAP) calculations reveal institutional trading behaviour around significant price levels. Large block transactions typically occur near VWAP levels, suggesting institutional accumulation or distribution patterns that influence longer-term price trends. When gold climbs to fresh records, monitoring VWAP deviations helps identify sustainable versus speculative price movements.
Critical Technical Thresholds:
• $4,400 Level: Psychological resistance with historical significance
• $4,500 Target: Measured move projection from 2025 breakout patterns
• $4,200 Support: Critical floor for maintaining bullish momentum structure
• $4,600 Extension: Long-term trend line resistance from 1980 peak
Options market positioning reflects hedging behaviour and speculative interest around key price levels. Gamma exposure calculations show how option delta changes affect underlying price movements, particularly when large option positions approach expiration dates. High gamma environments can accelerate price movements in either direction, creating volatility that may not reflect underlying fundamental conditions.
Market Liquidity Considerations and Trading Dynamics
Gold market structure encompasses multiple trading venues including London Bullion Market Association (LBMA), COMEX futures, and various ETF mechanisms. Liquidity varies significantly across these platforms, with LBMA providing the deepest physical market while COMEX offers leverage and price discovery mechanisms. Understanding these structural elements helps explain price behaviour during volatile periods.
Algorithmic trading systems increasingly influence short-term gold price movements, particularly in futures markets where electronic trading dominates. These systems respond to technical indicators, economic data releases, and momentum signals that may not reflect longer-term fundamental value. The interaction between algorithmic trading and fundamental demand creates complex price dynamics requiring careful analysis.
Mining Economics and Production Cost Analysis
All-in sustaining costs (AISC) represent comprehensive production expenses including exploration, development, and sustaining capital expenditures. Major gold producers report AISC levels averaging $1,200-1,400 per ounce, though this varies significantly by geographical location and operational complexity. Environmental compliance costs have increased substantially, adding $100-200 per ounce to total production expenses compared to previous decades.
Reserve depletion rates at existing mines create long-term supply constraints as easily accessible deposits become exhausted. New discovery trends show declining ore grades and increasing extraction complexity, requiring higher capital investments and longer development timelines. This supply-side dynamic provides fundamental support for higher gold prices independent of demand factors, particularly when the market closely watches gold trading levels.
Mining Industry Cost Structure Analysis:
| Cost Component | Average Per Ounce | Trend Direction | Key Drivers |
|---|---|---|---|
| Labour Costs | $400-600 | Increasing | Wage inflation, safety requirements |
| Energy Costs | $200-350 | Volatile | Oil prices, electricity rates |
| Environmental Compliance | $150-250 | Increasing | Regulatory requirements |
| Capital Expenditures | $300-450 | Increasing | Equipment costs, technology |
Water scarcity and climate change impacts affect operational efficiency at many mining locations. Desert regions containing significant gold deposits face increasing water costs and regulatory restrictions, while extreme weather events disrupt production schedules. These environmental factors add operational complexity and cost inflation that supports higher sustainable gold prices.
Environmental and Regulatory Pressures on Gold Supply
ESG (Environmental, Social, and Governance) compliance requirements impose additional costs on mining operations as investors and regulators demand sustainable practices. Carbon footprint reduction initiatives require significant capital investments in cleaner technologies, while community engagement programs add social responsibility expenses. These factors collectively increase the minimum viable gold price for new project development.
Permitting delays and community opposition limit new mining project development across multiple jurisdictions. Environmental impact assessments now require years to complete, while indigenous land rights and community consultation processes extend project timelines substantially. This regulatory complexity reduces the pipeline of future gold supply, creating long-term bullish pressure on prices.
Investment Vehicle Performance and Market Access Patterns
Physical gold ETF holdings serve as indicators of institutional investment demand, with major funds like SPDR Gold Trust (GLD) and iShares Gold Trust (IAU) reporting substantial inflows during market uncertainty periods. These vehicles provide price exposure without physical storage requirements, making gold investment accessible to broader investor categories including pension funds and individual retirement accounts.
Mining equity performance relative to underlying gold prices demonstrates operational leverage effects during bull market cycles. Major producers like Barrick Gold, Newmont, and AngloGold Ashanti typically exhibit beta coefficients above 1.0 relative to gold prices, meaning their stock prices move more dramatically than underlying commodity prices. This leverage attracts growth-oriented investors seeking amplified exposure to record-high gold prices appreciation.
Gold Investment Vehicle Performance Comparison (2026 YTD):
| Investment Type | Return | Volatility | Liquidity | Tax Treatment |
|---|---|---|---|---|
| Physical Gold | +12.3% | Low | Medium | Collectibles rate |
| Gold ETFs | +11.8% | Low-Medium | High | Capital gains |
| Gold Miners | +28.7% | High | Medium-High | Capital gains |
| Gold Futures | +12.1% | Medium | High | Mark-to-market |
Leveraged gold ETFs provide amplified exposure for tactical trading strategies, though these instruments carry significant volatility risks unsuitable for long-term holding. Products offering 2x or 3x daily gold price moves use derivative strategies that may not track underlying gold performance over extended periods due to compounding effects and rebalancing costs.
Tax-Efficient Gold Investment Structuring
Physical gold ownership faces collectibles tax treatment in the United States, with maximum rates reaching 28% compared to standard capital gains rates. ETF structures generally qualify for capital gains treatment, making them more tax-efficient for many investors. International tax considerations vary substantially by jurisdiction, requiring careful planning for global investment strategies.
Retirement account gold investment options include self-directed IRA structures that permit physical precious metals ownership, though storage and custodial requirements add complexity and costs. Gold ETFs within traditional retirement accounts offer simpler implementation while maintaining portfolio diversification benefits during economic uncertainty periods.
The next major ASX story will hit our subscribers first
Inflation Expectations and Currency Debasement Hedging
Breakeven inflation rate correlations with gold prices demonstrate the precious metal's effectiveness as an inflation hedge across different time horizons. Five-year and ten-year Treasury Inflation-Protected Securities (TIPS) breakeven spreads provide market-based inflation expectations that correlate with gold market performance trends patterns. When breakeven spreads widen, indicating higher inflation expectations, gold typically benefits from increased hedging demand.
M2 money supply growth rates across major economies reveal currency debasement trends that support precious metals demand. Central bank balance sheet expansion since 2008 has created unprecedented liquidity conditions, with Federal Reserve assets exceeding $8 trillion compared to less than $1 trillion before the financial crisis. This monetary expansion undermines confidence in paper currency purchasing power over time.
Wage growth data impact precious metal demand through both direct inflation pressures and indirect effects on monetary policy expectations. When wage inflation accelerates beyond Federal Reserve comfort levels, the central bank faces pressure to tighten monetary policy, potentially affecting gold through higher opportunity costs. However, persistent wage-price spirals typically benefit gold as investors seek inflation protection.
Emerging Market Inflation Dynamics and Gold Accumulation
Emerging market economies experiencing high inflation often see increased gold demand from citizens seeking wealth preservation. Countries like Turkey, Argentina, and various African nations report elevated precious metals purchases during currency crisis periods. This demand pattern creates global price support independent of developed market conditions.
Foreign exchange reserve composition changes by emerging market central banks reflect strategic diversification away from traditional reserve currencies. Gold purchases by these institutions represent long-term strategic allocation decisions rather than tactical trading, providing sustained demand that supports higher price levels across multiple economic cycles.
Scenario Analysis for Potential Price Corrections
Monetary policy pivot risks represent the primary threat to continued gold appreciation, particularly if Federal Reserve policy becomes more hawkish than market expectations. Unexpected economic strength indicators could prompt aggressive interest rate increases, raising opportunity costs for non-yielding assets. However, such scenarios must overcome substantial fiscal and political pressures favouring monetary accommodation.
Market liquidity and positioning vulnerabilities create potential correction catalysts when speculative interest reaches excessive levels. Futures market positioning data shows periods when leveraged long positions become concentrated, creating vulnerability to margin call cascades during rapid price declines. ETF redemption pressures during broader market stress can amplify gold selling pressure despite underlying fundamental support.
Key Correction Scenarios:
• Aggressive Fed Tightening: Unexpected rate increases above 6% federal funds rate
• Dollar Strength Surge: DXY rallying above 120 due to relative economic outperformance
• Recession with Deflation: Economic contraction reducing inflation expectations
• Cryptocurrency Displacement: Digital assets capturing safe-haven demand
• Supply Shock Resolution: Major new gold discoveries reducing scarcity premiums
Credit spread analysis provides early warning indicators for broader financial stress that could affect gold demand patterns. When investment-grade and high-yield credit spreads widen substantially, it typically signals economic stress that benefits safe-haven assets. However, severe financial crises can force liquidation of all assets including gold during initial phases.
Market Positioning and Sentiment Indicators
Speculative positioning in futures markets requires monitoring through Commodity Futures Trading Commission (CFTC) commitment of traders reports. When managed money positions reach extreme levels relative to historical ranges, it suggests potential contrarian signals. However, gold's fundamental demand drivers may support continued speculation beyond typical technical indicators.
Investment advisor sentiment surveys provide insight into professional recommendation trends that influence client allocation decisions. When gold recommendations reach consensus levels, it may indicate reduced marginal demand from advisory channels. Conversely, persistent scepticism among traditional advisors suggests potential demand growth as attitudes shift.
Economic Indicators Providing Early Warning Signals
Yield curve dynamics offer predictive insights into future economic conditions affecting gold demand. Inverted yield curves historically precede recessions that benefit precious metals, while steepening curves during recovery phases may pressure gold through higher opportunity costs. Current yield curve analysis must account for Federal Reserve quantitative easing distortions affecting traditional relationships.
Employment data trends provide leading indicators for Federal Reserve policy decisions that influence gold prices. Non-farm payroll strength affects rate hike probabilities, while wage inflation data impacts long-term inflation expectations. Gold investors monitor unemployment claims, job openings, and quit rates for insights into labour market tightness affecting gold price forecast outlook trajectory.
Key Economic Indicators for Gold Price Direction:
• Real Interest Rates: Treasury yields minus inflation expectations
• Dollar Index (DXY): Currency strength affecting gold's international appeal
• Credit Spreads: Financial stress indicators driving safe-haven demand
• Commodity Complex: Broad inflation pressures affecting monetary policy
• Central Bank Communication: Policy guidance affecting market expectations
International capital flow monitoring reveals global risk appetite changes affecting precious metals demand. Emerging market bond flows, developed market equity allocations, and cross-border investment patterns provide insights into investor sentiment toward risk assets versus safe havens. Gold benefits during periods when capital flows reverse from risk-seeking to risk-averse behaviour.
Cross-Asset Correlation Analysis
The gold-stock market relationship varies significantly across different market regimes and time horizons. During financial stress periods, gold often exhibits negative correlation with equities while maintaining positive correlation with bonds. However, these relationships can break down when monetary policy creates unusual market conditions affecting traditional portfolio construction assumptions.
Cryptocurrency correlation patterns with gold remain unstable and dependent on market maturity and regulatory developments. While both assets serve as alternatives to traditional currencies, their investor bases and usage patterns differ substantially. Monitoring these correlations helps identify when digital and traditional safe-haven assets compete versus complement each other.
Risk Management and Portfolio Construction Strategies
Modern portfolio theory applications for precious metal weighting suggest gold allocations between 5-15% of total portfolio value, depending on investor risk tolerance and economic outlook. This allocation provides diversification benefits during equity market corrections while limiting opportunity cost during bull markets in traditional assets. Dynamic rebalancing approaches allow tactical adjustments based on relative valuations and market conditions.
Risk parity frameworks incorporate gold's volatility characteristics and correlation patterns to determine optimal weightings within balanced portfolios. These approaches focus on risk contribution rather than dollar allocation, potentially suggesting higher gold weightings during periods when traditional assets exhibit elevated volatility or correlation.
Options strategies provide portfolio hedging mechanisms using gold-related instruments without requiring direct physical or ETF ownership. Put option purchases on equity positions combined with gold call options create synthetic hedging structures that benefit from market stress while maintaining upside participation in traditional assets.
Dynamic Allocation Frameworks During Market Cycles
Business cycle analysis suggests optimal gold investment strategies timing based on economic phase identification. During late expansion phases characterised by inflation pressures and monetary tightening risks, gold allocations typically prove beneficial. Conversely, early recovery phases with disinflationary pressures may favour reduced gold exposure in favour of growth assets.
Volatility regime identification helps determine appropriate gold allocation sizing and rebalancing frequency. High volatility environments typically benefit from reduced rebalancing frequency to avoid whipsaw effects, while low volatility periods permit more frequent tactical adjustments. Gold's role as portfolio insurance becomes more valuable during regime transitions when traditional asset correlations increase.
The convergence of monetary policy accommodation, geopolitical uncertainty, and structural economic changes creates conditions supporting continued gold strength despite elevated valuations relative to historical standards. While tactical corrections remain possible due to technical factors or sentiment shifts, fundamental drivers suggest sustained demand for monetary alternatives across multiple investor categories and geographical regions.
Investment decision-making requires careful consideration of individual circumstances, risk tolerance, and portfolio objectives when evaluating gold exposure. Professional financial advice remains essential for implementing sophisticated allocation strategies and managing the complexity of precious metals investment within broader wealth management frameworks.
Looking to capitalise on the next major mineral discovery while gold reaches record highs?
Discovery Alert's proprietary Discovery IQ model delivers real-time alerts on significant ASX mineral discoveries, empowering subscribers to identify actionable opportunities in gold and precious metals companies before the broader market reacts. With gold trading at historic levels and mining economics supporting higher prices, begin your 30-day free trial today to position yourself ahead of the market for the next major discovery.