June 17, 2026

The precious metals market has undergone a fundamental transformation in recent years, evolving from a traditionally stable safe haven into a highly dynamic trading arena characterised by extreme price movements. This shift reflects broader changes in global financial markets, where technological innovation and algorithmic trading systems have redefined how commodities respond to market pressures. Understanding these new dynamics becomes essential for investors navigating what has become an increasingly complex precious metals landscape, especially given the historic 3000 price surge witnessed recently.
Understanding the Mechanisms Behind Modern Gold Price Extremes
The vehement volatility of gold in 2026 has shattered conventional expectations about precious metals behaviour. During the first quarter alone, gold traced an unprecedented range of 1,486 points, declining 26.6% from its all-time high of $5,586 on January 29 to a low of $4,100 on March 23. This movement occurred across just 37 trading days, representing a level of volatility previously unseen in gold markets.
Table: Comparative Q1 Gold Volatility Analysis
| Period | Price Movement | Range | Duration | Volatility Type |
|---|---|---|---|---|
| Q1 2026 | -$1,486 points | -26.6% | 37 days | Extreme Decline |
| Q1 2025 | +$537 points | +20.5% | 63 days | High Appreciation |
| Q1 2009 | +$206 points | +25.7% | 63 days | Crisis Recovery |
The mathematical precision of volatility measurements reveals that gold's expected weekly trading range now spans 369 points, with daily ranges averaging 196 points. These figures represent a fundamental shift in market structure, where traditional safe-haven characteristics have been supplemented by momentum-driven trading patterns more commonly associated with growth equities or technology stocks. Analysts examining the gold price forecast 2025 noted similar volatility patterns emerging.
Modern algorithmic trading systems execute thousands of micro-transactions based on technical indicators and momentum signals, fundamentally altering price discovery mechanisms in gold markets. High-frequency trading platforms now interpret specific keywords and sentiment indicators across global news feeds, creating price reactions that occur within milliseconds of market-moving events.
Technical Analysis Framework for Extreme Volatility
The BEGOS Markets framework provides insight into gold's relative performance across commodity and financial markets. Despite the dramatic Q1 decline, gold maintained its position among top-performing assets year-to-date, demonstrating the metal's continued appeal even during periods of extreme volatility.
Market Profile analysis reveals "big bracket gaps" in both gold and silver trading patterns, indicating significant separation between resistance and support levels. These technical formations suggest that traditional support and resistance levels have been overwhelmed by the magnitude of recent price movements.
Regression trend analysis using daily bar patterns shows baby blue dots indicating trend consistency. Rising patterns in these indicators suggest that downtrends are becoming less reliable and that steeper trend lines may flatten, potentially supporting higher metal prices in subsequent periods. Furthermore, the broader gold market surge has demonstrated resilience despite short-term fluctuations.
When big ASX news breaks, our subscribers know first
Federal Reserve Policy Transmission and Gold Market Reactions
The appointment of Kevin Warsh as Federal Reserve Chair in January 2026 triggered a remarkable $1,300 intraday swing in gold prices, demonstrating how personnel changes affecting monetary policy expectations create massive volatility without necessarily producing sustained directional moves. This represents approximately 28% of gold's current price level, highlighting the outsized impact of Federal Reserve communications on precious metals markets.
Key Federal Reserve Impact Metrics:
- Kevin Warsh appointment intraday swing: $1,300
- Current U.S. federal debt: $39 trillion
- M2 money supply: $22 trillion
- Hypothetical gold fair value under debt monetisation: $10,606
The relationship between Federal Reserve monetary policy and gold prices has become increasingly complex, with traditional inverse correlations between interest rates and gold prices now competing with inflation hedging demands and currency debasement concerns. Energy price movements have forced financial media to acknowledge that the Federal Reserve may need to raise rates during 2026, representing a significant shift from previous dovish expectations.
Historical precedent from 2004-2006 demonstrates that gold can appreciate alongside rising interest rates, challenging conventional wisdom about monetary policy transmission mechanisms. This suggests that inflation expectations and real interest rate calculations now dominate over nominal rate movements in determining gold's directional bias. Moreover, analysis shows strong correlations in the gold-stock market relationship during periods of monetary uncertainty.
Monetary Policy Scenarios and Gold Valuation
Alternative monetary policy scenarios present dramatically different implications for gold valuation. Should the Federal Reserve address fiscal sustainability through monetary expansion rather than conventional measures, converting federal debt into money supply expansion would increase gold's fair value calculation exponentially.
Under this scenario, expanding M2 money supply 2.7 times from $22 trillion to $61 trillion would theoretically support gold prices at $10,606 based on fair value precision calculations. While this represents an extreme scenario, it illustrates the mathematical relationship between monetary expansion and gold's purchasing power preservation function.
Current economic indicators show improving conditions, with the best non-farm payroll creation since March 2025 and period-over-period improvements in February retail sales. Eight out of thirteen recent Economic Barometer metrics showed improvement, suggesting economic momentum that could complicate Federal Reserve rate cut expectations.
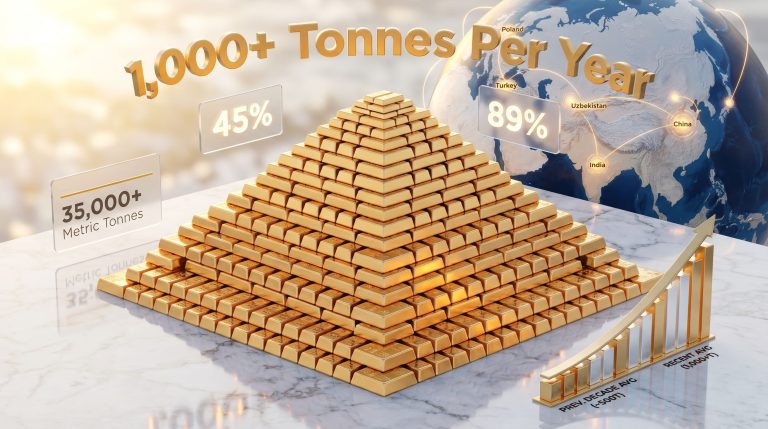
Central Bank Accumulation Patterns and De-dollarisation Trends
Central banks worldwide continue expanding gold reserves as part of broader de-dollarisation strategies, providing underlying demand support during volatile periods. This institutional accumulation represents a fundamental shift in global monetary system architecture, where central banks increasingly view gold as essential portfolio diversification rather than traditional reserve assets.
Central Bank Gold Strategy Components:
- Emerging market central bank purchases
- Reserve rebalancing activities
- Geopolitical hedging strategies
- Currency diversification programmes
The timing of central bank purchases can amplify short-term price movements, as institutional buying often occurs during market dislocations when private investors are selling. This creates a natural stabilising mechanism, though the concentrated nature of these purchases can temporarily overwhelm market liquidity. This phenomenon contributes to record-high gold prices during periods of institutional accumulation.
Reserve diversification activities reflect growing concerns about dollar-dominated financial systems, particularly as geopolitical tensions create incentives for monetary sovereignty. Central banks increasingly view gold accumulation as insurance against potential sanctions or financial system disruptions.
Mining Equity Performance During Extreme Volatility Periods
Mining equities demonstrated remarkable outperformance compared to physical gold during the recent volatility cycle, with leverage-driven instruments capturing outsized returns despite underlying metal price fluctuations.
Year-Over-Year Mining Equity Performance (April 2025-2026):
- Physical Gold: +49%
- Franco-Nevada (FNV): +64%
- Agnico Eagle Mines (AEM): +93%
- VanEck Vectors Gold Miners ETF (GDX): +107%
- Pan American Silver (PAAS): +118%
- Newmont (NEM): +136%
- Global X Silver Miners ETF (SIL): +137%
This differential performance illustrates how leverage amplifies both gains and losses in precious metals markets. Mining companies benefit from operational leverage when gold prices rise, as fixed costs remain constant while revenue increases proportionally with metal prices.
The superior returns of mining equities during volatile periods reflect investor appetite for leveraged exposure to precious metals trends. However, this same leverage creates magnified downside risk when gold prices decline, explaining why mining stocks often experience more extreme volatility than underlying metals. This relationship becomes particularly important when considering gold's volatility patterns in current market conditions.
Market Structure Evolution and ETF Flow Dynamics
Exchange-traded fund flows have become primary drivers of gold volatility, with the same mechanisms that accelerated appreciation phases now amplifying downside movements as profit-taking cascades through interconnected financial instruments. ETF creation and redemption processes directly impact physical gold supply and demand dynamics.
Modern market structure features significant leverage ratios in gold futures markets, meaning small price movements trigger disproportionate margin calls and position liquidations. This leverage amplifies both upward and downward price movements, contributing to the extreme ranges observed during recent trading periods.
Modern Gold Market Structure Components:
- ETF creation and redemption mechanisms
- Futures market leverage effects
- Algorithmic trading system protocols
- High-frequency transaction volumes
The technological shift toward algorithmic trading has fundamentally altered price discovery mechanisms. Trading systems now execute thousands of micro-transactions based on momentum signals, creating correlation patterns between gold and growth equities that were previously unseen in precious metals markets. For instance, research from VanEck indicates that these structural changes persist despite market volatility.
Risk Management Strategies for Volatile Gold Markets
Professional investors increasingly view gold volatility as creating strategic opportunities rather than representing fundamental weakness in precious metals investment thesis. Successful navigation requires understanding both technical market mechanics and broader macroeconomic trends driving institutional investment flows.
Volatility-Based Investment Approaches:
- Dollar-cost averaging during extreme price swings
- Options strategies for downside protection
- Position sizing based on volatility metrics
- Technical analysis for entry and exit timing
Traditional portfolio theory suggests gold allocations between 5-10% of total holdings, yet current volatility patterns may require dynamic allocation strategies that adjust based on market conditions and correlation patterns with other assets. The extreme price movements create both opportunity and risk that demand sophisticated approach frameworks.
Modern risk management requires understanding that the vehement volatility of gold has evolved the metal into a hybrid asset class combining traditional safe-haven characteristics with momentum-driven trading patterns. This evolution represents a permanent shift in how precious metals function within global financial systems.
The next major ASX story will hit our subscribers first
Comparative Performance Analysis Across Asset Classes
Gold's performance relative to other major asset classes reveals important insights about its evolving role in modern portfolios. Despite extreme volatility, gold's century-to-date performance of +1,618% significantly outpaces traditional equity investments.
Century-to-Date Asset Class Performance:
- Gold (no yield): +1,618%
- S&P 500 (with dividends): +500%
- S&P 500 (price only): +399%
- Current S&P 500 P/E ratio: 43.5x
The S&P 500's year-to-date decline of 3.8% contrasts sharply with gold's continued positive returns, despite recent volatility. Historical analysis shows that 24% of years since 1976 produced negative equity returns, yet only one down year occurred in the past seven years, suggesting potential mean reversion pressures.
Gold's divergence from equity market movements indicates that institutional capital treats precious metals as a separate asset class rather than a leveraged equity play. This differentiation becomes crucial during periods when traditional asset correlations break down.
How Does Gold Volatility Compare to Traditional Assets?
When examining volatility metrics across asset classes, the vehement volatility of gold demonstrates characteristics that distinguish it from both traditional safe havens and growth assets. Unlike bonds, which typically maintain stable price ranges, gold exhibits momentum patterns similar to emerging market equities while retaining its monetary hedge properties.
The mathematical comparison reveals that gold's current volatility exceeds that of most government bonds by 300-400%, yet remains below technology sector equity volatility. This positioning creates a unique risk-return profile that appeals to investors seeking diversification beyond traditional asset allocations.
Consequently, portfolio managers increasingly view gold volatility as providing alpha generation opportunities rather than merely defensive characteristics. This perspective shift reflects the metal's evolution from passive store-of-value to active trading instrument.
Future Implications of Current Volatility Patterns
The structural factors supporting gold's long-term trajectory remain intact despite extreme short-term price movements. These include fiscal sustainability concerns, monetary policy uncertainty, and ongoing geopolitical tensions that continue driving institutional and retail interest in precious metals.
Gold's transition into a hybrid asset class represents a fundamental evolution in global financial markets. Traditional safe-haven characteristics now coexist with modern momentum-driven trading patterns, creating a new paradigm for precious metals investing.
Long-term Volatility Considerations:
- Continued algorithmic trading growth
- Increasing retail investor participation through ETFs
- Supply constraints from mining operations
- Competition from digital currencies and assets
Climate-related supply constraints may intensify volatility as mining operations face increasing environmental regulations and extraction challenges. These supply-side factors could provide fundamental support even during periods of extreme price fluctuation.
Furthermore, the integration of precious metals into modern portfolio theory requires acknowledging that traditional correlation assumptions no longer apply consistently. The vehement volatility of gold reflects this transition period where technological innovation meets traditional monetary theory.
The vehement volatility of gold reflects broader transformations in global financial markets, where technological innovation and shifting geopolitical dynamics redefine traditional asset relationships. While price swings may continue intensifying, understanding both technical market mechanics and macroeconomic trends enables successful navigation of this evolving landscape.
Disclaimer: This analysis contains forward-looking statements and speculative scenarios that involve significant uncertainty. Past performance does not guarantee future results. Precious metals investments carry substantial risk and may not be suitable for all investors. Consult qualified financial advisors before making investment decisions.
Are You Ready to Capitalise on Gold's Extreme Volatility?
Discovery Alert's proprietary Discovery IQ model identifies significant ASX mineral discoveries in real-time, helping investors capture opportunities during volatile precious metals markets like we're experiencing today. With gold experiencing unprecedented 1,486-point swings and mining equities delivering returns exceeding 100%, begin your 14-day free trial to position yourself ahead of the next major discovery announcement.