
June 29, 2026
Why the Money in Your Bank Account Is Working Against You
Most people never question the relationship between their savings account and their purchasing power. They see a balance that grows, however slowly, and interpret that as progress. The number goes up; therefore, the situation improves. This intuition is understandable, and it is wrong.
The mechanism that undermines cash savings operates silently. When the rate at which prices rise exceeds the rate at which your savings account pays interest, your money loses ground every single day. You do not see it on a bank statement. The balance never falls. But the purchasing power of that balance erodes month after month, year after year, in a process that compounds quietly over decades.
Understanding the gold vs savings account question properly requires abandoning the idea that a stable number equals stable wealth.
When big ASX news breaks, our subscribers know first
Two Functions, Two Different Instruments
Liquidity vs. Long-Term Preservation
These are not interchangeable concepts, and treating them as such is among the most costly errors a saver can make. A savings account performs one function with exceptional reliability: it holds liquid cash in a dollar-stable, accessible form. The Federal Deposit Insurance Corporation guarantees deposits up to $250,000 (FDIC), providing an institutional safety net that no other asset class replicates. For emergency reserves covering three to six months of living expenses, for near-term cash goals, for any funds with a two-to-three year horizon, there is no better instrument.
Gold performs an entirely different function. It does not guarantee dollar stability. It does not pay interest. You cannot use it to cover a car repair on a Saturday afternoon. What it does over multi-decade horizons is preserve what your money can actually purchase, independent of any central bank's policy decisions or any government's fiscal choices. Investors exploring gold as a safe haven will find that this distinction is fundamental to understanding where each asset truly belongs in a financial plan.
The Hidden Cost of Holding Cash in an Inflationary Environment
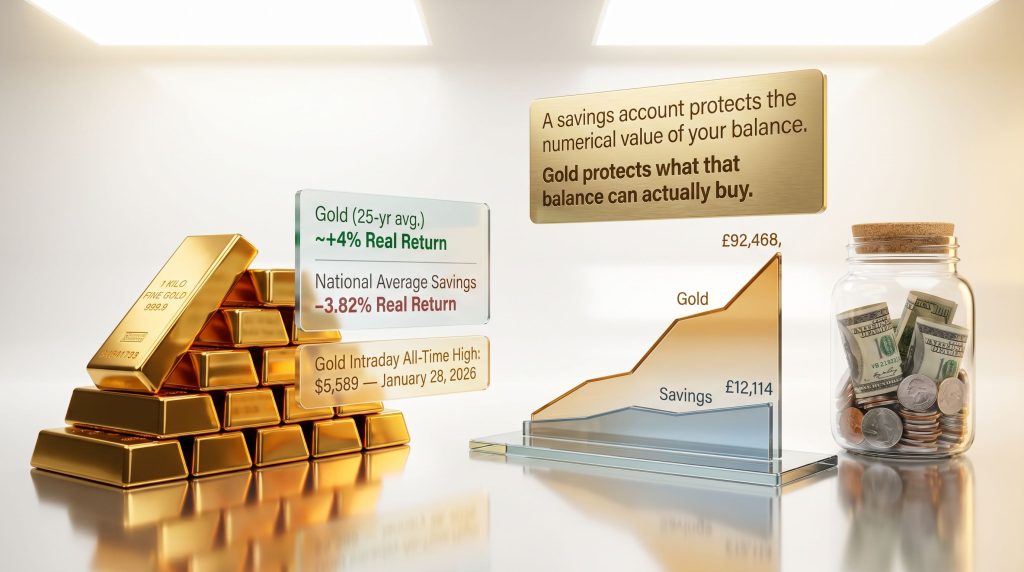
As of May 2026, the U.S. Consumer Price Index rose 4.2% year-over-year, the highest annual reading since April 2023 (U.S. Bureau of Labor Statistics, Consumer Price Index Summary, June 10, 2026). The national average savings account rate sits at 0.38% (Federal Deposit Insurance Corporation, National Rate and Rate Cap, June 2026). The arithmetic produces a real return of approximately negative 3.82% per year on a standard savings account.
The real return on any savings instrument equals its stated APY minus the prevailing inflation rate. At current figures, the average savings account holder loses nearly four cents of purchasing power for every dollar held annually, regardless of what the account balance reads.
This does not register as an emergency because the loss is invisible. The balance never decreases. However, across a ten-year retirement savings horizon, a persistent annual purchasing power loss of that magnitude is not trivial. It compounds.
What the Real Numbers Show: A Side-by-Side Comparison
The Real Return Formula Applied to Current Conditions
| Account Type | Stated APY | CPI (May 2026) | Real Return |
|---|---|---|---|
| National Average Savings | 0.38% | 4.2% | -3.82% |
| High-Yield Savings Account | ~4.20% | 4.2% | ~0.00% |
| Gold (25-yr avg. nominal) | ~10-11% | Historical avg. ~2.5% | ~+4% real |
Sources: FDIC National Rate and Rate Cap, June 2026; U.S. Bureau of Labor Statistics CPI Summary, May 2026; World Gold Council, Gold Returns Historical Data.
The high-yield savings account at approximately 4.20% APY (FDIC/NerdWallet, June 2026) is doing slightly better, delivering approximately zero real return under current conditions. That sounds neutral until you recognise that it is the best-case scenario for cash, and it still requires actively seeking out the top-tier products rather than accepting a default bank rate. For a detailed breakdown of how gold compares to savings accounts over a ten-year period, independent research confirms the structural advantage gold holds over longer time horizons.
Why Your Savings Rate Is Not Yours to Control
The Federal Reserve raised its benchmark rate eleven times between March 2022 and July 2023 (Federal Reserve Board). Savings yields followed upward, though with a lag and at a discount to the headline rate. Then the Fed cut rates three times across 2025, settling the target range at 3.50%-3.75% as of December 10, 2025 (Federal Reserve Board, FOMC Statement). Savings rates followed those cuts back down.
The mechanism is structurally important: your savings account yield is governed by a body whose mandate centres on broader economic management, not on protecting individual purchasing power. The Fed's own 2% inflation target has been breached every month since February 2021 (BLS). Throughout that period, the institution that determines what your savings earns was paying depositors less than the cost of inflation.
Gold's 25-Year Record Against a Savings Account
The Long-Run Performance Comparison
Put $10,000 into a standard savings account in January 2000. Over twenty-five years at the national average rate of approximately 0.5% annually (FDIC historical data), the nominal balance grew modestly. In real purchasing power terms, it declined throughout most of that period.
The same $10,000 allocated to gold in January 2000 tells a markedly different story. The LBMA annual average price that year was approximately $279 per ounce (LBMA PM Fix, 2000 annual average). By the 2025 full-year average, the gold price stood at approximately $3,431 per ounce (World Gold Council, Gold Demand Trends Full Year 2025; LBMA PM Fix). That original position grew to roughly fifteen times its starting dollar value in nominal terms. Furthermore, gold then set a new all-time intraday high of $5,589 on January 28, 2026 (LBMA PM Fix).
| Starting Capital | Asset | Approximate Value at Year 20 |
|---|---|---|
| £10,000 (Jan 2005) | Gold | ~£92,468 |
| £10,000 (Jan 2005) | Savings Account | ~£12,114 |
| £1,000 (Apr 2015) | Gold (10-yr) | ~£2,978 |
| £1,000 (Apr 2015) | Savings Account (10-yr) | ~£1,181 |
Note: Past performance does not guarantee future results. Gold returns reflect price appreciation only; savings figures reflect compounded interest at prevailing national average rates.
Why Gold's Returns Are Concentrated, Not Linear
Gold's long-run average masks the irregular nature of those gains. The distribution of returns is deeply tied to the monetary environment in which they occur.
- 1970s: U.S. CPI peaked at 14.8% in 1980 (BLS); gold rose approximately 1,300% across the decade, from $35 to roughly $512 by year-end 1979 (LBMA historical data)
- 2020-2021: The Federal Reserve expanded its balance sheet by more than $4.6 trillion (Federal Reserve Board, H.4.1); gold climbed from approximately $1,500 in March 2020 to above $2,000 by August 2020 (LBMA PM Fix)
- 2022: Despite eleven consecutive Fed rate hikes, gold ended the year essentially flat (LBMA PM Fix, December 2022) while major equity indices fell sharply
- 2011-2018: After peaking at approximately $1,920 in September 2011 (LBMA PM Fix), gold entered a multi-year consolidation that lasted until mid-2018
Caution: An investor who purchased gold at the January 1980 intraday peak of $850 waited approximately 27 years before the nominal price recovered to that level. Entry point and duration are not secondary considerations. They are primary ones.
The Real Interest Rate: The Single Most Predictive Variable
How Real Rates Determine Gold's Relative Attractiveness
The gold vs savings account debate is most precisely framed through the lens of the real interest rate, which is simply the nominal rate minus prevailing inflation. When real rates are deeply negative, the opportunity cost of holding a non-yielding asset like gold falls toward zero. Cash instruments are technically losing purchasing power. Gold's absence of yield stops being a disadvantage when cash is also generating a negative real return.
Current conditions as of June 2026:
- Federal funds target range: 3.50%-3.75% (Federal Reserve Board)
- CPI year-over-year: 4.2% (BLS, May 2026)
- Implied real federal funds rate: approximately -0.5% to -0.7%
| Period | Real Rate Environment | Gold's Behaviour |
|---|---|---|
| 1970s | Deeply negative | Rose ~1,300% |
| 1980-2000 | Strongly positive (Volcker/Greenspan era) | Fell from $850 to ~$255 |
| 2008-2021 | Near-zero to negative | Sustained multi-year bull run |
| 2022-2023 | Turned briefly positive | Consolidation; held value vs. equities |
| 2024-2026 | Marginally negative to zero | New all-time highs above $5,500 |
Sources: Federal Reserve Board H.15; BLS CPI-U; LBMA PM Fix historical data.
Why Negative Real Rates Are a Structural Feature, Not an Anomaly
Since the 2008 global financial crisis, real interest rates have been negative or only marginally positive for the majority of the period (Federal Reserve Board H.15 Selected Interest Rates; BLS CPI). This is not an accident of circumstance. Persistently low real rates are a deliberate policy instrument, used to stimulate economic activity and reduce the real burden of sovereign debt servicing.
For cash savers, this constitutes a persistent structural headwind. For gold holders, it represents a persistent structural tailwind. Investors seeking inflation protection with yield may also consider Treasury Inflation-Protected Securities (TIPS), but it is worth noting that TIPS and gold hedge different failure modes. TIPS protect against officially measured CPI. Gold protects against broader monetary debasement, currency regime changes, and systemic financial stress, none of which are captured by CPI alone.
What Gold Offers That a Savings Account Structurally Cannot
Purchasing Power Preservation Across Monetary Regimes
Since the United States ended dollar-gold convertibility on August 15, 1971, commonly referred to as the Nixon Shock, gold has risen from $35 per ounce to above $4,000. Over that same 55-year period, the U.S. dollar has lost approximately 87% of its purchasing power (U.S. Bureau of Labor Statistics, CPI-U cumulative data). Gold's annualised real return above inflation over that period has been approximately 4% per year (World Gold Council, Gold Returns Historical Data). Its average annual nominal return from 2000 to 2025: approximately 10-11% (World Gold Council / LBMA PM Fix, annual averages).
The mechanism behind this is straightforward. Gold is a physical asset in finite supply. No government can authorise the creation of additional gold. When monetary authorities expand the money supply, more currency units must be exchanged to acquire the same fixed quantity of gold. The price of gold in any given currency rises not because gold becomes more valuable in absolute terms, but because the currency buys less of everything, gold included.
Zero Counterparty Risk: When It Matters Most
Physical gold has no counterparty. Its value does not depend on any bank's solvency, any government's fiscal position, or any central bank's policy continuity. This is a qualitatively different form of protection from what FDIC insurance provides. FDIC coverage applies within the existing financial system, up to $250,000 per depositor. Physical gold operates entirely outside that system.
The institutional behaviour of sovereign wealth managers provides a useful reference point. Notably, central bank gold buying has been a dominant feature of the market, with central banks across dozens of countries acting as net buyers in 2025 (World Gold Council, Gold Demand Trends Full Year 2025). In a World Gold Council survey of 76 central banks conducted that year, 89% expected global gold reserves to increase, a record reading. The People's Bank of China and the Reserve Bank of India were among the most active accumulators. These are not retail investors speculating on price momentum. These are reserve managers with multi-decade mandates making deliberate structural allocations.
Gold's Real Limitations
Intellectual honesty requires acknowledging what gold cannot do.
- No yield: Gold generates no interest, dividends, or income of any kind
- Price volatility: Multi-year drawdowns are part of gold's verified historical record, not theoretical risk
- Limited immediate liquidity: Physical gold cannot be used to pay bills directly or accessed instantly in a banking emergency
- Storage and custodial costs: Physical ownership introduces ongoing holding expenses that savings accounts do not carry
These limitations are most consequential over short time horizons and for capital with near-term obligations. They diminish significantly in relevance as the time horizon extends beyond a decade.
The next major ASX story will hit our subscribers first
How to Structure a Gold vs. Savings Account Allocation
Matching the Instrument to the Job
The most productive reframing of the gold vs savings account question is not which is better in the abstract. It is which pool of capital each instrument is best suited to manage.
A savings account is the appropriate instrument for:
- Emergency reserves covering three to six months of living expenses
- Cash earmarked for goals within a two-to-three year window
- Funds requiring absolute dollar-denominated certainty at a known future date
- Short-term goals where a 20% price decline would be materially damaging
Gold is the appropriate instrument for:
- Wealth held over a ten-year-plus horizon with no near-term liquidity requirement
- Capital intended for retirement planning, estate transfer, or generational wealth
- Reserves held outside the banking system as a systemic hedge
- Long-term purchasing power preservation in an environment of persistent monetary expansion
What Allocation Ranges Suggest
Financial professionals commonly reference a starting range of 5% to 15% of investable assets in gold or gold-equivalent instruments as a baseline allocation (World Gold Council, Gold as a Portfolio Diversifier). Investors with stronger conviction around monetary debasement or currency risk frequently hold above this range. When evaluating physical gold vs ETFs, the cost structures, liquidity profiles, and tax treatments differ considerably, so it is worth understanding both options before committing to a format. Modern accumulation programmes now allow incremental gold purchases starting from as little as $100 per month, reducing barriers for regular savers who want to begin building a position without a large upfront commitment.
Step-by-Step: Evaluating Your Own Position
- Calculate your real return: Subtract current CPI from your savings account APY. A negative result means purchasing power is declining today
- Define your time horizon: Capital needed within three years belongs in cash instruments. Capital not needed for a decade or more is a meaningful candidate for gold allocation
- Establish your liquidity baseline: Emergency reserves must be fully funded in a liquid, FDIC-insured account before any long-term allocation is considered
- Determine a starting allocation range: Use the 5-15% framework as an anchor; adjust based on your inflation outlook, existing asset mix, and risk tolerance
- Select your gold format: Physical bullion, allocated vault storage, gold-backed IRAs, and incremental savings programmes each carry different cost structures, liquidity profiles, and tax treatments
- Monitor the key variables: Real interest rates, CPI readings, and Fed policy direction are the three primary signals that shift the relative attractiveness of gold versus cash instruments over time
Frequently Asked Questions: Gold vs. Savings Account
Is gold a better investment than a savings account?
The comparison depends entirely on time horizon and the specific function the capital needs to serve. For near-term liquidity and dollar-denominated certainty, a savings account is the superior instrument. For long-term purchasing power preservation over ten or more years, gold's historical track record — approximately 10-11% average annual nominal return from 2000-2025 and roughly 4% annualised real return since 1971 (World Gold Council / LBMA PM Fix) — is substantially stronger than any savings account has delivered over equivalent periods.
Does gold reliably protect against inflation?
Over multi-decade horizons, yes, with important caveats around entry point and duration. Gold has outpaced U.S. CPI on an annualised basis since 1971 (BLS; World Gold Council, Gold Returns Historical Data). During high-inflation periods, particularly the 1970s and the post-2020 monetary expansion cycle, gold has performed especially well. During aggressive tightening cycles when real rates turn significantly positive, gold can underperform or decline. Research from the World Gold Council characterises gold as a long-run purchasing power preserver across multi-decade periods, not a year-to-year inflation trade (World Gold Council, Beyond CPI: Gold as a Strategic Inflation Hedge).
Should I move my savings into gold?
Not entirely, and not before accounting for liquidity needs. The emergency reserve function a savings account fills cannot be replicated by gold. A common approach among long-term savers is to maintain savings accounts for daily liquidity and near-term obligations while allocating the portion of wealth not expected to be needed for ten-plus years into physical gold. Financial professionals frequently cite 5-15% of investable assets as a reasonable starting allocation (World Gold Council, Gold as a Portfolio Diversifier). The current gold price forecast may also inform how aggressively investors choose to build that position over time.
What is the difference between real return and nominal return?
Nominal return is the stated interest rate or price appreciation figure. Real return subtracts the prevailing inflation rate from that figure. A savings account paying 0.38% APY while CPI runs at 4.2% has a nominal return of 0.38% and a real return of approximately -3.82%. Even the best high-yield accounts at approximately 4.20% APY deliver real returns of roughly zero under current conditions. A genuinely positive real return requires earning more than the prevailing inflation rate — a threshold the national average savings account has not consistently cleared since 2022. For further context, ABC Bullion's analysis of gold versus cash provides a clear breakdown of how the two assets have compared over time.
Key Decision Framework: Gold vs. Savings Account at a Glance
| Decision Factor | Savings Account | Gold |
|---|---|---|
| Time Horizon | Under 3 years | 10+ years |
| Primary Function | Liquidity and dollar stability | Purchasing power preservation |
| Real Return (current) | ~-3.82% (national avg.) | ~+4% annualised (since 1971) |
| Counterparty Risk | Bank and government dependent | Negligible (physical) |
| Yield | Yes (variable, Fed-linked) | None |
| Inflation Protection | Only if APY exceeds CPI | Structurally strong long-term |
| Liquidity | Immediate | Moderate (24-48 hrs typical) |
| FDIC Guarantee | Yes (up to $250,000) | No |
| Recommended Allocation | Emergency fund and short-term goals | 5-15% of investable assets |
Building a Financial Structure That Accounts for Both
Why the Either/Or Framing Misses the Point
The gold vs savings account question is not a competition with one winner. Each instrument occupies a distinct and irreplaceable position within a coherent financial structure. The savings account handles liquidity, dollar certainty, and near-term obligations with a level of reliability no other instrument matches. Gold handles the long-duration portion of a financial life: the capital held for retirement, the reserves held outside any single institution's balance sheet, the wealth measured in decades rather than quarters.
The Compounding Cost of Ignoring Real Returns
At a real return of -3.82% annually, a $100,000 savings balance loses approximately $3,820 in purchasing power in the first year alone, even as the nominal balance grows. Over a ten-year period, the cumulative erosion at that rate exceeds 30% of the original purchasing power. Over a full retirement savings horizon of twenty to thirty years, the divergence between nominal and real outcomes becomes the defining difference between arriving with the financial capacity you planned for and arriving with substantially less.
Most people do not run this calculation. The mechanism operates whether or not it is being watched. Awareness of it is the first practical step toward addressing it.
The case for holding both instruments, rather than choosing between them, rests on this recognition. Emergency reserves and near-term capital belong in savings accounts. Long-duration wealth — the portion not expected to be touched for a decade or more — benefits structurally from an allocation to an asset with a 55-year record of real return generation above inflation.
Both tools are necessary. Neither is sufficient on its own.
Disclaimer: This article is for informational purposes only and does not constitute financial or investment advice. All historical return data is sourced from publicly available records including the World Gold Council, LBMA PM Fix, U.S. Bureau of Labor Statistics, and the Federal Reserve Board. Past performance is not a guarantee of future results. Readers should consult a qualified financial adviser before making any investment decisions.
Want to Identify the Next Major ASX Mineral Discovery Before the Broader Market Does?
Discovery Alert's proprietary Discovery IQ model delivers real-time alerts on significant ASX mineral discoveries, instantly translating complex mineral data into actionable investment insights suited to traders and long-term investors alike — start your 14-day free trial today and gain a market-leading edge. To understand how historic discoveries have generated substantial returns, explore Discovery Alert's dedicated discoveries page and see the transformative outcomes that have defined the sector.