June 16, 2026
The Asymmetric Bet Hiding Inside Every Oil Price Forecast
Few commodity markets demonstrate the tension between short-term diplomacy and long-term structural risk as vividly as crude oil. When a single maritime corridor carries roughly one-fifth of the world's daily oil and LNG supply, the signing of a preliminary peace agreement does not resolve the underlying vulnerability — it simply reprices the probability of disruption. That is precisely the analytical challenge confronting institutional forecasters in the wake of the US-Iran memorandum of understanding, and Goldman cuts oil price forecasts after US-Iran deal to reopen Strait of Hormuz has consequently become one of the most scrutinised headlines in energy markets.
Understanding what those forecast cuts actually mean requires moving beyond the headline numbers and into the scenario architecture that drives them.
When big ASX news breaks, our subscribers know first
Why the Strait of Hormuz Has No Real Substitute
The Geography That Keeps Energy Markets Hostage
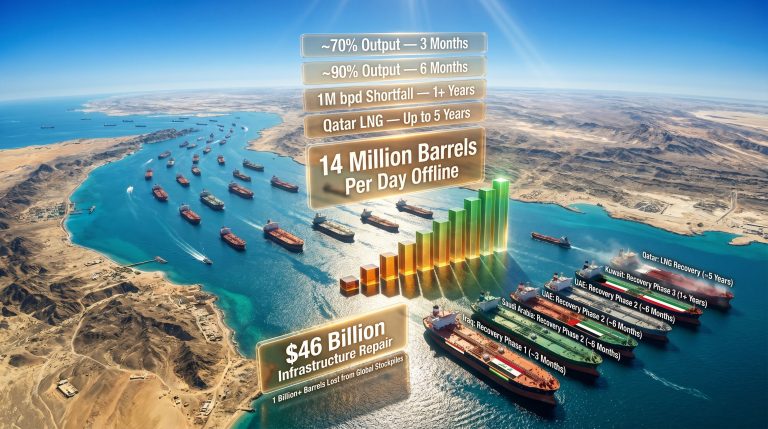
The Strait of Hormuz is a narrow passage connecting the Persian Gulf to the Gulf of Oman, and through it flows approximately one-fifth of global oil and liquefied natural gas supply. What makes this chokepoint categorically different from other strategic maritime passages is the near-total absence of scalable alternatives.
The Suez Canal, for instance, can be bypassed via the Cape of Good Hope at significant cost and time delay. Hormuz has no equivalent workaround for the volumes involved. Existing overland pipeline infrastructure across the Arabian Peninsula — including the East-West Pipeline in Saudi Arabia and the Abu Dhabi Crude Oil Pipeline — can absorb only a fraction of normal tanker throughput. When those pipelines operate at maximum capacity, they still leave the majority of Gulf export volume dependent on the Strait remaining open.
This geographic reality creates what traders refer to as embedded optionality in crude pricing. Any geopolitical actor with the capacity to threaten Strait access holds a form of leverage over global energy markets that cannot be diversified away through infrastructure investment alone — at least not within a timeframe relevant to near-term price forecasting. Furthermore, crude oil trade geopolitics continue to shape how analysts model these risks across multiple time horizons.
Quantifying the Price Impact: A Disruption Framework
Goldman Sachs research provides a useful quantitative anchor for understanding how Hormuz disruptions translate into price movements:
- Full closure lasting 30 days: Estimated upward pressure of $10 to $15 per barrel on global crude benchmarks, contingent on how effectively pipeline alternatives offset lost tanker flows
- Partial closure (50% flow restriction) over 30 days: A more contained impact of approximately $4 per barrel, assuming alternative routing is maximised
- Extended disruption beyond 30 days: The price effect compounds as pipeline offset capacity reaches its ceiling and strategic petroleum reserves begin to be drawn down
These figures are not static. The longer a disruption persists, the steeper the marginal price impact becomes, because spare capacity buffers erode and demand destruction in price-sensitive economies takes time to materialise.
The MOU That Moved Markets: What the Diplomatic Instrument Actually Represents
Preliminary Agreements and the Fragility Premium
In mid-June 2026, U.S. President Donald Trump confirmed the signing of a memorandum of understanding connected to ending the U.S.-Israeli conflict with Iran, the conflict that had precipitated the Strait of Hormuz closure in the first place. Oil markets responded with immediate force — Brent and WTI prices fell nearly 5% to their lowest levels since March 10, reflecting the rapid removal of a war risk premium that had been embedded in forward curves for weeks.
However, a memorandum of understanding is a preliminary diplomatic instrument, not a binding treaty. The distinction matters enormously in commodity risk pricing. MOUs signal intent and establish a framework for negotiation; they do not guarantee operational outcomes. Multiple analysts characterised the ceasefire arrangement as fragile, and at the time of announcement, the mechanisms for verifying tanker traffic restoration had not been fully operationalised.
Key distinction for market participants: The gap between a signed MOU and the physical normalisation of Hormuz tanker flows represents a material uncertainty window. Forward curve pricing in the days following the announcement was essentially a bet on the probability of MOU compliance, not the certainty of it.
Goldman Sachs analysts noted that their revised timeline projects Gulf exports returning to pre-conflict levels by end of July 2026, pulled forward from their prior estimate of end of August 2026. That four-week acceleration in the normalisation assumption is the primary mechanical driver behind the bank's downward revision to its price forecasts. Consequently, Goldman cuts oil price forecasts after US-Iran deal to reopen Strait of Hormuz represents one of the most closely followed institutional reassessments in recent memory.
Goldman's Revised Price Architecture: Two Cuts in One Week
Sequential Forecast Adjustments as Real-Time Scenario Updating
Goldman Sachs issued two consecutive downward revisions within a single week — first adjusting its 2027 outlook on a Friday, then releasing a broader revision the following Monday after the MOU announcement. This sequential approach reflects a methodology where scenario probabilities are updated dynamically as geopolitical catalysts materialise, rather than waiting for a comprehensive periodic review.
The revised forecasts as of June 16, 2026 are as follows:
| Instrument | Previous Forecast | Revised Forecast | Change |
|---|---|---|---|
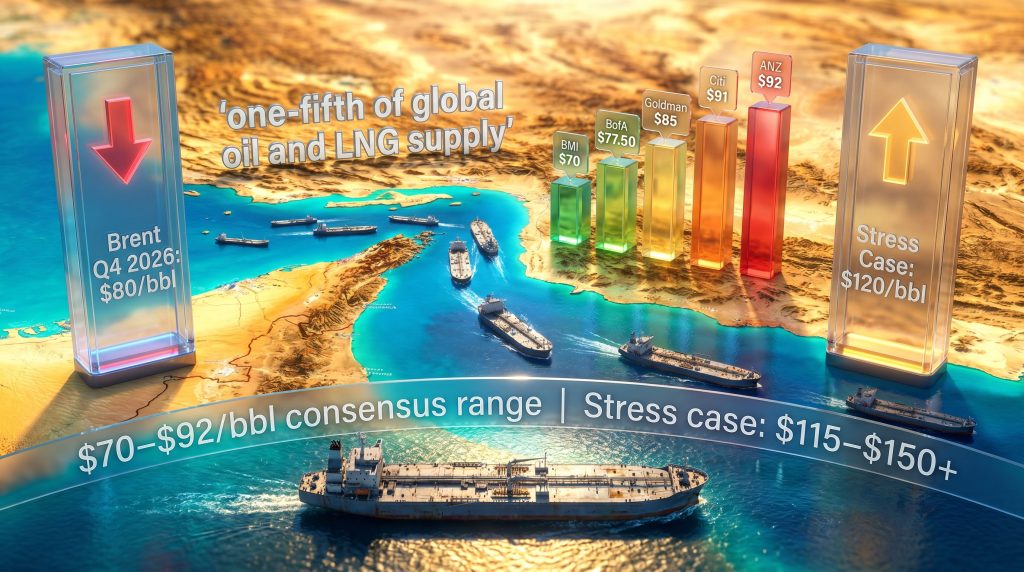
| Brent Q4 2026 | $90/bbl | $80/bbl | -$10/bbl |
| Brent Average 2026 | $90/bbl | $85/bbl | -$5/bbl |
| Brent Average 2027 | $80/bbl | $75/bbl | -$5/bbl |
| WTI Average 2026 | $85/bbl | $80/bbl | -$5/bbl |
| WTI Average 2027 | $75/bbl | $70/bbl | -$5/bbl |
The Stress Cases Goldman Has Not Abandoned
What the headline forecast cuts can obscure is that Goldman's stress-case scenarios remain materially elevated. If Strait normalisation stalls or reverses, the bank's own research implies Brent could sustain levels above $100/bbl through 2026. Under a severe and prolonged disruption scenario, Brent reaching approximately $120/bbl in Q3 2026 and $115/bbl in Q4 2026 remains within the bank's analytical range.
The base-case revision therefore reflects the most probable outcome under MOU compliance — it does not signal the elimination of upside risk. In addition, the oil price volatility guide context here is critical, as historical precedent shows that geopolitical premiums can re-embed rapidly when diplomatic arrangements prove unstable.
How Goldman's View Compares Across the Institutional Landscape
A Cross-Bank Forecast Comparison
The breadth of institutional opinion on 2026 Brent pricing reveals just how wide the uncertainty band remains:
| Institution | Brent 2026 Estimate | Brent 2027 Estimate | Key Assumption | Forecast Date |
|---|---|---|---|---|
| Goldman Sachs | $85/bbl | $75/bbl | Gulf exports normalise by end-July 2026 | June 16, 2026 |
| Citi | $91/bbl | $75/bbl | $110 Q2, $95 Q3, $80 Q4 2026 | April 26, 2026 |
| ANZ | $92/bbl | $76/bbl | Not specified | April 9, 2026 |
| Morgan Stanley | N/A | $80/bbl | Brent above $80 for remainder of 2026 | March 24, 2026 |
| J.P. Morgan | N/A | $72/bbl | $100 Q2, $90 Q3, $80 Q4 2026 | March 20, 2026 |
| Standard Chartered | $85.50/bbl | N/A | $78 Q1, $98 Q2 2026 | Not specified |
| BofA | $77.50/bbl | $66/bbl | $80 Q2, $76 Q3 2026 | March 16, 2026 |
| Barclays | $85/bbl | N/A | Hormuz normalises in 2-3 weeks; $100 if 4-6 weeks | March 13, 2026 |
| Macquarie | $89.28/bbl | $74.50/bbl | Prices could reach $200 if war extends to end of June | March 27, 2026 |
| UBS | N/A | N/A | Above $150/bbl if Hormuz flows remain disrupted | April 13, 2026 |
| HSBC | $80/bbl | $70/bbl | Not specified | March 10, 2026 |
| BMI | $70/bbl | $70/bbl | $67 Q3, $69 Q4 2026 | March 12, 2026 |
Critical Divergences Worth Unpacking
Three comparisons stand out as particularly instructive for understanding where the analytical disagreements are most consequential:
- Goldman vs. Citi: Goldman's revised 2026 Brent estimate of $85/bbl sits $6/bbl below Citi's $91/bbl, a gap that traces directly to Goldman's faster-than-consensus normalisation assumption. If Citi's more cautious timeline proves correct, Goldman's forecast is already stale.
- Goldman vs. UBS (Stress Case): UBS's disruption scenario of above $150/bbl represents the most extreme upside tail risk currently active on the street. Goldman's own stress cases approach that range only under conditions of extended severe disruption.
- Goldman vs. BMI: BMI's $70/bbl 2026 estimate anchors the bearish end of the consensus range, suggesting the market's baseline views for Brent in 2026 alone span a $22/bbl band — an unusually wide dispersion reflecting genuine uncertainty.
OPEC market influence also plays a significant role in shaping where these institutional estimates ultimately converge, particularly as Gulf producers manage output during the Hormuz transition period.
Three Pathways for Oil Prices Through the Rest of 2026
Scenario 1: Clean Normalisation (Goldman's Current Base Case)
Under this pathway, Gulf exports return to pre-conflict levels by the end of July 2026 without significant interruption. Brent stabilises in the $80-$85/bbl range through Q4 2026, and the 2027 average settles near $75/bbl as underlying supply-demand fundamentals reassert price discipline.
The critical variables supporting this scenario are the speed of tanker traffic restoration and the absence of retaliatory incidents in the Strait during the transition period.
Scenario 2: Delayed Normalisation (Moderate Disruption Continuation)
If Hormuz reopening is partial or subject to intermittent restrictions through Q3 2026, Brent is likely to maintain a $90-$100/bbl range as the geopolitical risk premium remains embedded in forward curves. Goldman's pre-MOU forecasts would effectively become the operative baseline in this scenario.
This pathway is most sensitive to Iranian domestic political dynamics, U.S. enforcement posture relative to the MOU terms, and whether any incidents occur in the Strait during the transition period that market participants interpret as bad-faith compliance.
Scenario 3: MOU Breakdown (Tail Risk, Elevated Consequences)
Should the preliminary agreement collapse or fail to be operationalised, Hormuz disruption extending beyond 60 days would exhaust pipeline offset capacity and push Brent toward Goldman's stress-case range of $115-$120/bbl in H2 2026. UBS's above $150/bbl scenario would re-enter live market risk calculations, and Goldman's Hormuz closure analysis makes clear that an extended shutdown would sustain Brent above $100 throughout 2026.
The asymmetry problem: Under clean normalisation, the downside from pre-MOU pricing is approximately $10/bbl. Under MOU breakdown, the upside from current pricing is $30-$70/bbl. This asymmetric payoff profile is precisely why institutional traders maintain long volatility positions in crude even as base-case forecasts move lower.
The next major ASX story will hit our subscribers first
Structural Vulnerabilities the Hormuz Episode Has Exposed
Concentration Risk in Global Energy Transit: An Underappreciated Dynamic
One consequence of the Hormuz closure that receives insufficient analytical attention is what it reveals about the concentration of systemic risk in global energy logistics. The world's oil market architecture has evolved over decades around the assumption of open maritime access through a small number of critical passages. When that assumption breaks down — even temporarily — the cascading effects extend well beyond the crude market itself.
LNG spot prices, petrochemical feedstock costs, and freight rates for tankers globally all repriced simultaneously when Hormuz closed. This interconnection means that a Hormuz disruption is not simply an oil supply event; it is a broad energy cost shock that affects industrial competitiveness across Asia, European gas storage economics, and shipping insurance markets simultaneously.
OPEC+ Production Dynamics in the Normalisation Phase
As Gulf exports normalise, the return of previously disrupted volumes will add downward supply pressure to a market that Goldman already sees moving toward $75/bbl by 2027. The pace of this volume restoration relative to global demand growth will determine whether the 2027 oil market is characterised by surplus or balance.
OPEC demand revisions have historically lagged these kinds of supply-side shocks, and there is a less-discussed dynamic at play here: OPEC+ members who maintained or increased production during the Hormuz closure period will need to coordinate their rollback as Gulf volumes return. Coordination failures within the producer group during this transition phase represent an underappreciated source of near-term price volatility.
The Investment Cycle Consequence of Lower Prices
Lower oil prices carry a stimulative effect for energy-importing economies — particularly across Asia and Europe, where energy input costs weigh on industrial margins and consumer purchasing power. Goldman's revised Q4 2026 Brent forecast of $80/bbl, if realised, would meaningfully reduce those input costs.
However, the same price reduction compresses upstream investment economics for producers. When Brent trades in the $75-$80/bbl range for an extended period, the economics of deepwater exploration, new LNG capacity construction, and many North American shale plays become marginal or uneconomic. The resulting underinvestment in new supply capacity creates the conditions for a tighter market in 2028-2030 — a dynamic that current 2027 forecasts do not yet fully capture. Furthermore, the trade war oil impact on demand forecasting adds yet another layer of complexity to these already uncertain long-term projections.
Frequently Asked Questions
Why did Goldman Sachs issue two separate forecast cuts within a single week?
Goldman released its initial 2027 revision on a Friday, responding to evolving geopolitical signals. The second and broader revision — covering both Q4 2026 and the 2027 average — came the following Monday after the U.S.-Iran MOU was confirmed. The sequential structure reflects real-time scenario probability updating as catalysts materialise, rather than a single comprehensive reassessment on a fixed schedule.
What is Goldman's current Brent crude forecast for 2026 and 2027?
As of June 16, 2026, Goldman Sachs projects Brent at $85/bbl for full-year 2026, with the Q4 2026 estimate specifically at $80/bbl, and a 2027 average of $75/bbl, revised down from the prior estimate of $80/bbl. This means Goldman cuts oil price forecasts after US-Iran deal to reopen Strait of Hormuz amounts to a meaningful structural reassessment of the energy risk landscape.
Could oil prices still exceed $100/bbl despite the ceasefire agreement?
Yes. Goldman's own stress-case modelling retains scenarios where Brent exceeds $100/bbl in 2026 if Strait normalisation stalls or reverses. UBS has indicated prices could surpass $150/bbl under sustained disruption, and Macquarie previously flagged a $200/bbl extreme tail risk if conflict had extended to the end of June 2026. The base-case forecast cuts do not eliminate these scenarios.
What volume of oil flows through the Strait of Hormuz?
The Strait carries approximately one-fifth of global oil and LNG supply on a daily basis. A full one-month closure is estimated by Goldman Sachs to add $10-$15/bbl to global crude prices, assuming pipeline alternatives operate at maximum offset capacity.
When does Goldman expect Gulf oil exports to fully normalise?
Goldman's revised timeline projects full normalisation of Gulf exports to pre-conflict levels by the end of July 2026, accelerated by approximately four weeks from the prior estimate of end of August 2026.
What is the key difference between Goldman and J.P. Morgan's 2027 Brent outlook?
Goldman projects 2027 Brent at $75/bbl, while J.P. Morgan's most recent estimate stood at $72/bbl — a $3/bbl difference that reflects modestly more bearish long-term supply assumptions at J.P. Morgan rather than a fundamental disagreement about near-term dynamics.
The Four Variables That Will Determine Oil's Next Major Move
Market participants and investors tracking crude price direction through H2 2026 should monitor these four variables above all others:
- Hormuz Reopening Pace — The rate at which tanker traffic physically returns to pre-conflict volumes is the single most important near-term price determinant
- MOU Compliance and Durability — Whether the preliminary agreement progresses toward formal implementation without significant lapses will determine whether Scenario 1 or Scenario 2 becomes operative
- OPEC+ Coordination During the Transition — How Gulf producers manage their production levels as export capacity is restored will shape the supply trajectory through H2 2026 and into 2027
- Global Demand Resilience — Whether lower prices stimulate meaningful demand growth or whether macro headwinds limit the demand-side response will influence whether the 2027 market leans toward surplus or balance
Across major institutional forecasters, the 2026 Brent consensus range spans approximately $70-$92/bbl under normalisation assumptions, with stress-case scenarios extending to $115-$150+/bbl if the diplomatic framework deteriorates. The breadth of that range is itself a signal — it reflects genuine structural uncertainty embedded in the current oil market, not merely analytical disagreement.
This article is intended for informational purposes only and does not constitute financial or investment advice. Oil price forecasts referenced herein are subject to change and involve significant uncertainty. Past price performance and institutional estimates are not reliable indicators of future outcomes. Readers should conduct their own due diligence before making investment decisions.
Want To Stay Ahead Of The Next Major Commodity Market Shift?
Discovery Alert's proprietary Discovery IQ model delivers real-time alerts on significant ASX mineral discoveries — turning complex commodity market signals into actionable investment opportunities the moment they emerge. Explore Discovery Alert's discoveries page to understand why major resource discoveries can generate substantial market returns, and start your 14-day free trial today to position yourself ahead of the broader market.