July 15, 2026
The Hidden Complexity Behind Persian Gulf Oil Supply Restoration
Supply disruptions in global energy markets are rarely symmetrical events. When crude flows are severed, the physical, logistical, and geopolitical machinery required to restore them operates on an entirely different timeline than the diplomatic process that may have technically ended the conflict. This asymmetry sits at the heart of the current Persian Gulf crisis, and it is precisely why Goldman Sachs Gulf oil flow recovery uncertain assessments have become the dominant analytical framework for traders and policymakers navigating an exceptionally volatile second half of 2026.
The critical mistake many market participants make is treating a ceasefire or memorandum of understanding as a supply restoration event. It is not. A political agreement removes one layer of obstruction, but the physical supply chain operates beneath several additional layers, each of which must independently normalise before export volumes can recover in a meaningful and sustained way.
When big ASX news breaks, our subscribers know first
Why the Recovery Curve Is Not Linear
Goldman Sachs, in its note published via Reuters on July 15, 2026, described the anticipated further recovery in Gulf exports as likely to be uneven, with the next normalisation phase carrying substantially more uncertainty than the initial rebound that followed the U.S.-Iran memorandum of understanding concluded in June 2026. This is a technically important distinction that the market has not fully priced, and it connects directly to broader crude oil price trends that analysts have been tracking throughout the year.
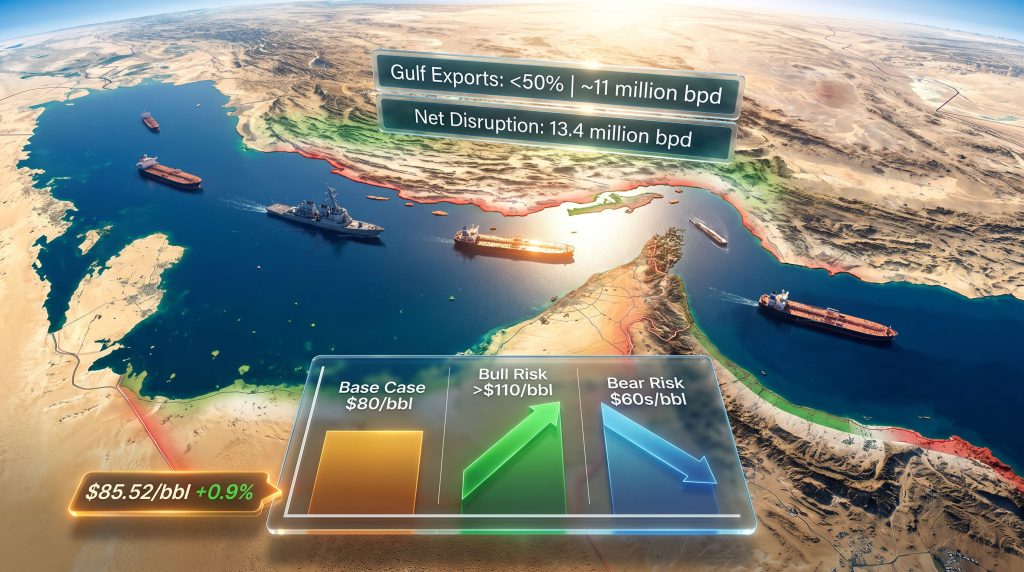
The bank's analysis identified that Persian Gulf exports had recovered to more than 80% of pre-war levels in the weeks following the June MoU, only to fall back below 50%, or approximately 11 million barrels per day (bpd), within roughly a week after fresh tanker attacks resumed in the Strait of Hormuz. This rapid reversal illustrates the fragility of the first-phase rebound: it was driven by the removal of acute military threat rather than by genuine operational normalisation.
Why Is the Second Phase Structurally Harder?
The reasons why the second phase is structurally harder to achieve include:
- Reservoir pressure degradation: When oil wells are shut in for extended periods, the natural pressure driving hydrocarbon flow to the surface dissipates. Restoring production is not simply a matter of reopening valves; workover operations and pressure restoration programmes are often required, adding weeks or months to the timeline.
- Infrastructure damage assessment: Tanker attacks and strikes on port facilities require systematic safety evaluations before normal operations can resume, creating operational delays that compound even after security conditions improve.
- Shipping lane clearance: Mine clearance operations in Strait of Hormuz shipping corridors and the management of tanker traffic backlogs create additional logistical lead times that are independent of the diplomatic timeline.
- Tanker availability and insurance: War-risk insurance premiums and vessel availability constraints can suppress effective shipping capacity even when physical security conditions nominally allow transit.
Goldman Sachs revised its normalisation timeline to late August 2026 at the earliest, while the International Energy Agency has taken a more conservative institutional position, suggesting that a full return to pre-war export levels may not materialise until early 2027. This divergence between the two leading institutional frameworks reflects genuine uncertainty rather than methodological disagreement.
The IEA's more cautious baseline incorporates structural adjustment factors, including refinery reconfiguration among importing nations, strategic inventory drawdowns, and the broader recalibration of trade flows, that Goldman's shorter-horizon analysis may weight less heavily. Neither view should be treated as definitive given the pace at which conditions are evolving.
The Scale of the Disruption: What 13.4 Million bpd Actually Means
To appreciate the severity of the current situation, context is essential. The following table illustrates the progression of Persian Gulf export volumes across the key phases of the disruption:
| Recovery Phase | Gulf Export Level (% of Pre-War) | Estimated Volume (bpd) |
|---|---|---|
| Pre-War Baseline | 100% | ~22+ million bpd |
| Post-MoU Peak Recovery | >80% | ~17.6+ million bpd |
| Current Level (Post-Renewed Attacks) | <50% | ~11 million bpd |
| Net Disruption to Persian Gulf Flows | Effectively doubled within one week | 13.4 million bpd |
Goldman Sachs noted that the estimated net hit to Persian Gulf flows doubled over a single week to reach 13.4 million bpd, a figure that carries enormous implications for global oil market balancing mechanisms. To place this in historical context, the 1990–1991 Gulf War removed approximately 4.3 million bpd from global supply at its peak according to IEA historical records, while the September 2019 Abqaiq attack temporarily disrupted roughly 5.7 million bpd. The current net disruption figure substantially exceeds both precedents.
Can Alternative Routes Compensate?
The Strait of Hormuz, through which approximately 20 to 21 percent of global oil trade transits under normal conditions according to the U.S. Energy Information Administration, has no fully equivalent alternative routing infrastructure at the volumes now at stake. Saudi Arabia's Yanbu pipeline terminal and the UAE's Fujairah port provide partial bypass capacity, however these alternatives carry hard capacity ceilings that become binding well before they can substitute for normal Hormuz throughput.
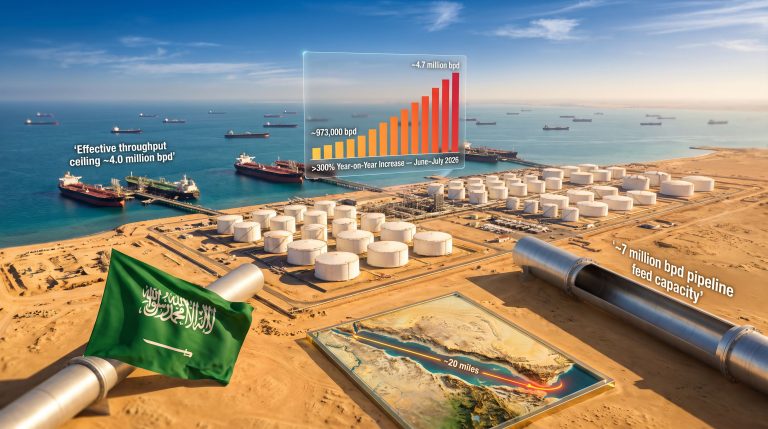
The East-West Pipeline connecting Saudi Arabia's Eastern Province to Yanbu on the Red Sea coast carries a maximum capacity of approximately 5 million bpd, a meaningful but incomplete offset when the disruption figure is more than double that volume. Furthermore, OPEC's market influence in managing these shortfalls has been closely scrutinised, as Goldman Sachs concluded that the market now requires additional adjustment mechanisms beyond conventional demand-response tools to buffer the full impact of the disruption.
Goldman Sachs's Two-Sided Price Risk Framework
One of the more analytically sophisticated aspects of Goldman Sachs's July 2026 assessment is its explicit acknowledgement of symmetrical price risk in both directions. The bank's Brent crude forecast structure is summarised below:
| Scenario | Brent Q4 2026 Forecast | Trigger Condition |
|---|---|---|
| Base Case | $80/bbl | Gradual, uneven recovery in Gulf flows |
| Upside Risk | >$110/bbl | Continued stalling of export recovery |
| Downside Risk | $60s/bbl | Rapid de-escalation and faster-than-expected production rebound |
As of July 15, 2026, Brent crude had risen 0.9% to $85.52 per barrel while WTI climbed 0.6% to $79.86 per barrel, with both benchmarks reaching their highest levels in a month after three consecutive sessions of gains. The oil price rally was driven by President Donald Trump's decision to reimpose a naval blockade on all Iranian ports, compounded by Iran's retaliatory strikes on U.S. regional infrastructure.
Why Does Escalation Move Prices Faster Than De-escalation?
The $80 base case represents a narrow central path between two extreme outcomes. What makes Goldman's framework particularly instructive is its recognition that geopolitical escalation moves prices faster than de-escalation can reverse them. This asymmetric velocity is a well-established feature of energy commodity markets during conflict periods: the risk premium inflates rapidly when threat levels rise but deflates slowly and incompletely as tensions ease, because residual uncertainty about recurrence persists long after a formal agreement is in place.
Iranian Export Suppression: The Compounding Variable
Separate from the broader Persian Gulf flow disruption, Goldman Sachs estimated that the reinstated U.S. naval blockade of Iranian ports could remove between 1.5 and 2 million bpd of Iranian crude from global supply. This is not an independent variable from the broader disruption; it compounds it. Consequently, the trade war impact on oil markets has taken on renewed significance as sanctions and blockades layer additional pressure onto an already strained supply picture.
Iran has historically maintained a dual-track export structure: formally reported volumes and a substantial shadow fleet of vessels operating outside Western sanctions frameworks, primarily supplying Chinese independent refineries known as teapots. The naval blockade targets both tracks simultaneously, creating a supply withdrawal that is harder to substitute than sanctioned volumes alone.
The 60-day diplomatic negotiation window embedded in the current framework introduces an additional temporal risk factor. If negotiations break down, or if Iran's crude sales waiver is revoked, Persian Gulf flows could deteriorate materially below current levels. This creates a countdown dynamic that market participants must factor into positioning decisions, particularly for contracts settling in Q3 and Q4 2026. According to Goldman Sachs's published research, the duration and severity of the Iran conflict will be central to determining how quickly supply can realistically return.
China's Demand Collapse and What a Floor Means for Price Trajectories
The demand side of the equation introduces a partially counterbalancing force that complicates the simple supply-shock narrative. China's crude imports fell by approximately 5 million bpd year-on-year in June 2026, reaching near decade-low levels. Goldman Sachs assessed that this import contraction may have found a cyclical floor, implying that a demand-side recovery is possible in subsequent months.
The interaction between a Chinese demand recovery and persistently suppressed Gulf supply creates one of the most consequential scenario intersections for the second half of 2026:
- If Chinese demand recovers while Gulf supply remains at or below 50% of pre-war levels, the upward price pressure could be substantially amplified beyond what either factor would generate independently.
- If Chinese demand recovers while Gulf supply also begins normalising, the two forces may partially offset each other, supporting a trajectory closer to Goldman's $80 base case.
- If Chinese demand remains depressed while Gulf supply stays constrained, the market enters a sustained stagflationary energy environment where elevated prices coexist with weak demand, creating particular difficulty for central banks managing inflation expectations.
Chinese refiners have been actively drawing on strategic petroleum reserves and redirecting purchase contracts toward non-Gulf suppliers including West African, Russian, and Latin American crude grades. However, refinery configuration constraints, crude quality differentials, and elevated freight costs for longer-haul routes create a substitution ceiling that limits how effectively Chinese demand can pivot away from Gulf supply over a short timeframe.
The next major ASX story will hit our subscribers first
Financial Market Contagion and the GCC Banking Sector
The Gulf conflict's influence extends well beyond physical oil markets. Tech equity prices fell and bond yields rose in response to Gulf conflict escalation, consistent with historical patterns of risk-off positioning that tend to accompany Hormuz disruption events. This market volatility reset reflects the market's recognition that sustained elevated oil prices feed directly into inflation expectations, which in turn constrain central bank flexibility globally.
S&P's assessment indicated that geopolitical uncertainty and Middle East conflict conditions are likely to constrain GCC bank growth, adding a regional financial sector dimension to the economic consequences of prolonged disruption. GCC banks with significant exposure to energy sector clients, trade finance, and project lending face heightened credit risk in an environment where project economics and counterparty cash flows are under pressure.
For emerging market economies with limited capacity to absorb energy subsidy costs, sustained Brent prices above $85 to $90 per barrel represent a particularly severe fiscal stress scenario. The feedback loop between oil price shocks, central bank tightening responses, and consumer demand destruction in price-sensitive economies can amplify the global economic impact of what begins as a regional supply disruption.
Key Risk Factors That Could Derail Any Recovery Scenario
Market participants tracking the Goldman Sachs Gulf oil flow recovery uncertain assessment should monitor the following risk categories:
Operational and Technical Risks
- Reservoir pressure degradation from prolonged well shutdowns requiring costly workover intervention before production rates can be meaningfully restored
- Infrastructure damage that has not yet been fully assessed, delaying safe resumption of port and pipeline operations
- Shortage of specialised technical personnel and equipment needed for rapid recovery operations across multiple facilities simultaneously
Geopolitical Risks
- Additional tanker attacks in the Strait of Hormuz, which Goldman explicitly identified as the primary threat to the recovery trajectory
- Escalation beyond maritime interdiction to broader targeting of onshore energy infrastructure in the region
- Failure of the 60-day negotiation framework to produce a durable, verifiable security arrangement before the window closes
Market Structure Risks
- OPEC+ spare capacity deployment constraints under current production agreements limiting the group's ability to offset Gulf flow losses at scale
- The risk that price-induced demand destruction at sustained elevated levels undermines the supply-side recovery narrative by permanently altering consumption patterns in price-sensitive sectors
- Tanker traffic data through the Strait of Hormuz as a real-time leading indicator that may diverge from diplomatic announcements
What to Watch in the Coming Weeks
For investors and market participants, the following indicators will serve as the most reliable early signals of how the Goldman Sachs Gulf oil flow recovery uncertain scenario is resolving. As energy industry analysts have noted, a Hormuz flare-up could delay recovery in oil supplies well beyond current institutional forecasts:
- Progress or breakdown of the 60-day diplomatic negotiation framework between the U.S. and Iran, which sets the outer boundary of near-term recovery probability
- Tanker traffic flow data through the Strait of Hormuz as a leading physical indicator that precedes official export volume statistics
- Chinese crude import figures for July 2026 as the key demand-side signal confirming or refuting Goldman's cyclical floor hypothesis
- OPEC+ emergency production policy deliberations and whether the group has the effective spare capacity and political will to partially offset Gulf flow losses
- IEA coordinated reserve release announcements as a near-term buffer mechanism that could temporarily narrow the gap between available supply and global demand requirements
The transition from a diplomatic de-escalation event to genuine operational export normalisation involves multiple independent variables, each capable of independently stalling progress. The two-sided price risk framework Goldman Sachs has articulated reflects this genuine uncertainty honestly. With a net disruption figure that dwarfs historical precedents and a Chinese demand recovery potentially amplifying upward pressure, the second half of 2026 presents one of the more complex oil market environments of the past two decades.
This article is based on information reported by Reuters and published via Zawya on July 15, 2026. All price forecasts, scenario projections, and institutional assessments referenced herein are attributed to Goldman Sachs and the IEA as reported in that source material. This article does not constitute financial advice. Readers should conduct independent research before making investment or trading decisions. Forecasts cited represent institutional views at a specific point in time and are subject to change as conditions evolve.
Want to Position Ahead of the Next Major Resource Discovery?
While Persian Gulf supply disruptions dominate energy market headlines, Discovery Alert's proprietary Discovery IQ model scans ASX announcements in real time, delivering instant alerts on significant mineral discoveries across more than 30 commodities — turning complex data into actionable opportunities for both short-term traders and long-term investors. Explore how historic discoveries have generated substantial returns on Discovery Alert's dedicated discoveries page, and begin your 14-day free trial today to secure a market-leading edge.