
July 23, 2026
When Inventory Math Becomes a Crisis: Understanding Goldman Sachs Oil Price Forecasts for 2026
Most commodity price shocks are visible long before they detonate. Supply disruptions build gradually, demand forecasts shift by fractions, and analysts revise their models in measured increments. What makes the current Middle East oil supply shock categorically different is the sheer arithmetic of what is happening beneath the headline price moves. When Goldman Sachs commodity analysts revised their Goldman Sachs oil price forecasts in late April 2026, the revision was not merely a price-target adjustment. It was a signal that the physical mechanics of global oil supply had fractured at a scale rarely observed in the modern energy era.
Understanding what that fracture means, and what it implies across multiple price scenarios, requires looking beyond the revised numbers themselves and examining the structural forces that made them necessary. Furthermore, appreciating the oil price crash risks that preceded this moment helps contextualise just how rapidly market conditions have deteriorated.
When big ASX news breaks, our subscribers know first
The Supply-Demand Arithmetic Behind the Revised Forecasts
Oil markets entered 2026 carrying what appeared to be a comfortable cushion. A projected surplus of 1.8 million barrels per day in 2025 had created expectations of price moderation heading into the new year, with most sell-side analysts anticipating a gradual rebalancing through the first half of 2026.
That cushion has been obliterated.
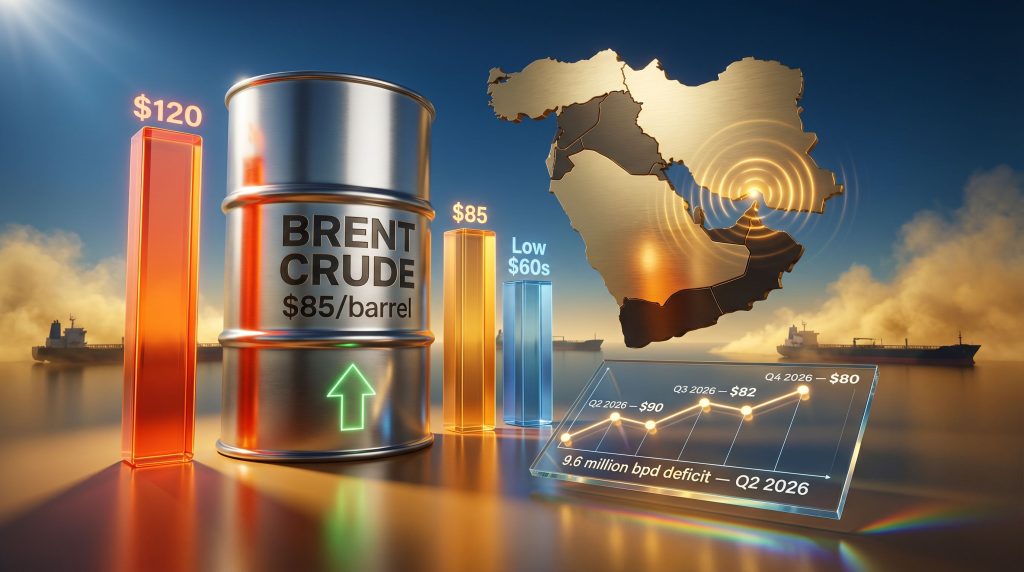
Goldman Sachs analysts, led by Daan Struyven, published a note on April 26, 2026 estimating that 14.5 million barrels per day of Middle East crude production losses are currently driving global oil inventories to draw at a record pace of 11 to 12 million barrels per day through April. The resulting market position represents one of the most abrupt supply-demand reversals in the post-2000 history of commodity markets, swinging from the 2025 surplus to a projected 9.6 million barrel-per-day deficit in Q2 2026.
Goldman Sachs analysts have noted that the economic consequences of the current disruption extend considerably further than headline crude price movements suggest, with unusually elevated refined product prices, physical shortage risks, and the unprecedented scale of the supply loss all compounding the impact beyond what crude benchmarks alone communicate. (Source: Goldman Sachs commodity research note, April 26, 2026, as reported by Reuters/Zawya)
To appreciate the historical weight of these numbers, consider that the 2019 drone strikes on Saudi Aramco's Abqaiq and Khurais facilities temporarily removed approximately 5.7 million barrels per day from global supply. That event was widely described as the largest single disruption to oil infrastructure in history. The current Middle East production loss figure is more than double that, sustained over a longer period, and compounded by transit constraints that prevent remaining Gulf output from reaching international markets efficiently.
What Goldman Sachs's Q4 2026 Oil Price Forecasts Actually Say
The Goldman Sachs oil price forecasts published in the April 26 note represent a significant upward revision from prior estimates. The bank raised its Q4 2026 Brent crude forecast to $90 per barrel, while WTI was revised upward to $83 per barrel for the same period.
| Benchmark | Q4 2026 Revised Forecast | Prior Forecast | Revision |
|---|---|---|---|
| Brent Crude | $90/barrel | $77/barrel | +$13 |
| WTI | $83/barrel | $72/barrel | +$11 |
Source: Goldman Sachs commodity research note, April 26, 2026, as reported by Reuters/Zawya
These are not fringe projections from a peripheral analyst. Goldman Sachs commodity research carries substantial weight across institutional energy markets, hedge fund positioning, and corporate hedging desks globally. When the bank revises its Brent forecast by $13 in a single note, it triggers re-pricing across derivatives markets, shifts the calculus for OPEC+ deliberations, and changes the earnings models of integrated energy majors from Houston to Riyadh.
The Demand Destruction Component
Elevated crude prices do not exist in isolation. Goldman's analysis accounts for the demand response that extreme price spikes inevitably trigger. The bank projects global oil demand falling by 1.7 million barrels per day in Q2 2026, with the full-year 2026 demand impact estimated at approximately 100,000 barrels per day on a net basis.
This demand reduction is driven primarily by the pass-through of crude price increases into refined product markets. When consumers face higher pump prices for petrol, diesel, and jet fuel, discretionary travel falls, industrial users switch to alternative feedstocks where possible, and overall petroleum consumption contracts. The relatively modest full-year demand reduction compared to the Q2 figure reflects the expectation of partial supply normalisation in the second half.
The Strait of Hormuz: Why a Single Waterway Controls the Global Equation
No analysis of the Goldman Sachs oil price forecasts is complete without a precise understanding of the Strait of Hormuz and why its status functions as the master variable in every supply scenario the bank has modelled.
The Strait is a narrow maritime corridor between the Omani and Iranian coastlines, measuring roughly 21 nautical miles at its narrowest point. Under normal operating conditions, tanker traffic transits through two shipping lanes each just 2 nautical miles wide, with a comparable separation zone. Despite this geographical constraint, approximately 20 percent of globally traded oil passes through the Strait on any given day.
There is no straightforward alternative. Pipeline bypass capacity exists in limited form:
- The Abu Dhabi Crude Oil Pipeline (ADCOP) can transport roughly 1.5 million barrels per day around the Strait via the UAE's Fujairah terminal
- Saudi Arabia's East-West Pipeline (Petroline) offers approximately 5 million barrels per day of theoretical capacity, though operational rates depend on upstream inputs
- The SUMED pipeline in Egypt provides additional but geographically distant routing capacity
None of these alternatives come close to replacing Hormuz's throughput at full disruption, which is precisely why Goldman's revised timeline carries such significance.
Goldman's base case now assumes that normalisation of Gulf exports through the Strait will not occur until end of June 2026, pushed back from a prior mid-May estimate. This six-to-seven-week extension to the disruption timeline compounds inventory pressure considerably. The bank also models a slower-than-expected production recovery even after Hormuz reopens, reflecting the reality that restarting large-scale crude output is an industrial process that cannot be executed instantly.
This production ramp-up dynamic is frequently underappreciated in popular coverage of oil supply shocks. When the 2019 Abqaiq attacks removed Saudi output temporarily, full recovery took approximately 60 days despite Aramco's world-class engineering resources. For a disruption of the current magnitude, a months-long recovery trajectory after reopening is a reasonable central assumption.
Goldman's Three-Scenario Framework: Reading the Full Risk Envelope
The most analytically valuable dimension of Goldman's oil price forecasting methodology is not the headline base case number. It is the probability-weighted scenario architecture surrounding it. Institutional energy traders and corporate risk managers use this range, not the central estimate, to calibrate their actual exposure.
Goldman's current framework spans three distinct pathways:
Scenario 1: Base Case
The bank's central estimate assumes Hormuz reopens by end-June, Gulf production recovers at a moderate pace, and demand destruction from elevated refined product prices contains the full-year demand impact to around 100,000 barrels per day. Under this scenario, Q4 2026 Brent settles at $90 per barrel.
Scenario 2: Sustained Disruption (Upside Shock)
If Hormuz remains substantially closed for an additional month beyond the end-June assumption, inventory pressure intensifies significantly. Goldman has flagged that under conditions of sustained production losses near 2 million barrels per day, Brent could reach substantially higher levels in Q3 and Q4 2026, with some scenarios pointing toward the $115 to $120 per barrel range.
Scenario 3: Trade Policy Compression (Downside)
If broad-based trade tariff measures suppress global demand sufficiently, and OPEC+ resumes production increases in Q2 2026 as a consequence of limited inventory builds, Brent could fall significantly from current elevated levels. The trade war impact on oil demand is a key variable in this downside pathway, representing a demand-driven correction rather than a supply-driven one.
| Scenario | Q4 2026 Brent | Primary Driver | Tail Risk Classification |
|---|---|---|---|
| Base Case | ~$90/barrel | Partial Hormuz normalisation by June | Central estimate |
| Upside Shock | $115–$120/barrel | Extended Hormuz closure, sustained production loss | Credible upside tail |
| Downside Compression | Low $60s | Trade-induced demand destruction | Policy-dependent |
A critical analytical point: Goldman's team has explicitly noted that because extreme inventory draws of the magnitude currently being recorded are not sustainable, even sharper demand destruction may be required if the supply shock extends materially beyond current modelled timelines. This is not a rounding error in the forecast. It is a warning that the self-correcting mechanism of the oil market, demand falling fast enough to rebalance supply shortfalls, may need to operate more forcefully than current projections accommodate.
The Refined Products Dimension: The Hidden Second-Order Risk
One of the less widely discussed aspects of Goldman's analysis is the emphasis placed on refined product markets rather than crude oil alone. This distinction matters considerably for understanding the real-world economic impact of the current disruption.
Crude oil is a raw material. What consumers, airlines, shipping companies, and industrial users actually purchase is refined products: diesel, jet fuel, naphtha, heating oil, and gasoline. In a functioning supply chain, crude price increases pass through to refined product prices with some lag, moderated by refinery margins, inventory buffers, and competitive dynamics.
When the crude supply shock is severe enough to also disrupt refinery feedstock availability in key producing regions, that moderation mechanism breaks down. Goldman's analysts have specifically flagged that refined product prices are experiencing spikes that exceed what crude price movements alone would predict. This suggests physical feedstock constraints at the refinery level, not simply financial market speculation on crude benchmarks.
The practical consequence is that the economic pain being transmitted to consumers and industrial users is greater than the crude price number implies. A business planning its fuel costs around the Brent headline figure will be underestimating its actual exposure. Goldman's warning about shortage risks in certain product categories compounds this concern further. In addition, LNG supply risks have emerged as a parallel vulnerability reinforcing the broader energy security concern.
The next major ASX story will hit our subscribers first
Regional Economic Exposure: Asymmetric Winners and Losers
A sustained Brent price environment in the $90 to $120 range does not affect all economies equally. The asymmetry between oil-exporting and oil-importing nations creates a significant redistribution of economic value with real implications for current account balances, inflation trajectories, and fiscal positions.
| Region | Net Position | Primary Impact |
|---|---|---|
| GCC (Saudi Arabia, UAE, Kuwait) | Net beneficiary | Fiscal revenue expansion, sovereign wealth fund inflows |
| India | Net importer pressure | Current account widening, currency vulnerability |
| European Union | Mixed (energy transition exposure) | Industrial cost inflation, energy security pressures |
| United States | Partially hedged | Domestic production uplift offset by consumer price pressure |
| Sub-Saharan Africa | Vulnerable importers | Fuel subsidy fiscal stress, currency depreciation risk |
For GCC producers that remain outside the disruption zone, the current price environment generates substantial fiscal windfalls. Saudi Arabia's fiscal breakeven oil price has been estimated by the IMF at approximately $70 to $80 per barrel in recent years, meaning prices above $90 generate genuine surplus revenue. This creates a complex strategic calculation for OPEC+ members weighing price stability objectives against the temptation to increase market share during a period of elevated pricing.
For major oil-importing economies like India and several Southeast Asian nations, the exposure is more acute. India imports approximately 85 percent of its crude oil requirements, making it one of the most vulnerable large economies to Hormuz disruption. A sustained period of $90-plus Brent pricing would widen India's current account deficit materially and create upward pressure on domestic inflation at precisely the moment when central banks had hoped to complete their rate normalisation cycles.
OPEC+ Strategic Positioning Within the Disruption
The Goldman Sachs analysis incorporates an important variable that is often treated separately from supply shock modelling: how OPEC+ producers outside the disruption zone respond to the current price environment. OPEC's influence on oil markets remains a central force in determining whether the current elevated price environment can be sustained or whether supply additions from outside the disruption zone moderate the trajectory.
Members with available spare capacity face a genuine strategic dilemma. The disruption has tightened markets significantly, producing price levels highly favourable to producer fiscal positions. However, Goldman's modelling acknowledges that if inventory builds remain limited and demand destruction remains contained, OPEC+ may resume production increases in Q2 2026. The tension between protecting elevated price levels and expanding market share is a recurring feature of OPEC+ internal deliberations.
Goldman's downside scenario captures the consequence of a misjudgement in this calculus. If OPEC+ increases output while a trade-policy shock simultaneously suppresses demand, the combination could drive Brent into the low $60s by year-end, a $30 correction from the base case.
What the Broader Energy Complex Reveals
The Goldman Sachs oil price forecasts do not sit in isolation from the broader energy market. A related risk assessment from the International Energy Agency has estimated that ongoing Middle East conflict scenarios could eliminate as much as 120 billion cubic metres of LNG supply between 2026 and 2030. This parallel risk in natural gas markets contextualises Goldman's oil analysis within a wider energy security framework affecting power generation, industrial feedstocks, and heating markets across Europe and Asia.
The energy transition paradox also intensifies at elevated oil prices. Higher crude benchmarks accelerate the economic case for renewable energy investment by widening the cost differential between fossil fuels and alternative generation sources. Simultaneously, they generate the fiscal surpluses in oil-exporting nations that fund sovereign wealth vehicle investments in clean energy infrastructure. The current price spike may, consequently, function as an involuntary accelerant for the energy transition, even as it delivers short-term economic pain to importing nations.
How Investors and Risk Managers Should Interpret the Scenario Range
For institutional investors and commodity-exposed portfolio managers, the Goldman Sachs oil price forecasts carry a specific analytical message that differs from how they are typically read in financial media.
The base case of $90 Brent for Q4 2026 is a planning anchor, not a precision target. The scenario range, from the low $60s in the downside to $115 to $120 in the upside, is the actual risk envelope that deserves attention. As Bloomberg has reported, Goldman's upside scenarios are driven by extreme inventory draws not seen in modern market history. They are the logical consequence of a physical supply system under extraordinary stress, where the self-correcting mechanism of demand destruction has not yet had sufficient time to operate.
For energy sector equity positioning, the current environment presents differentiated opportunities:
- Upstream producers with Gulf-diversified or North American production profiles benefit from sustained elevated realised prices without Hormuz exposure
- Integrated majors gain from simultaneously elevated crude prices and refinery margins when feedstock supply tightens relative to product demand
- Tanker and shipping markets benefit from rerouting around Hormuz, with alternative corridors such as Cape of Good Hope routes generating higher day rates and longer voyage revenues
- Options markets offer asymmetric exposure to Goldman's upside tail scenarios without requiring full directional commitment to a $120 Brent outcome
The risk management implication is equally clear. Commodity-exposed businesses that assumed a stable $70 to $80 Brent environment for 2026 budget planning are now operating with an assumption that may be materially incorrect for two or three additional quarters. Furthermore, commodity volatility and hedging strategies appropriate for a high-uncertainty, multi-scenario environment are structurally different from those designed for a stable price regime.
The Structural Signal Beyond the Immediate Crisis
Goldman's April 2026 forecast revision is analytically significant not merely for its price implications but for what it reveals about the fragility of the global oil supply system. A market that entered 2026 with an apparent surplus of nearly 2 million barrels per day has found itself facing a deficit nearly five times that size within a single quarter.
The speed of that reversal exposes a fundamental vulnerability in just-in-time inventory management across global oil supply chains. Commercial inventory buffers that appeared comfortable under a surplus regime have been drawn down at rates that, as Goldman's analysts have explicitly stated, are not physically sustainable over an extended period.
The longer-term policy implication points toward renewed investment in strategic petroleum reserve depth, supply route diversification, and alternative transit infrastructure that can partially replace Hormuz functionality under stress conditions. These are multi-year infrastructure commitments that cannot address the immediate Q2 2026 deficit. However, the current disruption is likely to accelerate their prioritisation in energy security planning across major importing nations.
Disclaimer: This article is intended for informational purposes only and does not constitute financial advice or investment recommendations. Oil price forecasts involve significant uncertainty, and actual outcomes may differ materially from projections cited. Readers should consult qualified financial advisers before making investment decisions based on commodity price outlooks. Forecast data is sourced from Goldman Sachs commodity research as reported by Reuters and Zawya, April 26-27, 2026.
Want To Stay Ahead of Major Commodity Market Shifts?
Discovery Alert's proprietary Discovery IQ model delivers real-time alerts on significant ASX mineral discoveries, transforming complex commodity data into actionable investment insights — explore how historic discoveries have generated substantial returns and begin your 14-day free trial at Discovery Alert to position yourself ahead of the broader market.