August 26, 2026
The Anatomy of a Chokepoint: Understanding the Hormuz Blockade Oil Prices Crisis
Energy markets have a long memory when it comes to chokepoints. Over decades, analysts have catalogued dozens of geopolitical flashpoints, sanctions regimes, and production disputes that temporarily tilted the global crude balance. Most resolved within weeks, leaving futures curves largely intact and storage buffers replenished. What distinguishes a genuine structural supply crisis from a passing disruption is rarely the event itself but the duration of uncertainty that follows.
The Hormuz blockade oil prices crisis of 2026 has crossed that threshold, transforming from a tactical geopolitical manoeuvre into a sustained repricing of global energy risk. Understanding how this crisis unfolded, and where it is heading, requires examining the physical geography, market mechanics, institutional dynamics, and downstream consequences simultaneously, because they are no longer operating in isolation.
When big ASX news breaks, our subscribers know first
Why the Hormuz Strait Has No Substitute
The Strait of Hormuz is a narrow waterway approximately 21 miles wide at its most navigable point, connecting the Persian Gulf to the Gulf of Oman and the broader Arabian Sea. Every barrel of crude oil departing Saudi Arabia, Iraq, Kuwait, the UAE, and Iran by sea must pass through this passage. Under normal operating conditions, the strait handles somewhere between 17 and 21 million barrels of crude oil and petroleum products per day, a volume representing roughly one-fifth of global daily supply. (Argus Media, "Crude Futures Surge 7pc to New Four-Year High," 30 April 2026)
The nations most structurally exposed to Hormuz disruption are China, Japan, South Korea, and India, which collectively absorb the majority of Persian Gulf crude exports. Unlike the Suez Canal, which can be bypassed via the Cape of Good Hope at significantly higher cost and transit time, Hormuz has no comparable workaround at scale. The Sumed pipeline in Egypt and certain overland routes in the Gulf offer partial mitigation, but no combination of alternatives comes close to replacing full Hormuz throughput capacity in any commercially practical timeframe.
This absence of substitutability is precisely what makes prolonged Hormuz disruptions so structurally damaging to global oil pricing. Other chokepoints create inconvenience and elevated freight costs. A Hormuz closure, however, creates an actual physical supply gap that strategic reserves and rerouting cannot fully bridge. Furthermore, crude oil trade geopolitics have consistently demonstrated that no single alternative logistics corridor exists at sufficient scale to compensate for full Hormuz closure.
What History Reveals About Price Behaviour During Hormuz Stress
The 1980 to 1988 Tanker War, fought during the Iran-Iraq conflict, demonstrated that even partial and intermittent Hormuz interference could sustain multi-year oil price volatility. That episode lasted eight years and produced crude price swings across a range of roughly $15 to $40 per barrel in nominal terms, a period defined by chronic uncertainty rather than any single dramatic event.
The more instructive recent precedent is the June 2019 attack on tankers in the Gulf of Oman, which produced a single-day Brent price surge of approximately 15%, before prices normalised within two to three weeks as market participants concluded the disruption was isolated and unlikely to escalate into a sustained closure. The critical variable was duration: once it became clear that Hormuz itself remained navigable, the risk premium evaporated rapidly.
The current scenario is categorically different. This is not a series of isolated attacks on individual vessels. It is a formal, extended blockade, and the market's response in the forward curve reflects exactly that distinction.
Traders and portfolio managers understand, through accumulated experience, that short-duration Hormuz incidents function as noise within a longer trend. It is only when the closure horizon extends beyond approximately 30 to 60 days that futures markets begin systematically embedding structural risk premium across the forward curve, rather than treating the event as a temporary deviation from supply normality. That repricing process is precisely what unfolded across late April 2026.
Brent Crude Price Trajectory: A Multi-Phase Breakdown
The price response to the Hormuz blockade has moved through several distinct phases, each driven by a different combination of physical supply signals and geopolitical developments.
| Market Phase | Brent Price Range | Primary Catalyst |
|---|---|---|
| Pre-blockade baseline | ~$84–$88/bl | Stable Gulf shipping conditions |
| Initial blockade shock | $96–$108/bl | Supply disruption confirmed |
| Escalation peak | Up to $126.41/bl | Extended closure signals and military briefing reports |
| Stabilised trading range | $108–$123/bl | Active negotiations and SPR releases |
| Iran diplomatic signal dip | ~$90.87/bl | Brief declaration of willingness to negotiate |
| Post-seizure rebound | ~$95.14/bl | U.S. seizure of Iranian tanker |
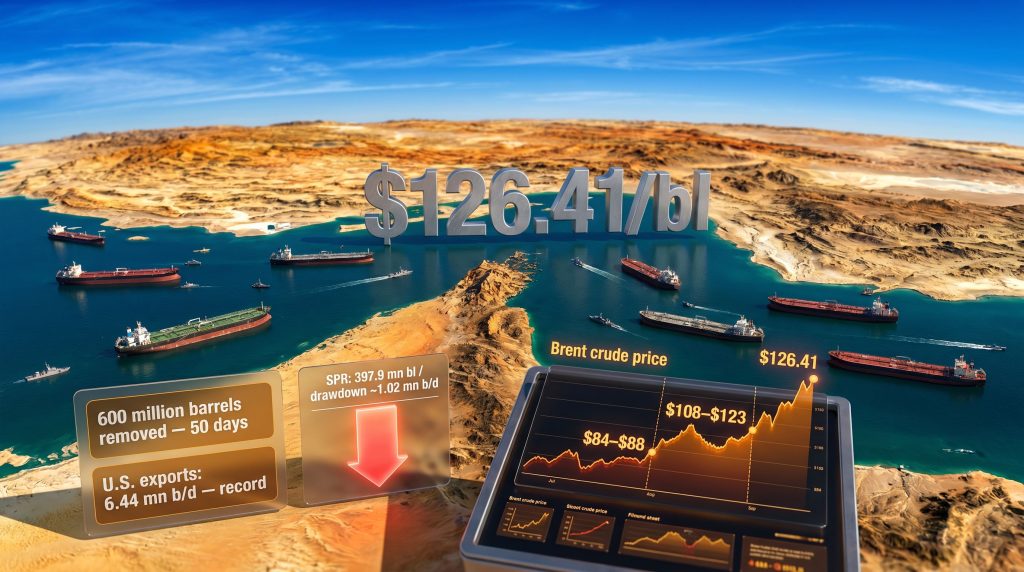
On 30 April 2026, the front-month June Brent contract on the ICE exchange reached an intraday high of $126.41 per barrel, representing a gain of more than $8 per barrel from the prior close and pushing the two-session rally to nearly 14% from the 28 April settlement. (Argus Media, "Crude Futures Surge 7pc to New Four-Year High," 30 April 2026)
A critical technical dimension layered onto the fundamental supply shock was the June contract's expiry on 30 April itself. The July Brent contract had settled at $110.44/bl the previous day, roughly 6.5% below June's settlement price. This produced an unusually steep contango structure in the front of the curve, with the June-to-July spread widening to approximately $15.97 per barrel, embedding acute near-term supply anxiety that deferred months had not yet fully priced. (Argus Media, 30 April 2026)
The Nymex WTI front-month June contract showed a comparatively more measured response, rising by 3.2%, or $3.41 per barrel, to reach a session high of $110.29 per barrel. (Argus Media, 30 April 2026) This divergence reflects the partial structural insulation that U.S. domestic crude production provides against Persian Gulf supply disruptions, but it does not eliminate American consumer exposure to globally benchmarked crude prices.
The WTI-Brent Spread as a Geopolitical Barometer
Under normal market conditions, the differential between WTI and Brent trades within a range of roughly $2 to $5 per barrel. During the blockade, with Brent trading near $123.65/bl and WTI at approximately $110.29/bl at midday on 30 April, the implied spread had widened to approximately $13 per barrel, more than double the historical upper bound.
This spread widening is not an anomaly but rather a precise signal. Brent reflects the pricing of internationally traded seaborne crude, much of which is exposed to Hormuz transit risk. WTI reflects predominantly North American supply, which routes through domestic pipeline infrastructure and Gulf of Mexico terminals entirely independent of Persian Gulf logistics. When Hormuz faces stress, the spread between these two benchmarks functions as a real-time market gauge of geopolitical risk premium specific to Persian Gulf supply vulnerability.
Quantifying the Supply Shock: 600 Million Barrels and Counting
Over the first 50 days of the blockade, an estimated 600 million barrels of crude oil and petroleum products have been prevented from reaching international markets. To contextualise that figure: at 17 to 21 million barrels of daily Hormuz throughput under normal conditions, even a partial closure removing 12 million barrels per day would produce exactly this scale of cumulative supply removal across a 50-day window.
The comparison to Saudi Arabia's export capacity is instructive. At roughly 7 to 8 million barrels per day of normal export volumes, the total supply removed from markets over 50 days of partial blockade is equivalent to eliminating Saudi Arabian export flows entirely for approximately two months. The difference is that Saudi Arabia's absence would be gradual and partially anticipated; the Hormuz blockade, however, imposed this shock abruptly and without market preparation time.
U.S. Inventory and Export Data: A Structural Shift in Plain Sight
The EIA's release covering the week ending 24 April 2026 revealed a set of data points that would have seemed implausible just three years prior. (U.S. Energy Information Administration, reported by Argus Media, 29 April 2026)
| Metric | Week of 24 Apr | Week of 17 Apr | Year-on-Year Change |
|---|---|---|---|
| Commercial crude stocks (excl. SPR) | 459.5 mn bl | 465.7 mn bl | +19.1 mn bl |
| Cushing hub inventory | 29.8 mn bl | 30.6 mn bl | +4.1 mn bl |
| Crude exports | 6.44 mn b/d | 4.80 mn b/d | +56.2% |
| Crude imports | 5.75 mn b/d | 6.08 mn b/d | +4.6% |
| Refinery utilisation | 89.6% | 89.1% | +1.1 percentage points |
| U.S. production | 13.6 mn b/d | 13.6 mn b/d | +0.9% |
For the first time in EIA data history extending back to 2001, U.S. crude exports exceeded imports in a single week, with crude exports reaching a record 6.44 million barrels per day, surpassing the previous all-time weekly high of 5.63 mn b/d set in February 2023. Net imports turned negative at -688,000 barrels per day. (U.S. Energy Information Administration, reported by Argus Media, 29 April 2026)
This inversion reflects the convergence of two forces: elevated international crude prices pulling U.S. barrels into export markets at premium economics, and domestic production holding firm at 13.6 mn b/d. The United States has consequently functioned as a net crude exporter on a weekly basis, a structural milestone that partially decouples domestic supply from Hormuz vulnerability but does not shield American consumers from global benchmark pricing.
The Strategic Petroleum Reserve absorbed significant policy attention during this period. A drawdown of 7.1 million barrels in the week ending 24 April reduced SPR holdings to 397.9 million barrels, with the withdrawal rate of 1.02 million barrels per day ranking among the six most aggressive weekly SPR release rates ever recorded, comparable only to the emergency drawdown period of mid-2022. (EIA, reported by Argus Media, 29 April 2026)
The SPR is a price-dampening bridge, not a structural replacement for Hormuz throughput. At current drawdown rates, the reserve cannot substitute for sustained physical supply indefinitely.
Four Variables Driving Crude Price Volatility
The Hormuz blockade oil prices dynamic is not driven by a single variable but by four interlocking pressure points operating simultaneously.
1. Blockade Duration Uncertainty
On 28 April 2026, the White House confirmed that senior U.S. officials, including Treasury Secretary Scott Bessent, Vice President JD Vance, and White House Chief of Staff Susie Wiles, met with energy industry executives to assess scenarios in which the Hormuz blockade persists for months. (Argus Media, 30 April 2026) The administration described the meeting as focused on steps to minimise the impact on American consumers if the closure continued for an extended period.
Markets do not price a supply shock against a fixed known duration. They price the distribution of possible duration outcomes weighted by probability. As long as that distribution has a meaningful tail extending to multi-month closure scenarios, crude futures will embed a structurally elevated risk premium. Confirmation from the White House that months-long scenarios are being actively planned for shifts that distribution materially to the right.
2. U.S.-Iran Negotiation Breakdown Risk
Iran has publicly conditioned any agreement on the cessation of U.S. naval operations near Iranian territorial waters, a precondition the U.S. administration has shown no indication of accepting. Compounding this impasse, a report from Axios on 30 April indicated that U.S. Central Command was preparing to brief President Trump on new military options against Iran, a development that markets interpreted as escalation risk rather than diplomatic progress. (Argus Media, "Crude Futures Surge 7pc to New Four-Year High," 30 April 2026)
Each failed negotiating round functionally extends the market's expected duration of supply disruption, reinforcing the elevated risk premium in deferred futures contracts. The broader trade war oil impacts framework also continues to weigh on global demand expectations, adding a further layer of complexity to price discovery.
3. Strategic Petroleum Reserve Depletion Trajectory
The SPR's current trajectory places it on a path toward inventory levels that would constrain future emergency release capacity. At 397.9 million barrels and drawing down at over one million barrels per day, the reserve is approaching levels that would limit policymakers' flexibility if the blockade extends beyond the current planning horizon. Historical precedent from the 2022 emergency drawdown period illustrates both the tool's effectiveness as a short-term price dampener and its structural limitations when supply disruptions prove durable.
4. OPEC+ Institutional Fragmentation
The UAE's announcement that it would withdraw from both OPEC and the broader OPEC+ alliance effective 1 May 2026 added a compounding layer of institutional uncertainty to an already stressed supply environment. (Argus Media, "OPEC+ Members Back Group After UAE Exit: Update," 29 April 2026) In this context, OPEC's market influence is being tested at precisely the moment when coordinated output management matters most.
Algeria, Russia, and Kazakhstan each moved to reaffirm their OPEC+ commitments following the UAE's departure. Kremlin spokesman Dmitry Peskov stated that Moscow continues to view OPEC+ as an effective mechanism for balancing global energy markets and expressed a desire for the alliance to continue its work with partners. (TASS, as reported by Argus Media, 29 April 2026) Kazakhstan's energy ministry similarly confirmed no plans to alter its OPEC+ relationship, though the country's ongoing Tengiz field expansion creates structural production pressure above quota levels.
President Trump commented publicly on the UAE's departure, describing it as potentially positive for driving oil prices lower. (Argus Media, 29 April 2026) The strategic logic behind the UAE's move centres on maximising production autonomy at a moment when elevated prices create strong incentives to produce at capacity rather than within quota constraints. However, an OPEC output increase from remaining members could partially offset the UAE's departure from the alliance.
The simultaneous occurrence of a physical supply shock from the Hormuz blockade and an institutional supply management shock from OPEC+ fragmentation represents a compounding risk scenario with few modern parallels in energy market history.
Downstream Impact: Consumers, Refiners, and Emerging Markets
Retail Fuel Price Transmission
U.S. average retail gasoline prices reached a peak of $4.17 per gallon during the crisis period, before moderating slightly to approximately $4.08 to $4.10 per gallon as SPR releases and stable domestic production partially offset the crude shock. The typical lag between crude price movements and retail pump prices runs between two and six weeks, meaning the full consumer transmission of the $126.41/bl Brent peak has not yet fully materialised at the retail level.
Refinery throughput remained broadly stable at 16.3 million barrels per day nationally during the week ending 24 April, with utilisation rates at 89.6%, suggesting domestic refining operations have not yet encountered meaningful feedstock constraints. (EIA, reported by Argus Media, 29 April 2026) However, refineries configured for medium-sour Gulf crude grades face potential substitution challenges if the blockade persists, as alternative crude sources from West Africa and the North Sea carry different API gravity profiles, sulfur content specifications, and logistics cost structures.
Emerging Market Vulnerability
The Hormuz blockade oil prices crisis is being felt most acutely in import-dependent economies with limited foreign exchange reserves. Pakistan's oil import expenditure has surged by approximately 167% since the onset of the conflict, illustrating how nations combining high crude import dependency with limited reserve buffers face compounding economic stress: higher import costs coincide with weakening local currencies against a strengthening U.S. dollar.
Nations across South and Southeast Asia that lack domestic crude production capacity and rely heavily on Gulf crude face this dual burden simultaneously. The oil price shock analysis from prior episodes confirms that import-dependent developing economies consistently bear disproportionate economic costs during sustained supply disruptions, making this not simply an energy market event but a macroeconomic stress test for a broad range of nations.
The next major ASX story will hit our subscribers first
Scenario Modelling: Three Pathways Forward
Scenario A: Negotiated Resolution Within 30 Days
A verified diplomatic breakthrough and confirmed resumption of safe Hormuz transit would likely trigger an immediate Brent price correction in the range of 10 to 15%. Historical precedent from the 2019 Gulf tanker incidents suggests full normalisation to pre-crisis price levels could occur within four to eight weeks of confirmed passage resumption. A realistic post-resolution Brent equilibrium might settle in the $88 to $96 per barrel range, retaining a residual geopolitical risk premium above pre-crisis levels.
Scenario B: Blockade Extends 3 to 6 Months
Sustained closure would progressively erode SPR buffer capacity, force demand destruction in price-sensitive economies, and likely push Brent into a consolidated range of $115 to $130 per barrel, with episodic spikes above $130 driven by escalation events. Global GDP growth forecasts would face material downward revision, with energy-importing emerging markets absorbing the most severe economic impact.
Scenario C: Military Escalation and Full Hormuz Closure
A comprehensive closure removing the full 17 to 21 million barrels per day of Hormuz throughput would represent the most severe oil supply shock in the modern era. Price modelling under this scenario points toward Brent testing $150 to $180 per barrel before demand destruction and coordinated IEA emergency reserve releases from member nations constrain further gains. This remains a tail risk rather than a base case, but the probability weighting of this scenario has increased materially given the current trajectory of U.S.-Iran relations and confirmed preparations of new military options.
Furthermore, Reuters reporting on the extended Iran blockade confirms that market participants are increasingly pricing multi-month closure scenarios as a meaningful component of the forward risk distribution.
Investors and market participants should note that scenario projections involve significant uncertainty and should not be treated as price forecasts or investment recommendations.
Frequently Asked Questions: Hormuz Blockade and Oil Prices
How Much Oil Flows Through the Strait of Hormuz Daily?
Under normal conditions, approximately 17 to 21 million barrels of crude oil and petroleum products transit the Strait of Hormuz each day, accounting for roughly one-fifth of global oil supply. This volume encompasses exports from Saudi Arabia, Iraq, the UAE, Kuwait, and Iran itself.
Why Did Brent Crude Spike Nearly 14% Across Two Trading Sessions?
The convergence of White House confirmation that months-long blockade scenarios were being actively planned for, reports of U.S. Central Command preparing new military options against Iran, and the mechanical pressure of the expiring June Brent contract created simultaneous fundamental and technical buying conditions that drove the two-session surge. (Argus Media, 30 April 2026)
Can the U.S. Strategic Petroleum Reserve Offset the Hormuz Supply Loss?
The SPR, currently at 397.9 million barrels, can release over one million barrels per day and serves as a meaningful short-term price dampener. However, it cannot indefinitely replace the 17 to 21 million barrels per day that normally transit Hormuz. It is a bridging mechanism with finite capacity, not a structural solution to a sustained physical supply gap.
What Does the UAE's OPEC Exit Mean for Oil Market Stability?
The UAE's departure from OPEC and OPEC+ reduces the group's collective spare production capacity and weakens its institutional ability to coordinate output responses when the Strait of Hormuz eventually reopens. It also signals that high-producing Gulf nations may increasingly prioritise production autonomy over cartel discipline, a dynamic that could accelerate OPEC+ fragmentation if elevated prices persist. (Argus Media, 29 April 2026)
How Long Until Oil Prices Normalise After a Blockade Resolution?
Market analysts estimate that full price normalisation following a confirmed Hormuz reopening could take three to six months, reflecting the time required to rebuild depleted commercial and strategic inventories, re-establish routine shipping logistics, and restore market confidence in sustained safe passage.
Key Takeaways
- Brent crude reached an intraday high of $126.41 per barrel on 30 April 2026, a nearly 14% gain across two sessions and a four-year price peak. (Argus Media, 30 April 2026)
- An estimated 600 million barrels of supply have been removed from global markets over the first 50 days of the blockade.
- U.S. crude exports hit a record 6.44 million barrels per day in the week ending 24 April, with net imports turning negative for the first time in EIA data history dating to 2001. (EIA, reported by Argus Media, 29 April 2026)
- The SPR is being drawn down at approximately 1.02 million barrels per day, one of the most aggressive emergency release rates ever recorded. (EIA, reported by Argus Media, 29 April 2026)
- The UAE's OPEC+ exit, effective 1 May 2026, compounds supply management uncertainty at precisely the moment when coordinated market stabilisation is most needed. (Argus Media, 29 April 2026)
- U.S. retail gasoline prices peaked at $4.17 per gallon, with further crude price transmission still working through the supply chain.
- Blockade duration remains the defining variable in determining whether this represents a temporary price shock or a permanent structural repricing of global energy risk under the Hormuz blockade oil prices dynamic.
This article is intended for informational purposes only and does not constitute financial or investment advice. Commodity price projections and scenario analyses involve material uncertainty and should not be relied upon as the basis for investment decisions. Readers are encouraged to consult independent financial and commodity market advisors before making any investment-related decisions.
Want to Stay Ahead of the Next Major Resource Discovery Triggered by Energy Market Shocks?
When geopolitical crises like the Hormuz blockade reshape commodity markets, significant mineral discoveries on the ASX can move fast — Discovery Alert's proprietary Discovery IQ model delivers real-time alerts the moment a major discovery is announced, ensuring subscribers are positioned ahead of the broader market. Explore historic examples of extraordinary discovery returns and begin your 14-day free trial today to secure your market-leading advantage.