July 13, 2026
When the Chokepoint Tightens: How Hormuz Controls the Global Fuel Equation
Few concepts in commodity markets are as misunderstood as the relationship between a geopolitical event and the physical supply chain that follows. Most market participants focus on the headline price move and assume the underlying system can absorb or respond to the shock through available levers. What the current Hormuz crisis reveals is that those levers are largely already pulled. The US refining system has almost no room to manoeuvre, crude imports were already trending well below prior-year levels before tensions escalated, and distillate inventories entered this period at a structural deficit. The result is a market in which Brent jumps on Hormuz tensions while refinery utilization limits any meaningful fuel supply response.
Understanding why requires stepping through each layer of the supply chain, from the strait itself to the refinery gate to the retail pump.
When big ASX news breaks, our subscribers know first
The Strait as a Price Mechanism, Not Just a Shipping Lane
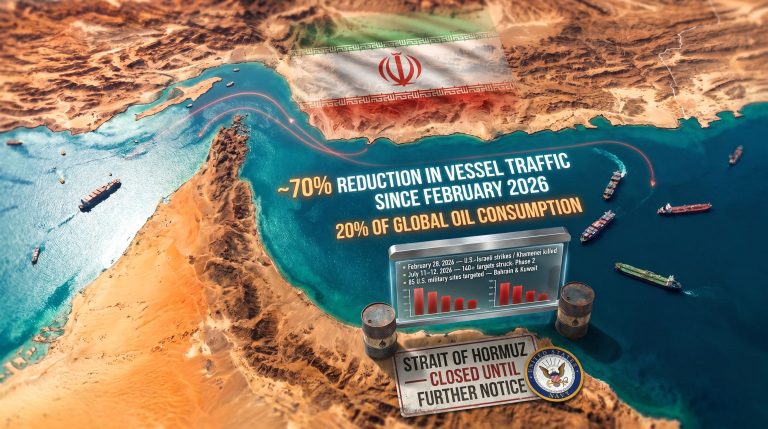
The Strait of Hormuz is roughly 33 kilometres wide at its narrowest navigable point, yet it functions as the world's single most consequential energy corridor. Approximately 20% of global oil and LNG supply transits this passage under normal operating conditions, with between 125 and 140 vessels moving through daily. That volume includes crude tankers, condensate carriers, and liquefied natural gas shipments bound primarily for Asian markets, with secondary flows directed toward European and North American refiners.
What makes Hormuz uniquely powerful as a price driver is not just its volume but its irreplaceability. There is no pipeline infrastructure capable of rerouting anywhere near the volumes that move through the strait. Saudi Arabia's East-West pipeline carries a fraction of the country's export capacity, and alternative maritime routes add weeks of transit time and significant freight cost. Any verified disruption to Hormuz transit is not simply a regional inconvenience — it is an immediate tightening of global crude availability. As explored in detail by Crux Investor's analysis of Hormuz shipping constraints, these elevated fuel costs have direct implications for mining operations worldwide.
"The Strait of Hormuz is not a chokepoint in the colloquial sense. It is a structural vulnerability baked into the global energy architecture that has no scalable alternative routing. When it is threatened, the risk premium is not speculative; it is a rational response to physical geography."
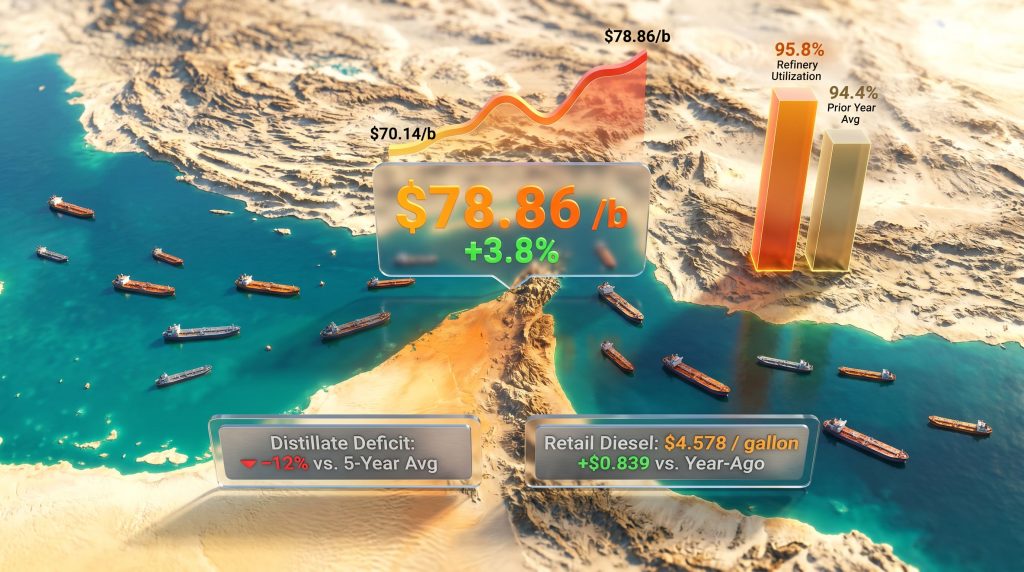
In the current episode, renewed US-Iran military strikes combined with Tehran's assertion of closure authority pushed Brent crude up 3.8% to $78.86 per barrel in a single session, while WTI advanced 4.11% to $74.36 per barrel. This erased the majority of the prior decline from Brent's recent low of $70.14 per barrel. This latest oil price rally reflects how quickly geopolitical shocks can reverse recent market losses.
The Verification Gap: Pricing Risk Before Confirmation
One of the least-discussed but most analytically significant features of the current crude rally is the gap between official statements and independently verified shipping data. US officials reported that approximately 20 vessels were escorted through the Strait of Hormuz within a 24-hour window. However, independent ship-tracking data did not confirm a corresponding volume of tanker movements through the strait during the same period.
This divergence has important implications for understanding the current price level. Markets are not pricing confirmed supply loss; they are pricing the probability of sustained disruption. In commodity market terminology, this is a geopolitical risk premium, and it functions through a forward-pricing mechanism: traders and refiners buy futures and physical cargoes ahead of expected scarcity rather than waiting for inventory data to confirm it.
The two-sided risk profile this creates is as follows:
-
Upside crude risk: If independent tracking data begins confirming a sustained and material reduction in tanker transit volumes, the market will interpret this as physical supply loss rather than speculative pricing, potentially accelerating Brent toward the $100 per barrel threshold.
-
Downside crude risk: If diplomatic channels produce even a partial agreement that restores vessel movement, the risk premium embedded in current prices could unwind sharply, pulling Brent back toward the $70 to $76 per barrel range.
A Jefferies economist noted that political incentives around the US midterm election cycle create structural pressure toward a negotiated resolution, suggesting market participants may be pricing a worst-case scenario that diplomatic timelines could prevent. Even so, analysts are careful to note that a diplomatic patch restoring crude flows would not immediately resolve the downstream fuel supply constraints that have developed independently of the geopolitical episode.
Why 95.8% Refinery Utilization Changes the Entire Calculus
The feature of this supply shock that separates it from most prior Hormuz disruption cycles is the state of US refinery capacity. American refineries are currently processing 17.0 million barrels per day at 95.8% of operable capacity, a figure that sits meaningfully above the four-week rolling average of 94.4% recorded during the comparable period in 2025.
Operating at this level means the system is functioning at near-maximum throughput. In practical terms, this eliminates the buffer that ordinarily allows refinery operators to respond to either crude price spikes or fuel demand surges by simply running harder.
What Near-Maximum Utilisation Means in Practice
When a refinery system operates at or above 95% utilisation, several structural constraints activate simultaneously:
-
Volume expansion is off the table. Refiners cannot process meaningfully more crude even if additional barrels become available through emergency reserve releases or alternative routing.
-
Fuel output is effectively capped. Additional crude supply does not translate into additional diesel, gasoline, or jet fuel at any scale that moves the market.
-
Refining margins come under severe compression. Rising feedstock costs cannot be offset through volume because volume cannot increase. The margin squeeze falls directly to the bottom line.
-
Inventory buffers erode faster. With no ability to build product stocks, any demand spike or import shortfall immediately translates into tighter product availability at the wholesale and retail level.
"The 95.8% utilisation rate reframes the Hormuz disruption entirely. What begins as a crude supply problem becomes a structural fuel supply problem the moment you recognise that additional crude barrels have nowhere useful to go at current refinery throughput."
This distinction matters for market participants: higher crude prices at current utilisation rates will compress margins and raise pump prices, but they cannot incentivise increased fuel production because the physical processing ceiling has already been reached. Furthermore, the trade war impact on oil markets has compounded these pre-existing structural pressures throughout 2025.
Distillate Inventories: The Pre-Existing Deficit
Before the current geopolitical escalation, US fuel markets were already carrying a significant structural weakness. The most recent EIA Weekly Petroleum Status Report shows distillate fuel inventories sitting 12% below the five-year seasonal average, having declined by 5.0 million barrels in the most recent reporting week.
| Metric | Current Reading | Benchmark |
|---|---|---|
| Distillate inventory change | -5.0 million barrels | Week-on-week |
| Distillate vs. 5-year average | -12% below seasonal norm | Structural deficit |
| Crude imports (4-week average) | 5.4 million barrels/day | -11.4% vs. prior year |
| Refinery utilization | 95.8% | Above 2025 comparable average of 94.4% |
| Distillate fuel production | 5.2 million barrels/day | Near-capacity output |
The crude import figure deserves specific attention. With US crude imports already running 11.4% below the same period in 2025 on a four-week average basis, the refining system was drawing down its feedstock buffer before the Hormuz disruption even began. Any prolonged reduction in tanker traffic through the strait would accelerate that drawdown, not initiate it.
This pre-existing deficit is the reason the refinery capacity ceiling is so consequential. The system does not have the inventory cushion that would allow it to weather a sustained crude supply reduction while maintaining stable product output. Both the supply side and the buffer are constrained simultaneously.
Diesel Prices and the Transmission Lag to Energy-Intensive Industries
Crude price movements transmit to retail fuel prices with a lag that typically spans several weeks, meaning the full effect of the current Brent rally had not yet reached pump prices at the time of the most recent data. The national average retail diesel price stood at $4.578 per gallon, representing a week-on-week decline of $0.090 per gallon that reflected pre-rally crude pricing. However, the year-over-year comparison tells a more concerning story: retail diesel was already $0.839 per gallon above year-ago levels before the Hormuz premium was added.
For energy-intensive industries, particularly mining operations, the implications of sustained diesel price increases at these levels are material:
-
Open-cut mining operations run large diesel-powered haul fleets where fuel represents a significant proportion of total operating cost. A sustained increase of $0.50 to $1.00 per gallon can visibly erode site-level margins on operations with thin cost buffers.
-
Remote and off-grid operations face compounded exposure because diesel typically serves as the primary energy source for both processing equipment and camp facilities, with no grid alternative available.
-
Development-stage projects may need to revise economic models if diesel cost assumptions embedded in feasibility studies are materially exceeded over an extended period.
Scenario analysis suggests that if Brent sustains its current trajectory and the historical crude-to-retail transmission ratio holds, national average diesel could approach $5.00 to $5.20 per gallon in coming weeks. This is not a confirmed forecast; it is a scenario dependent on crude prices remaining elevated and no meaningful demand destruction occurring at the wholesale level. The Wall Street Journal's coverage of Middle East supply disruptions provides additional context on how these tensions are reverberating through global energy markets.
Disclaimer: Price scenario projections are based on historical transmission patterns and do not constitute financial advice. Actual outcomes will depend on geopolitical developments, refinery operational decisions, and demand-side responses that cannot be predicted with certainty.
The next major ASX story will hit our subscribers first
Cross-Asset Implications: What the Broader Market Reaction Reveals
The Hormuz escalation has not produced a uniform lift across risk assets or commodities. Instead, it has triggered a complex repricing that illustrates how rising oil prices interact with the current interest rate environment.
| Asset | Direction | Primary Driver |
|---|---|---|
| Brent Crude | +3.8% to $78.86/b | Geopolitical supply risk premium |
| WTI Crude | +4.11% to $74.36/b | Correlated US benchmark movement |
| Gold | -1.5% to approx. $4,060/oz | Rising yields increase opportunity cost |
| 2-Year Treasury Yield | Rose to 4.2393% | Highest since February 2025 |
| Global Equities | Declined | Risk-off sentiment; margin concerns |
The gold decline is particularly instructive for commodity investors. Despite a geopolitical backdrop that would historically be expected to support safe-haven demand for bullion, gold fell because rising bond yields increased the opportunity cost of holding non-yielding assets. Understanding these gold safe-haven dynamics is essential for investors trying to navigate this complex environment, and the broader picture of gold and bond volatility further illustrates how interlinked these asset classes have become.
Fed funds futures are currently pricing approximately 39 basis points of additional monetary tightening by year-end, with Fed Chair Kevin Warsh's first congressional testimony approaching. A higher-for-longer rate environment creates two specific headwinds for resource sector participants:
-
Higher discount rates compress the net present value of long-duration mining and energy development projects, making capital-intensive assets less attractive on a risk-adjusted basis.
-
A stronger US dollar, typically associated with tightening cycles, exerts downward pressure on USD-denominated commodity prices, partially offsetting the geopolitical premium embedded in crude.
The upcoming June CPI release adds another layer of complexity. A headline reading near 4.2% would reflect the lagged effect of lower pre-rally gasoline prices, creating a temporary appearance of improving inflation before the current crude surge transmits through to pump prices in subsequent months. Any market optimism triggered by a softer CPI print may therefore prove short-lived if oil prices remain elevated through the third quarter of 2026.
The Two Indicators That Will Resolve the Uncertainty
The current market uncertainty will not be resolved by political statements or official assessments alone. Two empirical data streams will provide the clearest forward signal on whether supply constraints are deepening or beginning to ease.
1. Independent Tanker Traffic Through the Strait of Hormuz
The baseline is 125 to 140 vessel transits per day. Current tracking data shows transit activity well below that level, though a full halt has not been independently confirmed. The direction of this data series over the next two to three weeks will determine whether the current crude price level is sustainable or whether it represents an overshoot of the actual physical disruption.
-
If transit counts remain materially below baseline: the risk premium is justified and may expand further.
-
If transit counts recover toward baseline: the risk premium will begin to unwind and Brent could retrace meaningfully toward its recent low.
2. EIA Weekly Petroleum Status Report: Utilisation and Distillate Stocks
Whether refinery utilisation remains near 95.8% and whether the 12% distillate deficit narrows or deepens are the two most direct measurements of whether fuel supply constraints are improving. A decline in utilisation would signal either demand destruction or scheduled maintenance; neither would be unambiguously positive for the economy. A narrowing distillate deficit without a corresponding increase in imports would suggest demand is softening, which carries its own implications for economic activity. In addition, OPEC's market influence over production decisions remains a key wildcard that could either amplify or temper these dynamics in the months ahead.
"The most reliable forward indicators for whether oil prices will ease from current levels are: independent tanker traffic data through the Strait of Hormuz measured against the 125 to 140 vessel baseline, and the EIA's weekly distillate inventory figures relative to the five-year seasonal average. A recovery in both would signal that the current geopolitical risk premium is beginning to unwind."
Frequently Asked Questions
Why did Brent crude rise nearly 4% in a single session?
The combination of renewed US-Iran military strikes and Tehran's assertion of Hormuz closure authority caused markets to price a sustained disruption to a corridor responsible for approximately 20% of global oil supply. The rally occurred ahead of full verification from independent ship-tracking data.
Why can't US refineries produce more fuel to compensate?
US refineries are already operating at 95.8% of operable capacity. There is virtually no spare processing headroom available to increase fuel output, regardless of how much additional crude supply might theoretically become available.
How far below normal are distillate inventories?
As of the most recent EIA data, distillate fuel inventories are approximately 12% below the five-year seasonal average, having declined by 5.0 million barrels in the most recent reporting week.
Would a diplomatic resolution quickly normalise fuel prices?
Restoring tanker traffic would remove a portion of the current crude risk premium, potentially pulling Brent back toward $70.14 per barrel. However, the 95.8% refinery utilisation ceiling and the pre-existing 12% distillate deficit would continue to constrain fuel supply recovery independently of any diplomatic outcome.
What is the worst-case price scenario analysts are modelling?
A prolonged and fully confirmed closure of the Strait of Hormuz with no emergency routing or strategic reserve intervention could push Brent toward $100 to $140 per barrel, depending on the duration and completeness of the disruption. This remains a tail-risk scenario rather than a base case.
Summary: The Structural Constraint Outlasts the Headline
| Metric | Value | Significance |
|---|---|---|
| Brent crude price | $78.86/b (+3.8%) | Full geopolitical risk premium reflected |
| WTI crude price | $74.36/b (+4.11%) | Tracking Brent closely |
| Refinery utilization | 95.8% | Near-maximum; no output expansion possible |
| Distillate inventory deficit | -12% vs. 5-year average | Pre-existing vulnerability |
| Crude import deficit | -11.4% vs. prior year | Reduced feedstock buffer |
| Retail diesel (national avg.) | $4.578/gallon | $0.839 above year-ago; positioned to rise |
| Normal Hormuz transit volume | 125-140 vessels/day | Current traffic materially below this level |
| Worst-case price scenario | $100-$140/b | Full prolonged closure with no resolution |
The central conclusion is that even if geopolitical tensions ease and tanker traffic recovers, the structural constraints embedded in the US refining system will not resolve at the same speed. Near-maximum utilisation, a pre-existing distillate deficit, and below-trend crude imports mean that fuel supply recovery will lag any crude price normalisation. Consequently, while the Brent jumps on Hormuz tensions headline may ease as diplomatic efforts progress, the downstream tightness will take considerably longer to unwind.
This article is for informational purposes only and does not constitute financial or investment advice. Forward-looking statements and price scenarios involve assumptions and uncertainties that may not materialise. Readers should conduct independent research before making investment decisions. Further petroleum data and historical supply analysis are available through the U.S. Energy Information Administration at eia.gov and through Crux Investor's Oil & Gas coverage at cruxinvestor.com.
Want to Know Which ASX Mining Companies Face the Greatest Exposure to Rising Fuel Costs?
Discovery Alert's proprietary Discovery IQ model scans ASX announcements in real time, instantly identifying mineral discoveries and investment opportunities across the energy and resources sector — including companies whose operations may be materially affected by sustained diesel price increases. Explore historic examples of major ASX mineral discoveries and their market returns, then begin your 14-day free trial to position yourself ahead of the next significant market move.