July 10, 2026
The World's Most Fragile Energy Corridor: Inside the Hormuz Shipping Crisis
Every few decades, a single geographic bottleneck reminds the world just how brittle the architecture of global energy supply truly is. The Suez Crisis of 1956 exposed Europe's dependence on a single canal. The 1973 Arab Oil Embargo revealed how rapidly political decisions could sever commodity flows. Today, Strait of Hormuz tanker traffic attacks are delivering their own version of that lesson, and the numbers coming out of vessel tracking systems are unlike anything recorded in the modern era of maritime energy trade.
Understanding what is happening in the strait requires looking beyond the individual incidents and grasping the systemic logic of chokepoint dependency, war risk insurance mechanics, and the self-reinforcing dynamics that transform a security event into a structural market shock.
When big ASX news breaks, our subscribers know first
Why the Strait of Hormuz Cannot Be Replaced
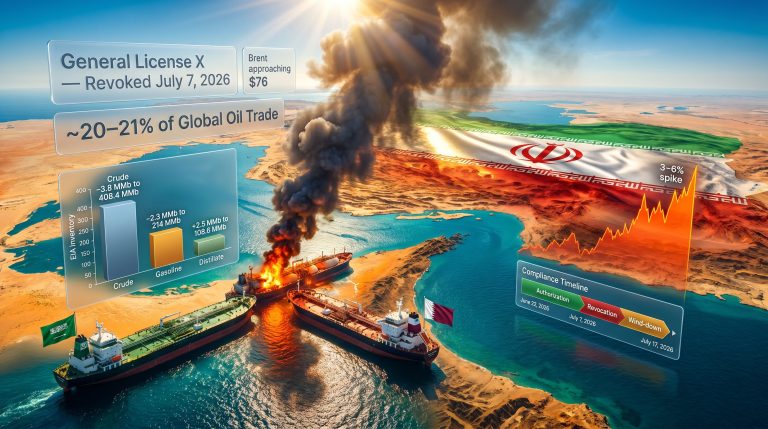
The strait itself is deceptively modest in physical terms. At its narrowest navigable point, vessels transit through a corridor roughly 33 kilometres wide, with usable shipping lanes far narrower still once shallow water exclusion zones are factored in. Yet through this constricted passage, approximately one-fifth of all globally traded oil supplies flowed daily before the current conflict began in February 2026, following U.S. and Israeli strikes on Iran.
The pre-conflict operational baseline was between 125 and 140 tanker transits per day, a figure that represents decades of infrastructure investment, diplomatic arrangements, and maritime coordination across multiple sovereign jurisdictions. No alternative route can replicate this throughput at comparable cost or logistical scale within any operationally meaningful timeframe.
To appreciate why Hormuz carries such disproportionate strategic weight, comparing it against other critical maritime chokepoints clarifies the picture:
| Chokepoint | Approximate Daily Oil Share | Bypass Feasibility | Strategic Risk Rating |
|---|---|---|---|
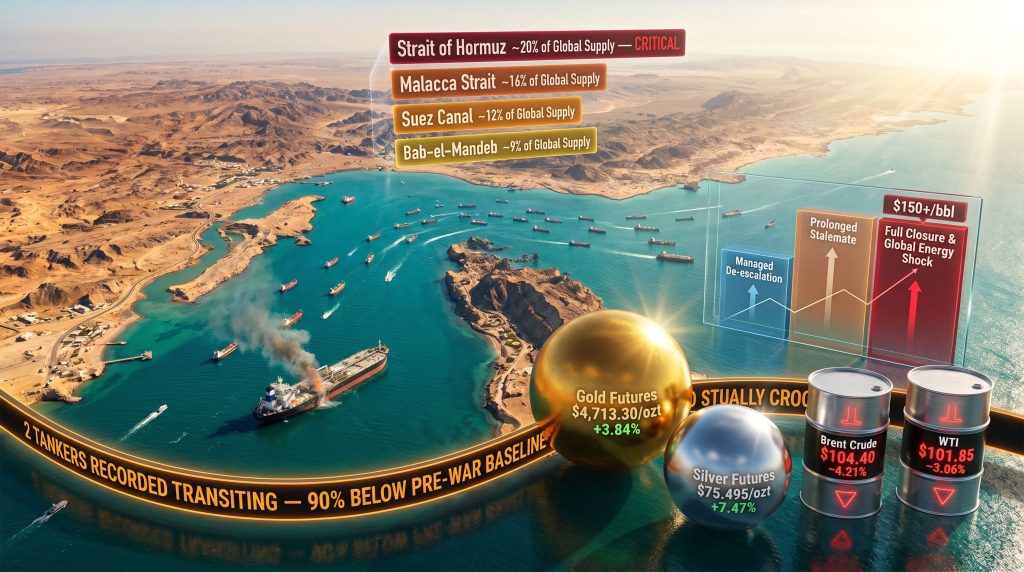
| Strait of Hormuz | ~20% of global supply | Very Low | Critical |
| Strait of Malacca | ~15% of global supply | Low | High |
| Suez Canal | ~12% of global supply | Moderate | High |
| Bab-el-Mandeb | ~9% of global supply | Moderate | Elevated |
The East-West Pipeline across Saudi Arabia can divert some crude volumes around the strait, but its capacity is insufficient to compensate for a full or near-full closure. Qatar, the world's leading LNG exporter, has no overland alternative whatsoever. Its entire export infrastructure feeds directly into Hormuz-dependent sea lanes.
A Traffic Collapse Measured in Real Numbers
The escalation timeline is critical context for understanding the current situation. Three weeks of fragile truce following the initial conflict outbreak had allowed partial traffic recovery, with daily transits averaging around 40 vessels. That figure was already 71% below the pre-conflict baseline, but it represented a functioning, if damaged, corridor.
The weekend before the most recent escalation saw approximately 108 verified crossings, the highest post-conflict figure recorded and a moment that appeared to signal genuine reopening momentum. That momentum, however, evaporated rapidly.
Following IRGC missile strikes on three commercial vessels, including the Marshall Islands-flagged Qatari LNG tanker Al Rekayyat, the voluntary withdrawal of risk-averse operators began almost immediately. The trajectory of collapse was steep:
- Wednesday: 13 tankers transited the strait, representing a decline of more than 60% from the recent 33-to-40-per-day average
- Thursday early hours: just 2 tankers recorded crossing, a near-total operational shutdown
- Estimated current deficit: approximately 90% below pre-conflict daily transit norms
Key Insight: When commercial operators voluntarily halt transits without any formal closure order from a sovereign authority, their collective risk assessment communicates something that no diplomatic statement can replicate. The data coming from vessel tracking systems tells a more honest story than any official communique from Washington or Tehran.
Jorge Leon, head of geopolitical analysis at Rystad Energy, captured this dynamic in a published report, describing the effective halt in tanker traffic as a more revealing indicator of current risk perception than any political statement from either side of the conflict.
The AIS Data Problem: When Ships Go Dark
A complicating factor in assessing the true scale of the disruption is the growing prevalence of vessels disabling their Automatic Identification System (AIS) transponders. These systems broadcast a vessel's position, identity, and heading publicly, allowing port authorities, insurers, and tracking services to monitor maritime traffic in real time.
Operators are increasingly switching off AIS signals to reduce their targeting exposure, creating what the industry calls "dark ships." This practice introduces a meaningful data gap:
- Standard tracking databases lose visibility of AIS-dark vessels entirely
- Analysts must rely on satellite synthetic aperture radar (SAR) and alternative intelligence feeds, which carry lower temporal resolution and higher uncertainty
- Insurance underwriters lose the continuous position data they use to price war risk exposure and assess claims
- The verified transit counts being reported may understate actual risk-driven avoidance behaviour, because vessels that have already gone dark are not being counted in the near-zero crossing figures
This data blind spot means the operational situation in the strait could be simultaneously better and worse than the headline numbers suggest, a deeply uncomfortable position for anyone pricing maritime risk.
How Marine War Insurance Becomes the Real Shutdown Mechanism
One of the least understood dynamics of maritime chokepoint crises is that physical military threat alone rarely halts commercial shipping. The true operational lever is the marine war risk insurance market, and understanding how it functions explains why tanker traffic can collapse without a single mine being laid or a formal closure being declared.
Standard marine hull and cargo policies exclude war-related losses entirely. Operators must purchase separate war risk coverage through specialist underwriters, many of them participating in the Lloyd's of London market. These policies typically carry seven-day cancellation clauses in designated high-risk zones, meaning underwriters can withdraw coverage with minimal notice if conditions deteriorate.
When war underwriters advise voyage pauses, as multiple sources confirmed they did following the latest vessel strikes, the practical effect is that operators lose the insurance backstop required for commercial transit decisions. Without coverage:
- Charterers face uncovered cargo loss exposure running into hundreds of millions of dollars per vessel
- Shipowners carry uninsured hull liability for vessels worth $100 million to $300 million or more
- Banks financing vessels under mortgage arrangements may enforce loan covenants requiring coverage continuity
- Port state authorities at destination ports may refuse uninsured vessels entry under liability frameworks
A senior marine war underwriter, speaking anonymously to Reuters due to the sensitivity of the situation, indicated that the market is now confronting the realistic prospect of severe losses involving vessels of very high commercial value. This framing from within the insurance industry signals that the risk transfer architecture underpinning Gulf shipping is under genuine structural stress.
The Al Rekayyat incident illustrates the exposure profile. Struck by a projectile late on a Tuesday, the vessel sustained an engine room fire, lost propulsion, and remains stranded awaiting salvage operations off the coast of Oman. While industry sources assessed explosion risk from its LNG cargo as low and reported no injuries or environmental impacts through the Marshall Islands ship registry, the vessel represents a major war risk claim in progress and a case study that will inform underwriting decisions across the entire Gulf war risk pool.
The Competing Strategic Interests Shaping the Strait
Iran's Position: Control or Coercion?
Tehran's Revolutionary Guards Navy issued a statement framing U.S. naval activity as interference with a gradual reopening process and warning that further intervention would provoke a severe response. Simultaneously, Iranian authorities have been pressing vessel operators to use a northern routing option under Iranian maritime supervision rather than the southern U.S. Navy-protected transit lanes.
This creates a binary choice structure for shipowners that goes well beyond navigational preference. Using the Iranian-supervised northern route implies a degree of compliance with Tehran's authority over the strait that Western operators, charterers, and their governments find deeply problematic. Using the southern route requires transiting waters where IRGC attack capability has already been demonstrated against named commercial targets.
Neither option is commercially or politically neutral, and the resulting paralysis is precisely what the transit data reflects.
The Gulf State Exposure
The three vessels targeted in the latest escalation were not random targets. They included a Qatari LNG tanker, a Saudi crude oil tanker, and a vessel with connections to UAE loading operations near Sharjah. The targeting pattern suggests a deliberate effort to impose costs on Gulf Cooperation Council states, forcing them to calculate the price of alignment with U.S. strategic objectives.
For Qatar specifically, whose entire LNG export model depends on Hormuz access, the Al Rekayyat strike is more than an insurance event. It is a direct challenge to the commercial viability of a national energy strategy built around a resource that cannot be rerouted overland.
How Commodity Markets Are Processing the Shock
The market response to the Hormuz crisis has been counterintuitive in several respects, and the divergences between asset classes reveal as much about investor psychology as they do about supply fundamentals.
Crude oil prices have fallen despite a supply shock. Brent Crude is trading at $104.40/bbl (-4.21%) and WTI at $101.85/bbl (-3.06%). Notably, crude oil price trends like this apparent paradox reflect several competing forces:
- Demand destruction fears are weighing on forward price expectations as a potential global recession enters investor calculus
- Signals of possible International Energy Agency (IEA) coordinated strategic petroleum reserve releases are creating a price cap effect
- Speculation about near-term diplomatic resolution is keeping risk premia from fully pricing in a prolonged closure
Furthermore, the broader oil market disruption feeding into these price movements is compounding existing macroeconomic anxieties around trade fragmentation and global demand forecasts.
Precious metals have surged emphatically, with Gold Futures reaching $4,713.30/ozt (+3.84%) and Silver Futures at $75.495/ozt (+7.47%). Platinum has risen 4.22% and Palladium 5.39%. This divergence from oil behaviour signals that capital is rotating toward monetary hedges rather than expressing a confident view on energy supply disruption. The surge in gold safe-haven demand reflects investor confusion rather than a clear consensus on outcomes when oil falls and gold surges simultaneously during a geopolitical crisis.
In addition, safe-haven gold flows have accelerated notably as institutional investors rotate away from risk assets amid deepening uncertainty over the strait's operational future.
Industrial metals are caught between two forces. Copper at $5.6358/lb (+2.72%) is being supported by supply chain anxiety but faces demand headwinds if the crisis tips major economies toward contraction. Aluminium Futures at $3,314.25/ton (-1.21%) are weaker, reflecting the energy-intensive nature of smelting operations and investor concern that higher energy costs will compress margins faster than supply tightness can support prices.
The Mining Cost Transmission Nobody Is Talking About
A dimension of the Hormuz crisis that receives insufficient analytical attention is its direct transmission into global mining cost pressures across multiple operational categories. Oil is not merely an energy market variable for mining companies — it is a core input cost embedded across:
- Diesel fuel for haul trucks, drills, and processing facilities
- Ammonium nitrate and fuel oil (ANFO) explosives, whose pricing correlates tightly with petroleum feedstock costs
- Freight rates for equipment and consumable imports to remote mine sites
- Reagent chemicals derived from petrochemical supply chains
Analysis from BMO Capital Markets indicates that sustained oil prices above $100 per barrel historically correlate with operating cost increases of 8% to 15% for open-cut mining operations. The following scenario table maps the potential cost escalation across three disruption pathways:
| Oil Price Scenario | Brent Crude Range | Estimated Mining Cost Increase | Key Affected Inputs |
|---|---|---|---|
| Moderate Disruption | $90-$105/bbl | 5-8% | Diesel, freight, reagents |
| Severe Disruption | $105-$130/bbl | 8-15% | All energy-linked inputs |
| Full Chokepoint Closure | $130-$160+/bbl | 15-25%+ | Entire operational cost base |
For projects at the margin of economic viability, a 10% to 15% cost escalation can shift internal rate of return calculations dramatically, triggering investment deferrals or feasibility review requirements under joint venture agreements.
The next major ASX story will hit our subscribers first
Three Scenarios for What Happens Next
Scenario 1: Managed De-escalation (Base Case)
Diplomatic back-channel engagement produces partial Iranian concessions on the northern route dispute. War underwriters cautiously restore coverage over a 60-to-90-day window. Traffic recovers to 40-plus daily transits within four to eight weeks. Brent Crude retreats toward the $85 to $95 range as the acute risk premium deflates.
Scenario 2: Prolonged Stalemate (Elevated Risk)
Neither party yields on the sovereignty question over transit lane control. AIS-dark shipping becomes an accepted operational norm. Traffic stabilises at 10 to 20 daily transits, representing a permanent partial closure. Qatar accelerates LNG supply chain restructuring toward Pacific routes. Energy cost inflation becomes embedded in global industrial structures for 12 to 18 months.
Scenario 3: Full Closure and Global Energy Shock (Tail Risk)
A direct naval engagement or destruction of critical strait infrastructure collapses traffic to near-zero for an extended period. IEA member states activate coordinated strategic petroleum reserve drawdowns. Oil breaches $150 per barrel. Global recession risk rises materially. Mining sector project deferrals, cost blowouts, and force majeure declarations propagate across Gulf-adjacent supply chains.
Frequently Asked Questions
How much of global oil passed through Hormuz before the conflict?
Approximately 20% of all globally traded oil supplies transited the strait daily under pre-conflict conditions, representing one of the highest single-point concentration risks in the global energy system.
Why did tanker traffic collapse so quickly after the latest attacks?
The combination of physical targeting risk and simultaneous withdrawal of war risk insurance coverage creates a self-reinforcing shutdown dynamic. Neither element alone would necessarily halt traffic, but together they remove both the physical safety margin and the financial backstop that commercial transit decisions require.
What does it mean when vessels disable their AIS transponders?
AIS transponders broadcast vessel identity and location publicly. Operators disabling these systems to reduce targeting risk become invisible to standard tracking databases. Analysts must then rely on satellite radar imagery and alternative intelligence sources, which provide lower confidence data and slower update frequencies than live AIS feeds.
How does a Hormuz disruption affect countries that do not import Gulf oil directly?
Energy markets are globally priced on benchmark indices like Brent Crude. A supply shock in the Gulf raises those benchmarks universally regardless of the geographic origin of any individual buyer's imports. LNG price spikes similarly affect European and Asian consumers who source supply elsewhere, because the global LNG market prices off a unified set of reference contracts.
The Structural Lesson That Outlasts Any Single Crisis
Whatever resolution pathway the current Hormuz crisis follows, the systemic vulnerability it has exposed will not disappear when the shooting stops. The nations carrying the highest structural exposure to a prolonged closure — specifically Japan, South Korea, India, and China — have spent decades building energy import infrastructure predicated on uninterrupted Hormuz access. Redirecting that dependency requires investment cycles measured in decades, not quarters.
The shipping industry faces its own version of this reckoning. The economics of Cape of Good Hope alternative routing add approximately 3,500 nautical miles to a voyage from the Gulf to European markets, translating into higher freight costs, longer transit times, and greater fleet utilisation pressure. These are manageable in a short disruption but structurally damaging if the strait becomes an unreliable corridor over a multi-year horizon.
The Strait of Hormuz tanker traffic attacks of July 2026 will not be the last time this 33-kilometre passage determines the direction of global energy markets. The deeper lesson is that the world's dependence on it has never been adequately priced into strategic planning, and that mispricing is now being corrected, expensively, in real time.
This article reflects publicly available data and analysis as of the reporting date. Commodity prices, transit figures, and geopolitical assessments are subject to rapid change. Nothing in this article constitutes financial or investment advice. Forward-looking scenarios involve inherent uncertainty and should not be interpreted as predictions of specific outcomes.
Want to Track How Geopolitical Shocks Like the Hormuz Crisis Translate Into ASX Mineral Discovery Opportunities?
Discovery Alert's proprietary Discovery IQ model delivers real-time alerts on significant ASX mineral discoveries, instantly converting complex market signals — including commodity price surges driven by geopolitical disruption — into actionable investment insights for both short-term traders and long-term investors. Explore historic examples of major discoveries and their market returns, then begin your 14-day free trial at Discovery Alert to position yourself ahead of the market.