August 13, 2026
When Energy Chokepoints Collide With Geopolitical Deadlock
The Hormuz stalemate raises risk of $120 oil not as a headline-grabbing forecast, but as a logical consequence of five months of compounding supply failure meeting a world that has already exhausted its primary buffers. Every generation or so, global energy markets are forced to confront a structural reality that financial models and diplomatic optimism have spent years ignoring: the physical infrastructure of oil delivery is irreplaceable, and when it fails, no amount of reserve releases or rhetorical maneuvering can fully compensate.
Understanding why this moment is different from previous Hormuz scares requires going beyond the diplomatic theatre and examining the underlying mechanics of where oil actually comes from, how it moves, and what happens when that movement is interrupted for longer than the market's stress-testing models anticipate. The current oil market overview makes this context especially critical.
When big ASX news breaks, our subscribers know first
The Geography of Vulnerability: Why Hormuz Has No Substitute
The Strait of Hormuz is a narrow maritime corridor separating Iran to the north from Oman and the United Arab Emirates to the south. At its narrowest navigable point, the usable shipping lane measures roughly two miles in each direction, channelling an extraordinary concentration of global energy through an impossibly thin geographic needle.
Under normal operating conditions, approximately 17 to 21 million barrels per day of crude oil, condensate, and refined products transit this passage, representing close to 20% of total global oil supply. The waterway serves as the primary export route for Saudi Arabia, Iraq, Kuwait, the UAE, Qatar, and Iran itself, making it structurally embedded in the supply chains of every major oil-importing economy across Asia and Europe.
Why Bypass Options Remain Inadequate
The most frequently cited alternative to Hormuz transit is the UAE's Habshan-to-Fujairah pipeline, which connects Abu Dhabi's onshore fields directly to an Indian Ocean terminal, bypassing the Strait entirely. However, this pipeline carries a maximum capacity of roughly 1.5 million bpd, a fraction of what Hormuz handles on a quiet Tuesday. Saudi Arabia's East-West pipeline to the Red Sea port of Yanbu adds further capacity, but combined overland alternatives across the Arabian Peninsula fall well short of 5 million bpd in total throughput.
The Cape of Good Hope rerouting option is equally constrained in practical terms. Redirecting supertankers around southern Africa adds between two and three weeks to voyage times depending on origin and destination, dramatically increasing shipping costs, tying up vessel capacity in extended transit, and compressing the effective supply available to importers at any given time. For Asian buyers in Japan, South Korea, China, and India, who collectively absorb the largest share of Persian Gulf exports, this rerouting creates structural delivery delays that no spot market mechanism can fully absorb.
Furthermore, the oil geopolitics and logistics surrounding this region have long been understood as a systemic vulnerability — one that is now fully exposed.
Strategic Petroleum Reserve releases from the United States and coordinated IEA member drawdowns can cushion the early weeks of a disruption, but these instruments are designed for short-term bridging, not as permanent substitutes for physical supply. Once deployed at scale, they leave the global buffer architecture materially thinner for any subsequent shock.
Five Months of Escalation: How the Hormuz Stalemate Developed
The conflict that triggered the current crisis escalated from late February 2026, drawing the United States and Iran into a cycle of military confrontation, tanker attacks, export blockades, and failed diplomatic rounds that has now stretched past five and a half months. What began as a geopolitical flashpoint has evolved into a structural market disruption with no clear resolution timeline.
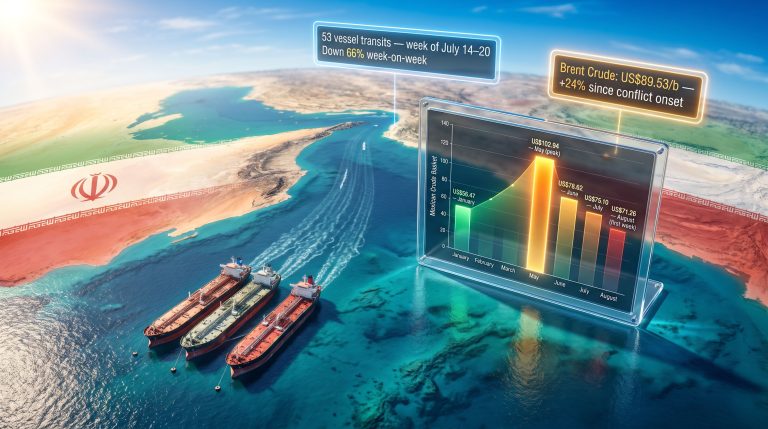
Hormuz tanker traffic has fallen to two-month lows, with vessel monitoring services recording as few as six ships transiting on a single Monday during peak stalemate conditions. Bank of America analysts have assessed that the Strait would require roughly ten times the current vessel count to stabilise oil markets at levels consistent with pre-conflict supply norms.
The Contradictory Narrative Problem
One of the most consequential features of the current crisis is the sharp divergence between official statements and independently verifiable data. Iran has publicly maintained that the Strait will remain closed until the United States ends hostilities and satisfies Tehran's stated negotiating conditions. Simultaneously, U.S. government communications have asserted effective control over the waterway, a claim that live tanker tracking data directly contradicts.
This contradiction has created what energy analysts describe as a sentiment-versus-supply paradox: crude oil futures oscillate on diplomatic headlines while the physical supply picture continues to deteriorate on its own trajectory, largely independent of what any official spokesperson asserts. The result is a futures market that has structurally underpriced the physical reality for months.
The Physical Supply Picture: What the Data Actually Shows
The raw numbers from verified institutional sources tell a story that diplomatic optimism has struggled to override.
| Indicator | Current Status (August 2026) |
|---|---|
| Hormuz tanker traffic | At two-month lows; six vessels recorded on a single Monday |
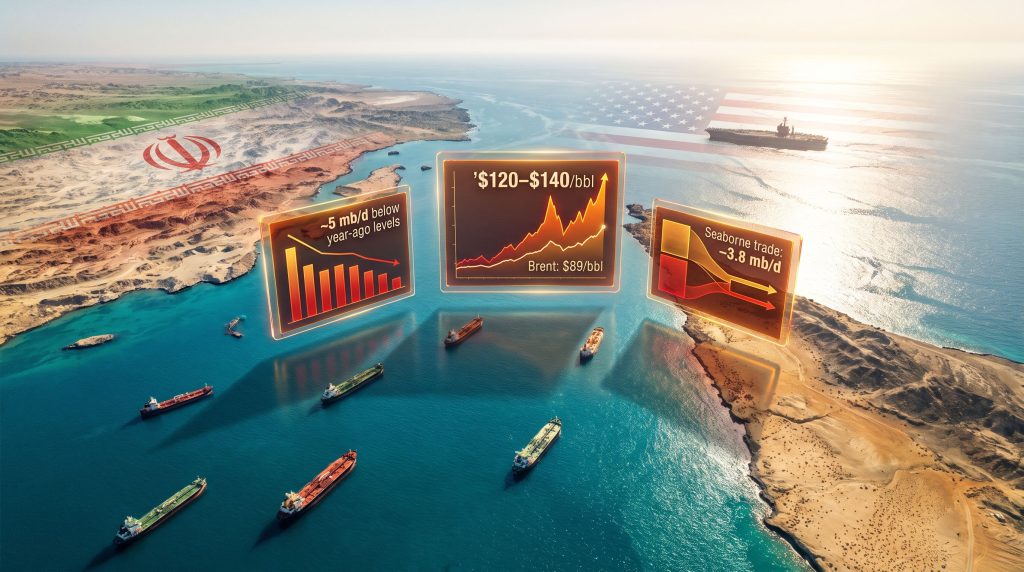
| Global refinery crude throughput (July 2026) | Nearly 5 mb/d below year-ago levels despite a monthly increase of 1.8 mb/d |
| Global seaborne petroleum product trade | Down approximately 3.8 mb/d year-on-year |
| Atlantic Basin refining margins | At record highs |
| OECD oil inventories | Rapidly declining; buffer reserves materially depleted |
| U.S. fuel exports (July 2026) | Up approximately 700,000 bpd year-on-year, partially offsetting but insufficient |
The IEA's August 2026 Oil Market Report captured the core tension: despite a monthly recovery in refinery activity, throughputs globally remain nearly 5 million bpd below the equivalent period in the prior year, with no existing refining capacity elsewhere capable of bridging the gap created by Middle Eastern and Russian supply bottlenecks. The agency explicitly flagged that previously available inventory buffers are rapidly depleting and that the urgency of restoring Strait flows has materially increased.
The China Factor: From Buffer to Accelerant
One of the least-discussed dynamics suppressing crude futures during the first half of the conflict was China's role as an inadvertent demand shock absorber. Chinese crude imports hit decade-low levels in May and June 2026, reducing the effective call on global oil supply precisely when physical flows were most disrupted. This temporary alignment of reduced demand and constrained supply gave futures markets breathing room that prevented a sharper early price spike.
That dynamic has now reversed. Chinese buyers have returned to the spot market, with import volumes recovering in July and August. Additionally, China's independent refining sector, commonly referred to as the teapot refiner network, is positioning to increase purchases of discounted Iranian crude, adding a further layer of demand pressure that was absent during the conflict's early months. The removal of the China buffer, combined with declining strategic reserve headroom, eliminates the primary mechanisms that kept a lid on futures pricing through Q2.
Why Refined Products Are the True Stress Indicator
While crude oil benchmarks such as Brent attract the most financial media attention, the most reliable real-time signal of underlying market stress in the current environment comes from the refined products complex, specifically the middle distillates: diesel, gasoil, and jet fuel.
Ole Hansen, Head of Commodity Strategy at Saxo Bank, has identified that refined products remain significantly tighter than crude, with Middle Eastern and Russian refinery disruptions simultaneously compressing supply from two of the world's largest refining regions. The consequence is that crack spreads — the differential between crude input costs and refined product output values — have reached exceptional levels in the Atlantic Basin.
Crack spreads function as a real-time barometer of downstream supply adequacy. When crack spreads widen sharply, it signals that the market is experiencing genuine product scarcity, not merely crude price speculation. The current configuration, with Atlantic Basin refining margins at record highs, confirms that the physical supply system is under stress that headline crude prices have not yet fully reflected.
Hansen has further noted that until the Strait actually reopens and production visibly recovers, volatility is likely to remain a defining feature, while distillates and the shape of the futures curve may continue to provide the clearest indication of how constrained the underlying energy market has become. The futures curve itself — specifically its degree of backwardation (where near-term delivery prices exceed longer-dated contracts) — has steepened in a manner consistent with physical tightness in prompt supply.
Institutional Price Forecasts: The $120 Scenario Mapped
Across the major financial institutions and energy research houses, a broad consensus has formed around the conditions required to push oil toward and beyond the $120 per barrel threshold. In addition, the crude oil price trends leading into this period provide important context for understanding how rapidly the situation has deteriorated.
| Institution | Price Scenario | Key Conditions |
|---|---|---|
| Capital Economics | $120 to $140/bbl | Hormuz remains closed into Q4 2026; OECD inventories reach tipping point |
| Goldman Sachs | +$15/bbl above baseline | Full one-month closure with no SPR or pipeline offsets |
| Goldman Sachs | +$10 to $12/bbl | One-month closure with SPR releases and pipeline diversion activated |
| Dallas Fed | $98 (Q2), $115 (Q3), $132 (Q4) | Closure removes roughly 20% of global supply through multiple quarters |
| Bernstein | $120 to $150/bbl | Extreme prolonged conflict scenario |
| Oxford Economics | $140/bbl | Severe but brief shutdown under high-risk conditions |
| Goldman Sachs (embedded premium) | ~$18/bbl already priced in | Ongoing Iran-Hormuz tension reflected in current futures |
Kieran Tompkins, Senior Climate and Commodities Economist at Capital Economics, has identified late Q3 to early Q4 2026 as the window during which physical shortages could force a step-change in crude pricing, assuming Hormuz flows remain severely constrained. The assessment is grounded in inventory trajectory modelling: if OECD stockpiles continue depleting at current rates while Chinese demand rebounds and no diplomatic resolution emerges, the market crosses from a sentiment-driven price regime into one governed by physical scarcity.
Amrita Sen, Founder and Director of Research at Energy Aspects, has assessed that the crude setup is more bullish on a fundamental basis than current futures pricing implies, indicating that the gap between physical reality and financial market positioning remains a latent repricing risk.
Goldman Sachs' warning on scenario architecture is particularly instructive on the role of duration: each additional month of closure without offsetting mechanisms adds approximately $15 per barrel to the price baseline. This means the market is not simply a binary open-or-closed question but a continuous function where every week of stalled negotiations compounds the eventual repricing pressure.
The next major ASX story will hit our subscribers first
Resolution Pathways: Three Scenarios for What Comes Next
Scenario 1: Diplomatic Breakthrough Before Q4
A negotiated framework agreement between the United States and Iran before end-September remains the primary mechanism for preventing the physical tipping point. Under this scenario, tanker traffic would gradually resume, inventory restocking would begin, and prices would likely stabilise — though elevated for weeks or months post-resolution given the depth of the existing drawdown. This scenario carries the most price-moderating potential, but its probability has diminished as negotiations have stalled repeatedly.
Scenario 2: Partial Reopening Under Contested Conditions
A more likely near-term outcome involves a partial reopening where some tanker traffic resumes under continued naval tension and contested control. Prices under this configuration would likely stabilise in the $95 to $110 per barrel range, with persistent volatility as each incident risks re-escalating the closure. Shipping insurance premiums would remain elevated, and the effective cost of Persian Gulf oil to importers would exceed the headline Brent price by a material margin.
Scenario 3: Prolonged Stalemate Into Q4 and Beyond
If no resolution emerges before early October, the physical market enters genuine shortage territory. Under this configuration, the $120 to $140 per barrel price range identified by Capital Economics transitions from tail risk to central scenario. Demand destruction at these levels would eventually produce its own correction, but not before imposing significant economic damage across oil-importing economies, particularly emerging markets with limited capacity to absorb fuel cost spikes.
Cascading Economic Consequences at $120+ Oil
The sectoral implications of a sustained move to $120 or above extend well beyond energy markets. Consequently, the trade war impact on oil prices adds yet another layer of complexity to an already fraught global supply picture.
| Sector | Consequence at $120 to $140/bbl |
|---|---|
| Aviation | Jet fuel margins at record highs; airline operating costs severely stressed |
| Road freight and logistics | Diesel surcharges accelerate; supply chain inflation broadens |
| Petrochemicals | Feedstock costs surge; plastic and chemical sector margins compress |
| Emerging market economies | Import bills spike; currency depreciation pressure intensifies |
| Global inflation | Energy component of CPI re-accelerates; central bank policy complexity increases |
| China coal-to-chemicals | Windfall economics emerge as oil substitution becomes commercially attractive |
One counterintuitive consequence of elevated oil prices is the economic windfall delivered to China's coal-to-chemicals industry, which competes with petroleum-derived feedstocks in certain product categories. When crude prices sustain above approximately $100 per barrel, coal-based chemical production becomes price-competitive, creating a structural beneficiary in an otherwise adversely affected landscape. Furthermore, OPEC's market influence over production decisions continues to shape how member states respond to sustained price volatility of this magnitude.
FAQ: Understanding the Hormuz Stalemate and the $120 Oil Risk
What Exactly Makes the Strait of Hormuz So Difficult to Replace?
The Strait combines geography, infrastructure, and volume in a way that no alternative can replicate. Bypass pipelines carry a fraction of its capacity, rerouting adds weeks to transit times, and the producer nations that depend on it have built their entire export infrastructure around Hormuz access over decades. Replacing it meaningfully would require years of capital investment.
Why Haven't Crude Futures Already Moved to $120 if Physical Supply Is This Constrained?
Three overlapping factors have suppressed the futures-physical gap: below-average Chinese Q2 imports acting as a demand buffer, large-scale SPR releases from IEA member nations, and the substantial inventory of oil already at sea when the conflict began. All three of these suppression mechanisms are now simultaneously fading.
What Is a Crack Spread and Why Does It Matter Here?
A crack spread measures the margin between the cost of crude oil inputs and the value of refined product outputs — primarily gasoline, diesel, and jet fuel. When crack spreads widen to record levels, as they have in the Atlantic Basin, it signals genuine downstream product scarcity, not merely speculative crude price movement. It is currently the most reliable indicator of physical market stress.
When Do Analysts Expect the Market Tipping Point to Arrive?
The consensus estimate among energy economists points to the window between late September and early October 2026, assuming Hormuz flows remain at current severely constrained levels through that period.
What Would $120 Oil Mean for Global Inflation?
At sustained levels above $120 per barrel, energy costs re-accelerate their contribution to consumer price indices across major economies. Central banks, many of which had begun easing cycles on the assumption of moderating energy prices, would face renewed pressure to maintain restrictive policy stances, complicating the broader macro recovery picture.
Disclaimer: This article is for informational and educational purposes only and does not constitute financial, investment, or trading advice. Oil price forecasts involve significant uncertainty and depend on geopolitical, macroeconomic, and logistical variables that are inherently difficult to predict. Readers should conduct independent research and consult qualified financial professionals before making any investment decisions.
Want to Stay Ahead of the Next Major Resource Discovery Amid Global Market Volatility?
When geopolitical disruptions reshape commodity markets at this pace, identifying significant mineral discoveries the moment they are announced can be a decisive advantage — Discovery Alert's proprietary Discovery IQ model scans ASX announcements in real time, delivering actionable alerts on high-potential opportunities across more than 30 commodities, and you can explore historic discoveries and their returns or begin your 14-day free trial today to position yourself ahead of the broader market.