August 13, 2026
The Quiet Architecture of an Oil Market in Crisis
Most energy market observers focus on the dramatic headline numbers when geopolitical disruptions strike: the price per barrel, the daily news cycle, the diplomatic statements. What receives far less attention is the slow-building structural framework that determines how severely any single disruption can reverberate through global supply chains. The Strait of Hormuz oil transit drop now unfolding is not simply a geopolitical flare-up. It is a live stress test of an energy system that has been quietly accumulating fragility for more than a decade.
Understanding why this crisis carries such disproportionate weight requires examining both the physical geography of global oil logistics and the investment patterns that have progressively narrowed the world's capacity to absorb supply shocks. Furthermore, the crude oil price trends emerging from this disruption cycle are already rewriting assumptions that institutional investors had treated as settled.
When big ASX news breaks, our subscribers know first
The Strait of Hormuz: A Chokepoint With No Substitute
The Strait of Hormuz sits at the mouth of the Persian Gulf, separating the Omani coastline from Iran's southwestern tip. At its narrowest navigable point, the waterway measures roughly 21 nautical miles across, and its shipping lanes are even more constrained. Despite this modest physical footprint, the strait functions as the central artery of global petroleum logistics.
Under normal operating conditions, somewhere between 125 and 140 vessels transit the strait every single day. Collectively, these movements account for approximately one-fifth of the world's total daily oil supply, according to the U.S. Energy Information Administration (EIA). That share encompasses crude oil, condensates, and liquefied natural gas destined primarily for Asian refiners, with secondary flows reaching European and global spot markets.
The reason no alternative route exists at scale is partly geographic and partly infrastructural. The Abu Dhabi Crude Oil Pipeline, which runs to the Fujairah terminal on the Gulf of Oman, can bypass the strait entirely but carries nowhere near the capacity to replace full Hormuz throughput. Maritime diversion via the Cape of Good Hope adds roughly two weeks of transit time and substantially higher freight costs, making it economically viable only for a limited subset of cargo grades. There is no pipeline network on earth capable of absorbing a full collapse of Hormuz-routed volumes.
EIA data had already signalled vulnerability before the current disruption cycle began. Crude and condensate volumes through the strait declined by 1.6 million barrels per day between 2022 and 2024, a trajectory that drew little mainstream attention at the time but established a pre-existing softness in throughput.
How Severe Is the Strait of Hormuz Oil Transit Drop? A Data-Driven Assessment
Vessel Transit Collapse: From 140 Crossings Per Day to Single Digits
The scale of the current disruption is difficult to overstate when viewed through shipping data. Where 125 to 140 vessels were crossing the strait daily before the conflict, that number has collapsed to a range of just 8 to 10 per day under current conditions, according to shipping data cited by Reuters and Al Jazeera. At the most acute disruption points, the numbers have been even more alarming.
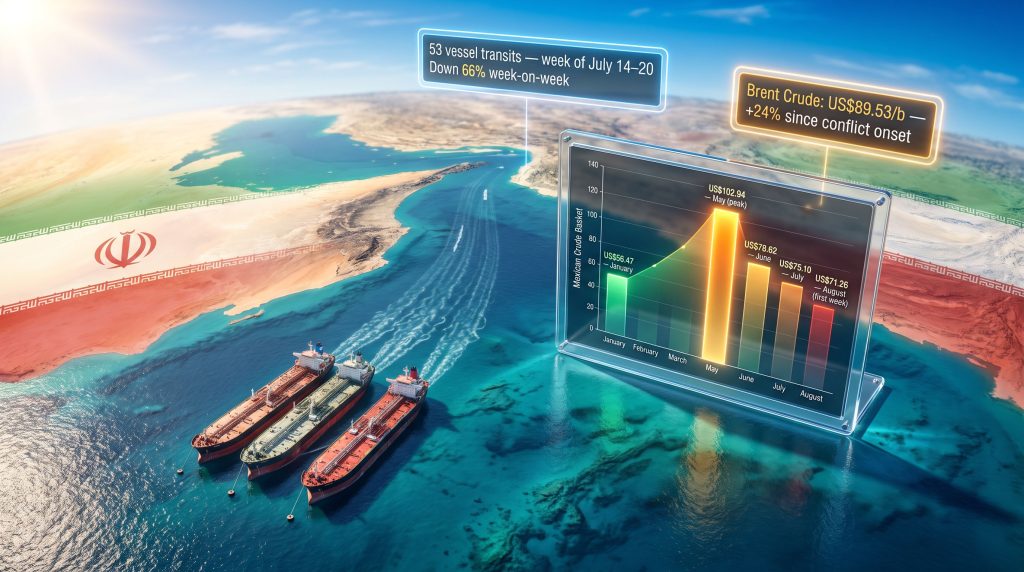
On July 9, only two tankers were recorded in early-morning hours, constituting what Lloyd's List Intelligence described as a near standstill. By July 17, just three commodity vessels had crossed, the lowest single-day count since May. The week through July 20 recorded only 53 total vessel transits compared with 157 in the preceding week, a 66% weekly decline. Within that weekly figure, tanker and gas carrier movements numbered just 30, against 90 in the prior week.
During an earlier disruption peak in April, approximately 7 ships crossed in a 24-hour window against the normal baseline of around 140, placing flows at well below 10% of typical volumes.
Hormuz Transit Decline Timeline: Key Milestones
| Period | Daily/Weekly Transits | Benchmark Comparison |
|---|---|---|
| Pre-conflict baseline | ~125-140 vessels/day | 100% of normal |
| April disruption peak | ~7 vessels/24 hours | Below 10% of normal |
| July 9 | ~2 tankers (early hours) | Near standstill |
| July 17 | 3 commodity vessels | Lowest since May |
| Week of July 14-20 | 53 total / 30 tankers and gas carriers | Down 66% week-on-week |
| Current reported range | 8-10 vessels/day | ~6-7% of normal |
What Is Driving the Strait of Hormuz Disruption?
Geopolitical Triggers: U.S.-Iran Tensions and Maritime Conflict
The proximate cause of the Strait of Hormuz oil transit drop sits in the broader conflict dynamics between the United States, Israel, and Iran. Iranian attacks on commercial vessels created a chilling effect on shipping confidence that extends well beyond the immediate incidents. Even vessels not directly targeted face war risk insurance premium escalation severe enough to make transit economically prohibitive for some operators.
The trade war oil impact has compounded these geopolitical pressures, layering additional market uncertainty onto an already strained logistics environment. The deeper issue is that negotiations between Washington and Tehran have produced no agreement on reopening the waterway. The structural divergence between the two governments' strategic objectives, compounded by regional proxy dynamics, has made progress through direct bilateral channels exceptionally difficult.
Third-party mediators have engaged, but the impasse persists. Each week of continued deadlock adds to the cumulative economic damage absorbed by energy-importing economies globally.
Why Negotiations Have Stalled
Several factors explain the durability of the negotiating deadlock:
- The United States and Iran hold fundamentally incompatible positions on nuclear programme scope, with neither side willing to make the concessions required for a framework agreement.
- Regional proxy conflicts in Yemen, Iraq, and Lebanon complicate any bilateral resolution by introducing additional actors with independent interests in prolonging maritime disruption.
- Third-party mediators, including Gulf Cooperation Council members and European diplomatic channels, lack the leverage necessary to bridge the core gaps.
- Iranian strategic planners have historically used Hormuz disruption as a negotiating instrument, meaning the threat's credibility depends on demonstrating willingness to accept prolonged standoff.
The commercial consequence of this deadlock is that war risk insurance premiums for vessels approaching or transiting the strait have surged. Some operators have withdrawn their fleets from the region entirely, physically reducing the pool of available tankers willing to service Gulf crude routes regardless of price.
How Is the Strait of Hormuz Transit Drop Affecting Global Oil Prices?
Brent and WTI Price Response: A 24% Surge Since Conflict Onset
Brent crude futures settled at US$89.53 per barrel, representing a 24% increase since the onset of the U.S.-Israel conflict with Iran, as reported by Al Jazeera. West Texas Intermediate traded at US$83.27 per barrel, according to Reuters. The oil price shock reverberating through producer economies has been equally pronounced, reshaping budget assumptions for energy-dependent governments worldwide.
The pricing dynamic operating here is worth examining carefully. Both OPEC and the IEA have simultaneously revised their demand forecasts downward, which under normal market logic would exert downward pressure on prices. Yet prices have moved sharply higher. This apparent contradiction resolves when the supply-side shock is properly weighted.
When a major supply chokepoint like the Strait of Hormuz experiences a transit collapse, the physical unavailability of crude creates a scarcity premium that overrides demand-driven price moderation. Refiners cannot process oil they cannot receive, and that physical scarcity is immediately reflected in spot market pricing regardless of what consumption forecasts show.
The Mexican Crude Oil Basket as a Regional Price Barometer
The Mexican crude oil basket provides a useful granular view of how the disruption has translated into real-world price movements for a significant producing nation. The basket stood at US$71.39 per barrel on August 6, 2026, according to Banco de Mexico data, down from US$80.56 per barrel recorded at the end of July but still 12.5% above the pre-conflict benchmark of US$63.46 per barrel recorded on February 27.
The full 2026 price range for the Mexican export blend illustrates just how violently the conflict reshaped market dynamics:
Monthly Average Price Progression: Mexican Crude Basket (2026)
| Month | Average Price (US$/b) |
|---|---|
| January | US$56.47 |
| May (peak) | US$102.94 |
| June | US$78.62 |
| July | US$75.10 |
| August (first week) | US$71.26 |
The single-day extremes were equally dramatic. The basket touched a low of US$51.64 per barrel on January 7 before surging to a high of US$110.78 per barrel on May 4, a range spanning nearly US$60 within a single calendar year. This kind of volatility range has historically taken multiple years to manifest and represents a fundamental repricing of geopolitical risk in hydrocarbon markets.
What Are OPEC and the IEA Forecasting Amid the Hormuz Crisis?
Diverging Institutional Outlooks: Demand Contraction Meets Supply Squeeze
Both major institutional forecasters have updated their outlooks in ways that, on the surface, appear contradictory to elevated prices. OPEC revised its 2026 global demand growth forecast downward to 580,000 barrels per day, while the IEA projected a 1.6 million barrel per day contraction in demand alongside a 4.3 million barrel per day decline in supply. The OPEC market influence on price formation, however, remains secondary to the physical supply blockage created by the strait's closure.
The critical insight here is the magnitude asymmetry. The IEA's projected supply decline of 4.3 million barrels per day is nearly three times the size of the demand contraction. When supply falls faster than demand, markets tighten even as consumption weakens. Asian refiners have already begun reducing processing rates in response to crude supply constraints caused by shipping restrictions, which creates a feedback loop: lower throughput raises per-unit costs, reducing refinery margins, which in turn suppresses finished product availability.
This is precisely the dynamic that makes a Hormuz disruption so economically disruptive compared with a demand-side slowdown. Demand contractions allow time for adjustment. Physical supply blockages do not.
The next major ASX story will hit our subscribers first
The Structural Supply Crisis Beneath the Geopolitical Shock
A Decade of Capital Underinvestment in Long-Cycle Exploration
The Hormuz crisis is unfolding against a backdrop of structural supply fragility that predates the current conflict by years. IEA data indicates that nearly 90% of global upstream capital investment since 2019, approximately US$500 billion annually, has been allocated to maintaining output from existing declining fields rather than discovering and developing new productive capacity.
The mathematics of this underinvestment are unforgiving:
- Without continuous capital deployment, global oil output would decline by approximately 8% per year, equivalent to 5.5 million barrels per day leaving the market annually.
- That annual decline rate equals the combined production output of Brazil and Norway vanishing from global supply every twelve months.
- U.S. tight oil production falls by more than 35% within its first twelve months without new drilling activity.
- New conventional oil projects now carry an average 20-year lead time from exploration licensing to first production.
- Annual conventional oil discoveries remain approximately 60% below 2010s levels.
Investment analysts with deep expertise in energy markets have observed that redirecting capital away from hydrocarbon exploration does not compress the timeline for the energy transition. What it does produce is periods of acute price volatility and energy insecurity that fall disproportionately on lower-income populations and energy-importing economies.
Why Non-OPEC Supply Is Approaching a Structural Ceiling
The Permian Basin in West Texas and Latin American production growth, particularly from Brazil's pre-salt deepwater fields, have provided meaningful demand buffers in recent years. However, that buffer is now operating near maximum capacity. Non-OPEC+ liquid supply is forecast to plateau near 56.5 million barrels per day before stagnating, according to market analysis from Aztlan Equity Management.
The US shale slowdown is a key contributor to this plateauing dynamic. Several compounding factors make this plateau increasingly difficult to reverse:
- Core shale plays in the United States are maturing, with the most productive acreage already developed and decline curves steepening.
- Deepwater developments in Latin America require multi-year lead times and capital commitments that have not been made at the scale necessary to sustain growth.
- African conventional production has faced persistent underinvestment and infrastructure challenges that limit its contribution to global supply growth.
- New exploration frontiers in the Arctic and ultra-deep offshore environments face both technical complexity and regulatory uncertainty that extends development timelines substantially.
What Does the Hormuz Crisis Mean for OPEC's Long-Term Market Power?
The Coming Concentration of Global Oil Production
The structural supply constraints described above have profound long-term implications for the distribution of market power in global oil. The IEA projects that under natural decline rates, OPEC's share of global oil production will rise from approximately 43% today to 53% by 2035, and could exceed 65% by 2050, a level of market concentration without precedent in modern oil history.
At that level of concentration, OPEC+ would possess effective absolute pricing authority. Consuming economies would have lost the non-OPEC supply diversification buffer that has historically provided some protection against cartel pricing decisions. The geopolitical implications extend well beyond energy markets: nations dependent on imported oil would face structurally higher inflation floors, reduced fiscal flexibility, and diminished ability to resist economic pressure from producing states.
Strategic Implications for Energy-Importing Economies
The convergence of short-term Hormuz disruption and long-term structural concentration creates a layered risk profile for energy importers:
- Asia-Pacific vulnerability: Japan, South Korea, China, and India collectively import a substantial proportion of their crude from Gulf producers. The strait is not merely a price variable for these economies — it is an existential supply dependency.
- Fiscal pressure on renewable transitions: Sustained energy price volatility forces governments to allocate emergency capital toward fossil fuel subsidies and strategic reserve replenishment, diverting funds from renewable energy infrastructure programmes.
- Supply chain systemic risk: The concentration of global oil supply in a single geographic region, dependent on a single maritime chokepoint, represents a systemic risk that no amount of demand-side management can fully offset.
- Insurance and freight market dislocations: War risk premium escalation affects not just crude tankers but the broader shipping ecosystem, raising input costs across manufactured goods supply chains that rely on maritime logistics.
How Are Global Shipping Markets Responding to the Hormuz Blockade?
Insurance, Freight Rates, and Route Diversion Economics
The shipping market response to the Strait of Hormuz oil transit drop has been multidimensional. War risk insurance premiums for vessels approaching the strait have surged to levels that make marginal cargo economics unworkable for some operators. Tanker owners face a binary choice between accepting elevated risk premiums and the physical danger of transit, or diverting their vessels around the Cape of Good Hope.
The Cape diversion route adds approximately 10 to 15 days of sailing time each way for vessels servicing Asian destinations from the Gulf. This extended transit time has two immediate effects: it reduces the effective tanker fleet capacity available to global markets by keeping vessels at sea longer, and it substantially increases per-barrel freight costs that are ultimately absorbed either by refiners or end consumers. Notably, oil transit rebound signals from June have not yet translated into sustained throughput recovery, suggesting the market dislocation remains entrenched.
Which Regions Face the Greatest Exposure?
Asia-Pacific economies carry the greatest direct exposure given their structural dependence on Gulf crude. China, Japan, South Korea, and India collectively source a disproportionate share of their imports from producers whose primary export route runs through the strait.
European exposure is more indirect but significant through refined product supply chains. Reduced Asian refinery throughput ripples into global product availability and pricing, affecting European consumers even when European crude supply is partially diversified.
The Western Hemisphere holds relative insulation given the Permian Basin's production scale and the Atlantic Basin's distinct supply routes. However, this insulation is not absolute. Global crude benchmarks are interconnected, and sustained Hormuz disruption elevates Brent pricing across all destination markets.
Frequently Asked Questions: Strait of Hormuz Oil Transit Drop
How much oil normally passes through the Strait of Hormuz?
Under normal operating conditions, the Strait of Hormuz facilitates approximately 20% of global daily oil supply, with vessel transit volumes ranging between 125 and 140 crossings per day, according to EIA data.
How far have vessel transits through the Strait of Hormuz fallen?
At the most acute disruption points, daily transits have dropped to as few as 2 to 3 vessels, representing less than 10% of normal throughput. Weekly transit volumes fell 66% in the week through July 20, 2026, according to Lloyd's List Intelligence shipping data cited by Reuters.
Why are oil prices rising if global demand forecasts are being cut?
Supply-side shocks from physical chokepoint disruptions override demand-side price moderation. The IEA's projected supply decline of 4.3 million barrels per day is approximately three times larger than its projected demand contraction. When refiners cannot access crude due to transit restrictions, physical scarcity dominates price formation regardless of consumption trends.
What happens to global oil markets if the Strait of Hormuz remains closed long-term?
A sustained closure would accelerate the structural supply deficit already building from a decade of underinvestment in exploration, push OPEC's market share concentration significantly higher, and likely trigger emergency government interventions in energy markets across Asia and Europe. The IEA's own modelling suggests a 4.3 million barrel per day supply decline under the current disruption scenario, with compounding effects if the closure extends beyond several months.
Is there a viable alternative to the Strait of Hormuz for oil shipments?
Limited pipeline alternatives exist, including the Abu Dhabi Crude Oil Pipeline routing to the Fujairah terminal on the Gulf of Oman. However, this pipeline carries insufficient capacity to replace full Hormuz throughput. Maritime diversion via the Cape of Good Hope adds significant cost and transit time but remains physically viable, albeit at substantially higher freight economics.
Key Takeaways: What the Hormuz Transit Drop Reveals About Global Energy Vulnerability
The Strait of Hormuz oil transit drop is not a temporary disruption that resolves cleanly when diplomacy succeeds. It is a revealing stress test of an energy architecture that has been accumulating structural fragility for years. Five conclusions stand out from the data and dynamics examined here:
- The physical chokepoint risk is more severe than pricing models typically capture. A 66% weekly decline in vessel transits and spot prices rising 24% simultaneously illustrate how rapidly maritime disruption can overwhelm demand-side moderation signals.
- A decade of capital underinvestment has eliminated the buffer capacity that once allowed markets to absorb supply shocks. With 90% of upstream spending going to maintaining existing declining fields, there is no reserve of rapidly deployable new supply.
- OPEC's structural market power is set to grow materially regardless of how the current crisis resolves. A rising share of global production, projected to reach 53% by 2035 and potentially 65% by 2050, represents a permanent shift in pricing authority.
- The demand and supply forecasts from OPEC and the IEA are not contradictory; they describe a market where supply falls faster than demand. The resulting tightening is structurally inflationary even as consumption growth slows.
- The three forward scenarios carry markedly different market implications. A diplomatic resolution would likely produce a sharp, short-lived price correction. A prolonged standoff sustains elevated prices and accelerates structural supply ceiling effects. A full and extended closure would represent the most severe supply shock in modern oil market history, with cascading consequences across Asian refinery systems, freight markets, and government fiscal positions globally.
Disclaimer: This article contains forward-looking statements, institutional forecasts, and market analysis drawn from publicly available data sources. These projections involve inherent uncertainty and should not be construed as investment advice. Energy market conditions can change rapidly based on geopolitical developments, and readers should conduct independent research before making investment or business decisions.
For further context on global oil chokepoint dynamics and upstream capital allocation trends, the U.S. Energy Information Administration publishes independent throughput data at eia.gov, and the IEA's upstream investment tracking reports provide detailed long-cycle capital expenditure analysis for global oil and gas markets.
Want to Stay Ahead of the Next Major Resource Discovery?
While geopolitical shocks reshape global energy markets, Discovery Alert's proprietary Discovery IQ model scans ASX announcements in real time, instantly identifying significant mineral discoveries across more than 30 commodities — from energy to critical minerals — and delivering actionable insights before the broader market reacts. Explore how historic ASX discoveries have generated exceptional returns and begin your 14-day free trial today to position yourself at the forefront of the next major find.