
July 28, 2026
Understanding the Strategic Importance of Hormuz in Global Energy Architecture
The world's energy security balances precariously on a 33.5-mile waterway between Iran and Oman, where approximately 21 million barrels of oil pass daily through shipping lanes barely three kilometers wide at their narrowest point. This geographic bottleneck, containing nearly half of the world's proven oil reserves in its immediate vicinity, has become the epicenter of a crisis that could reshape global energy markets for years to come, particularly as a US blockade of Strait of Hormuz represents an unprecedented escalation in regional tensions.
Why This Waterway Controls 20% of Global Oil Flow
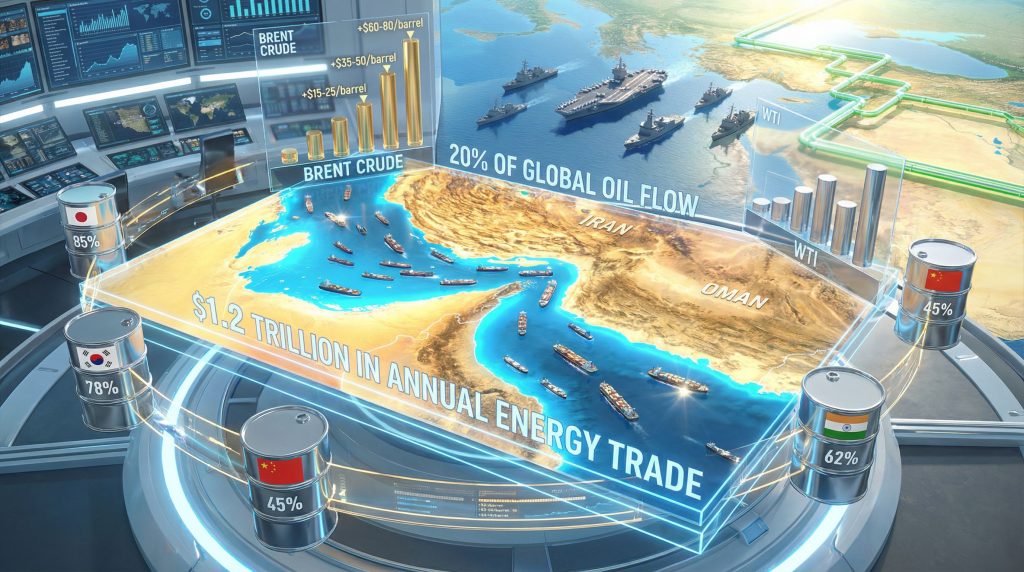
The Strait of Hormuz represents an irreplaceable artery in the global energy system, handling approximately 21-22 million barrels per day of crude oil and condensates. This volume represents roughly 20-21% of globally traded petroleum, making it the world's most critical energy chokepoint. Unlike other strategic passages, Hormuz lacks viable alternatives for the vast oil reserves of the Persian Gulf region.
During normal operations, approximately 17,000-20,000 vessels transit annually through carefully managed traffic separation schemes. These include northbound and southbound shipping lanes plus dedicated inbound traffic corridors, all monitored by sophisticated surveillance systems. Modern supertankers carrying 300,000-320,000 deadweight tons require 2-3 days for complete transit, depending on draft requirements and maritime traffic conditions.
The economic significance becomes stark when quantified: at current prices near $100-105 per barrel, the daily petroleum trade flowing through Hormuz represents approximately $2.1-2.3 billion in commercial value. This concentration of economic activity through a single chokepoint explains why even theoretical threats produce immediate market volatility.
Regional Export Dependencies:
• Saudi Arabia: 80% of exports (approximately 7.5 million barrels daily)
• United Arab Emirates: 95% of exports
• Qatar: $30+ billion annually in LNG exports
• Iraq: Substantial portion of southern oil field production
Comparative Analysis with Other Strategic Chokepoints
The Suez Canal handles 12-13% of global trade by volume with approximately 20,000 annual transits, yet offers the Cape of Good Hope alternative route despite adding 7,000 kilometers and 12-14 days to journey times. The Strait of Malacca processes 90,000-100,000 vessels annually, making it the world's busiest shipping lane by vessel count, but carries only 25-30% of global oil trade due to diversified Asian sourcing options.
| Chokepoint | Global Oil Share | Alternative Routes | Transit Time Penalty |
|---|---|---|---|
| Strait of Hormuz | 20-21% | Limited pipeline capacity | N/A – No viable alternatives |
| Suez Canal | 8-9% | Cape of Good Hope | +12-14 days |
| Strait of Malacca | 25-30% | Alternative sourcing | Variable |
| Bab el-Mandeb | 4-5% | Cape route via Suez | +7-10 days |
Furthermore, Hormuz remains uniquely critical because the Persian Gulf contains approximately 48% of world proven crude oil reserves, combined with the absence of practical alternative routing without extraordinary cost and time penalties. Pipeline alternatives face geographic limitations and political complications that render them inadequate substitutes for maritime transport capacity.
When big ASX news breaks, our subscribers know first
How Would a US Naval Blockade Actually Function?
The operational reality of implementing a comprehensive maritime blockade of the Strait of Hormuz would require military assets substantially exceeding normal US Central Command peacetime deployment. Current US Fifth Fleet presence maintains approximately 30-35 ships across the Persian Gulf, Gulf of Oman, and Arabian Sea, representing roughly 10-12% of forward-deployed Navy capacity during standard operations.
Military Assets Required for Effective Maritime Control
A sustainable, comprehensive blockade would necessitate approximately doubling current naval presence, requiring:
Primary Enforcement Assets:
• 8-12 guided-missile destroyers and frigate-class vessels
• 2-4 attack submarines for subsurface deterrence
• 1-2 aircraft carrier strike groups providing air superiority
• 15-20 coastal patrol ships and fast-attack craft
• 5-8 logistics support vessels for fuel, ammunition, and provisions
Specialized Requirements:
• 14-16 Mine Countermeasure Ships (currently limited global inventory)
• P-8 Poseidon maritime patrol aircraft for comprehensive surveillance
• Aegis radar systems and satellite surveillance networks
Historical precedent from Operation Earnest Will (1987-1988) demonstrates the resource intensity: the US Navy deployed 30-50 vessels at peak intensity to protect Kuwaiti tankers, costing approximately $500-700 million annually (equivalent to $1.5-2 billion in 2026 dollars) and requiring asset diversion from other global commitments.
The immediate announcement on April 13, 2026, with blockade commencement scheduled for 10 AM ET the same day, suggests either rapid surge deployment of existing assets or acceptance of less comprehensive enforcement than official rhetoric indicates. According to reports from Reuters, vessels immediately turned around demonstrates that announcement effects preceded full operational capability.
Legal Framework and International Maritime Law Implications
The comprehensive prohibition language used in the blockade announcement creates significant legal exposure under international maritime law. The UN Convention on the Law of the Sea (UNCLOS) Article 37 guarantees right of innocent passage through international straits used for international navigation, which Hormuz clearly satisfies.
Legal Complexities:
The Strait contains territorial waters of both Iran (12 nautical miles) and Oman (12 nautical miles), but primary shipping lanes traverse international waters. However, prohibiting all vessels, regardless of flag state or destination, would likely violate UNCLOS provisions and trigger legal challenges from maritime powers including China, Russia, and India.
A legally defensible approach would require framing the action as:
• Selective enforcement against Iranian-flagged vessels
• Cargo inspection protocols for weapons trafficking prevention
• Escort services for approved commercial traffic
The Cuban Missile Crisis quarantine provides the closest historical precedent, justified as limited measures against Soviet weapons shipments rather than universal traffic prohibition. Nevertheless, that action was never tested in international courts and involved a smaller geographic scope.
Iran has characterised the blockade as "an act of piracy," language that international maritime law experts would likely echo regarding universal traffic prohibition affecting neutral nations' vessels exercising transit rights.
Immediate Market Response Patterns Under Different Blockade Scenarios
Energy markets have already demonstrated extreme sensitivity to Hormuz-related developments, with Brent crude rising 7% to $102.29 and WTI jumping 8% to $104.24 within hours of the blockade announcement. These immediate price movements reflect market psychology's role in energy pricing, often exceeding actual supply disruption impacts, particularly with oil price movements demonstrating heightened volatility during periods of geopolitical uncertainty.
Oil Price Volatility Scenarios by Blockade Intensity
| Blockade Type | Brent Crude Impact | WTI Impact | Estimated Duration | Market Psychology |
|---|---|---|---|---|
| Iranian vessels only | +$15-25/barrel | +$18-28/barrel | 2-4 weeks | Moderate escalation concerns |
| Complete traffic halt | +$35-50/barrel | +$40-55/barrel | Days to weeks | Panic buying, strategic reserve activation |
| Extended closure (30+ days) | +$60-80/barrel | +$65-85/barrel | Recession trigger threshold | Demand destruction begins |
| Mining/militarisation | +$80-100/barrel | +$85-105/barrel | Immediate crisis response | Emergency rationing consideration |
Energy analysts note that the Iran conflict had already removed approximately 10 million barrels daily from global supply before the blockade announcement. Additional Hormuz closure creates what experts characterise as cumulative disruption, where existing supply constraints amplify new shortage effects.
Pre-crisis baseline: Brent crude traded around $70/barrel before conflict began in February 2026, reaching $119.45 during peak war intensity before settling to $94.26 following the brief ceasefire announcement. The blockade reversed much of that relief within hours, alongside US oil production decline that had already constrained domestic output capacity.
Secondary Market Cascades Beyond Crude Oil
Natural gas markets face parallel disruption as Qatar's LNG exports worth $30+ billion annually depend on Hormuz passage. European buyers, already managing supply diversification from Russian sources, confront additional LNG market tightening that could force increased reliance on remaining pipeline imports or emergency rationing protocols.
Refined Product Shortages particularly impact Asia-Pacific markets where major refining centres in Singapore, South Korea, and Japan depend heavily on Middle Eastern crude feedstock. Strategic petroleum reserve activation triggers vary by nation:
• United States: 60-90 day supply drawdown authority
• Japan: 90+ day strategic reserves, but limited alternative sourcing
• South Korea: 60 day reserves with moderate Russian/US alternatives
• European Union: Variable by member state (30-90 days typical)
Country-Specific Economic Exposure Analysis
Asian economies face disproportionate vulnerability due to geographic distance from alternative suppliers and limited pipeline infrastructure. The economic exposure calculations reveal stark disparities in energy security preparedness across major importing nations, particularly as energy export challenges affect regional supply dynamics.
Asian Import Dependencies and Vulnerability Rankings
| Country | Daily Consumption | Hormuz Dependency | Alternative Options | Strategic Reserves | Economic Risk |
|---|---|---|---|---|---|
| Japan | 7.5 million bpd | 85% | Norway, US shale (limited) | 90+ days | Critical |
| South Korea | 2.3 million bpd | 78% | Russia, US (moderate) | 60 days | High |
| India | 4.5 million bpd | 55-65% | Venezuela, domestic | 30-45 days | High |
| China | 10+ million bpd | 40-50% | Russia, domestic production | 60-90 days | Moderate |
Japan represents the most vulnerable major economy, importing 7.5 million barrels daily with 85% sourced from Middle Eastern suppliers dependent on Hormuz transit. Alternative sourcing from Norway and US shale faces logistical constraints and insufficient volume to replace Middle Eastern supplies. Japan's 90+ day strategic reserves provide temporary buffer but cannot sustain full replacement indefinitely.
South Korea's 2.3 million barrels daily consumption includes 78% from Middle Eastern sources, though the nation has pursued moderate diversification toward Russian and US suppliers. The country's advanced refining sector serves broader Asian markets, meaning disruption effects cascade beyond domestic consumption.
India consumes approximately 4.5 million barrels daily with 55-65% from Middle Eastern sources, representing more successful diversification efforts including Venezuelan imports and expanding domestic production. However, strategic reserves of only 30-45 days provide limited crisis duration tolerance.
China's 10+ million barrels daily consumption reflects only 40-50% Middle Eastern sourcing due to significant Russian imports and domestic production. This diversification, combined with 60-90 day strategic reserves, positions China as relatively less vulnerable, though absolute volume impacts remain substantial.
European Energy Security Calculations
European direct exposure to Hormuz disruption remains lower (5-10% of crude directly sourced), but indirect impacts through global pricing mechanisms create significant economic pressure. Germany, Europe's largest economy, had shifted substantially toward Russian natural gas before 2022 geopolitical developments forced deliberate dependency reduction.
LNG Market Tightening affects European buyers disproportionately as Qatar's exports represent crucial supply diversification from Russian pipeline sources. European strategic reserves vary substantially by member state, from 30 days in some Eastern European nations to 90+ days in Germany and France.
The economic pain threshold for European industrial consumers occurs when energy costs reach 3-4 times normal levels, triggering production shutdowns in energy-intensive manufacturing sectors including steel, aluminium, and chemical production.
Alternative Supply Route Analysis and Compensation Potential
The geographic reality of Persian Gulf oil exports creates fundamental limitations on alternative routing options. Pipeline infrastructure, whilst strategically important, cannot replace maritime transport capacity through Hormuz without massive infrastructure investment requiring years of construction time.
Pipeline Bypass Capacity Analysis
Trans-Arabian Pipeline System:
The historical Tapline from Saudi Arabia to Lebanon operated at maximum capacity of 300,000-500,000 barrels daily during its operational period, representing less than 7% of current Saudi export volume. Modern reconstruction would require extensive infrastructure investment and traverse politically complex territories including Syria and Lebanon.
Iraq-Turkey Pipeline:
Maximum theoretical throughput of approximately 1.6 million barrels daily under optimal conditions, though operational capacity has been constrained by political tensions and infrastructure maintenance issues. This capacity represents only 20-25% of typical Iraqi export volume and requires stable political relationships between Baghdad and Ankara.
Saudi East-West Pipeline:
Current surge capacity of approximately 5-6 million barrels daily to Red Sea terminals, representing the most viable alternative route. However, this capacity is already partially utilised for normal operations and cannot absorb full Gulf export volume. Additional pumping stations and pipeline parallel construction would require 18-24 months minimum for meaningful capacity expansion.
Emergency Production Surge Capabilities
US Shale Response Timeframes:
Rapid drilling programmes require 6-12 months to achieve meaningful production increases, with optimal conditions requiring existing lease access, available drilling rigs, and skilled workforce availability. Current US drilling trends suggest that spare drilling capacity could potentially add 1-2 million barrels daily within 6 months, but this volume represents only 10-20% of typical Hormuz throughput.
OPEC Spare Capacity Distribution:
• Saudi Arabia: 1.5-2 million barrels daily spare capacity
• UAE: 500,000-700,000 barrels daily
• Kuwait: 300,000-500,000 barrels daily
• Other members: Limited spare capacity due to investment constraints
Total OPEC spare capacity of approximately 2.5-3.5 million barrels daily represents only 12-16% of typical Hormuz throughput, insufficient to compensate for complete closure. Furthermore, OPEC production impact from earlier coordination decisions has reduced available surge capacity.
Strategic Petroleum Reserve Drawdown Rates:
• United States: Maximum 4.4 million barrels daily drawdown rate
• International Energy Agency coordinated: 60-90 million barrels available
• China: Estimated 60-90 day supply, exact drawdown rates classified
• Japan/South Korea combined: 90-120 million barrels available
Global strategic reserve drawdown could theoretically provide 10-15 million barrels daily for 60-90 days, but this approach depletes emergency reserves and requires coordinated international cooperation.
Historical Crisis Analysis and Pattern Recognition
Previous Hormuz-related crises provide crucial insights into escalation patterns, economic impacts, and resolution timeframes. The 1987-1988 "Tanker War" and 2019 tanker attacks demonstrate consistent market psychology responses and operational challenges that inform current scenario planning.
The 1987-1988 "Tanker War" Operational Lessons
Operation Earnest Will represented the most comprehensive historical precedent for sustained naval operations in the Strait of Hormuz. The US Navy's convoy protection model required 30-50 vessels at peak deployment, costing approximately $1.5-2 billion annually (2026 equivalent) and sustaining operations for 11 months.
Key Operational Insights:
• Convoy escort model proved more sustainable than universal traffic prohibition
• Mine countermeasures required specialised vessels in limited supply
• Insurance market responses created shipping cost multipliers of 200-400%
• Economic impact duration of 11 months before political resolution
Oil prices during the conflict period rose from $13-14/barrel pre-war to $40+ during peak crisis periods, representing 200-300% increases in equivalent purchasing power. However, actual supply disruption remained partial, with approximately 30-50% traffic reduction rather than complete closure.
Recovery Pattern Analysis:
Markets required 6-9 months after conflict resolution to stabilise pricing, reflecting insurance cost normalisation and rebuilt confidence in transit security. Shipping route adaptations included increased tanker sizes to reduce per-barrel transit risks and enhanced communication protocols with naval authorities.
2019 Tanker Attacks: Modern Escalation Patterns
The Saudi Aramco tanker attacks and drone strikes on petroleum facilities demonstrated modern asymmetric warfare capabilities whilst illustrating market psychology's role in contemporary energy pricing. Despite limited actual supply disruption, Brent crude rose from $60s to near $70/barrel within hours, representing 15-20% immediate price impact.
Technology Differences in Modern Context:
• Satellite surveillance systems provide real-time traffic monitoring
• GPS tracking enables precise vessel location identification
• Drone and missile technology creates asymmetric threat capabilities
• Automated trading systems amplify price volatility during crisis announcements
International Coalition Formation Speed:
The 2019 incidents triggered coalition formation within 2-3 weeks, including European maritime patrol contributions and coordinated intelligence sharing. However, coalition sustainability declined over 6-12 months without sustained threat levels.
The next major ASX story will hit our subscribers first
Geopolitical Consequences and Alliance System Dynamics
Extended Hormuz closure would stress-test alliance relationships under economic pressure whilst potentially accelerating geopolitical realignments. Historical analysis suggests that energy crises create both cooperation opportunities and competitive tensions among allied nations facing differential economic impacts.
Alliance System Stress Testing Under Energy Pressure
NATO Article 5 Applicability:
Economic blockade scenarios create ambiguity regarding collective defence obligations. Whilst NATO members Japan and South Korea (Major Non-NATO Allies) face severe economic impacts, traditional Article 5 triggers require armed attack on member territory rather than economic warfare affecting global commerce.
Gulf Cooperation Council Internal Dynamics:
Saudi Arabia's enhanced leverage during Hormuz closures could strain GCC unity as the Kingdom's alternative export routes (East-West pipeline to Red Sea terminals) provide competitive advantages over UAE and Kuwaiti exports dependent on Hormuz passage. This dynamic could accelerate Saudi regional leadership consolidation.
China-Russia Energy Partnership Acceleration:
Extended Hormuz closure would accelerate Chinese pivot toward Russian energy supplies, potentially solidifying the "Eastern Energy Alliance" through expanded pipeline infrastructure and long-term supply contracts. This partnership could reduce Western leverage over both nations whilst creating permanent market structure changes.
Regional Power Balance Shifts
Turkey's Strategic Position Enhancement:
Turkey's control of Iraq-Turkey pipeline capacity and potential expansion projects positions Ankara as crucial alternative transit route. Enhanced leverage could influence Turkish foreign policy alignment and provide economic benefits through increased transit fees and energy hub development.
Israel's Mediterranean Gas Export Opportunities:
European energy supply diversification needs could accelerate Israeli natural gas export development through proposed EastMed pipeline or expanded LNG facilities. This development could provide Israel with enhanced regional economic influence whilst supporting European energy security objectives.
Saudi Arabia's Regional Leadership Consolidation:
The Kingdom's East-West pipeline alternative and spare production capacity create enhanced regional influence during crisis periods. This leverage could accelerate Vision 2030 economic diversification projects and strengthen Saudi leadership within OPEC+ production coordination.
Crisis Duration Analysis and Sustainability Factors
Economic pain thresholds and political breaking points provide crucial indicators for realistic crisis duration assessment. Historical analysis suggests that energy price impacts create cascading political pressures that typically force resolution within specific timeframes based on domestic economic tolerance levels.
Economic Pain Thresholds and Political Breaking Points
United States Domestic Tolerance Levels:
Petrol prices reaching $4-6/gallon range historically trigger significant political pressure for crisis resolution. Current baseline prices of approximately $3.20-3.40/gallon suggest tolerance threshold of $6-8/gallon before widespread economic disruption and political crisis management requirements.
European Industrial Shutdown Triggers:
Energy-intensive manufacturing faces shutdown decisions when costs reach 3-4 times normal levels. Current European industrial energy costs averaging €80-120/MWh suggest shutdown thresholds around €300-400/MWh, typically reached within 30-45 days of sustained supply disruption.
Asian Import-Dependent Economy Indicators:
• Japan: Economic recession indicators activate when energy import costs exceed 15-20% of GDP
• South Korea: Manufacturing export competitiveness deteriorates with sustained $100+/barrel oil prices
• India: Inflation targeting becomes impossible above sustained $120+/barrel levels
Military Sustainability and Escalation Risk Assessment
Naval Blockade Operational Costs:
Sustaining comprehensive blockade operations requires approximately $3-5 million daily in direct operational costs, including fuel, ammunition, personnel, and logistics support. Crew rotation requirements necessitate doubling of committed naval assets to maintain 24/7 operational capability, straining global US Navy deployment capacity.
Iranian Asymmetric Response Capabilities:
• Mine-laying capacity: Small vessels and submarines can deploy mines requiring specialised countermeasures
• Missile and drone attacks: Range capabilities extending 200+ kilometres from Iranian territory
• Proxy force activation: Potential coordination with regional allies for harassment operations
Third-Party Intervention Probability:
Economic costs mounting above $100+ billion monthly in global trade disruption typically trigger major power intervention efforts. China, Russia, and European powers face strong economic incentives to pursue diplomatic solutions or alternative arrangements within 60-90 days of sustained crisis.
Investment Strategy and Market Positioning Analysis
Portfolio positioning during extended energy crises requires understanding both immediate volatility patterns and longer-term structural market changes. Historical energy crisis analysis provides frameworks for asset allocation decisions and risk management approaches during uncertain geopolitical periods.
Portfolio Positioning for Extended Crisis Scenarios
Energy Sector Equity Performance Patterns:
During the 1987-1988 Tanker War, major oil companies outperformed broader markets by 25-40% during crisis periods, with integrated oil companies (possessing both production and refining assets) showing superior performance compared to pure exploration and production firms. Current energy sector valuations suggest potential for 50-75% outperformance during sustained crisis conditions.
Currency Impact Analysis:
• Oil-exporting nations: Currencies strengthen 10-20% during sustained price increases
• Oil-importing nations: Currencies weaken 5-15% due to trade balance deterioration
• US Dollar: Typically strengthens as safe-haven demand offsets energy import costs
Infrastructure Investment Acceleration Opportunities:
• Pipeline development projects: 5-10 year payback periods improve to 2-3 years
• Strategic petroleum reserve expansion: Government contracts provide stable returns
• Alternative energy acceleration: Crisis conditions justify accelerated renewable deployment
Long-term Strategic Market Architecture Changes
Permanent Diversification Away from Hormuz Dependencies:
Extended crisis duration exceeding 6-9 months typically triggers permanent supply chain restructuring. Japanese and South Korean energy importers would likely negotiate long-term contracts with US shale producers and alternative suppliers, reducing future Hormuz dependency by 10-20% permanently.
Renewable Energy Transition Acceleration:
Energy security concerns historically accelerate renewable energy investment by 30-50% during crisis periods. Current technological cost structures suggest that sustained $100+/barrel oil prices make renewable alternatives economically compelling across broader application ranges.
Strategic Reserve Distribution Changes:
Crisis experience typically triggers strategic reserve expansion and geographic redistribution. Asian nations particularly likely to increase reserves from current 60-90 day levels to 120-180 days, requiring substantial infrastructure investment and creating crude oil demand increases of 50-100 million barrels globally.
What Does This Mean for Global Markets?
The implementation of a US blockade of Strait of Hormuz represents an unprecedented escalation that could fundamentally alter global energy architecture. Immediate impacts extend beyond oil prices to encompass currency markets, bond yields, and equity valuations across energy-intensive sectors.
Maritime insurance costs alone could multiply by 200-400%, effectively pricing smaller operators out of transit markets whilst consolidating shipping capacity among major corporations with enhanced risk management capabilities. This consolidation could create permanent structural changes in global shipping markets beyond the crisis period.
The psychological impact on energy markets often exceeds physical disruption effects, as oil price movements demonstrate during periods of geopolitical uncertainty. Trading algorithms respond instantaneously to crisis announcements, amplifying volatility patterns that can persist for months after initial triggers.
The ultimate resolution of any US blockade of Strait of Hormuz will depend on the complex interplay of economic pain thresholds, military sustainability, and diplomatic breakthrough possibilities. Whilst immediate market disruption appears certain, the long-term implications could fundamentally reshape global energy architecture, alliance relationships, and strategic planning frameworks for decades to come.
Disclaimer: This analysis contains forecasts, speculation, and scenario modelling based on historical precedents and current market conditions. Energy markets are highly volatile and subject to unpredictable geopolitical developments. Investment decisions should be made based on individual risk tolerance and professional financial advice. Market predictions are subject to significant uncertainty and should not be considered as guaranteed outcomes.
Ready to Navigate Energy Market Volatility?
With energy crises demonstrating the capacity to reshape global investment landscapes within hours, Discovery Alert's proprietary Discovery IQ model delivers real-time alerts on significant ASX mineral discoveries that can provide portfolio diversification opportunities during volatile periods. Gain immediate access to actionable investment insights and discover how historic mineral discoveries have generated substantial returns by exploring our comprehensive analysis of major ASX discoveries that have transformed investor portfolios during uncertain market conditions.