July 16, 2026
The Chokepoint Economics of Energy Dependency
Global energy markets are built on an assumption most participants rarely examine closely: that the physical infrastructure moving oil and gas from producer to consumer will remain broadly functional. That assumption holds until it does not. When the world's single most concentrated energy transit corridor comes under sustained attack, the cascading effects reach far beyond the vessels themselves, touching refinery feedstock availability, insurance market pricing, national export revenues, and ultimately the cost of energy for billions of consumers across Asia and Europe.
Hormuz tanker attacks slow Gulf oil exports in ways that ripple through the entire global supply chain, and the crude oil market dynamics at play here are unlike anything seen in recent decades. The Strait of Hormuz sits at the centre of this vulnerability. Stretching just 33 kilometres at its narrowest navigable width, this passage between the Persian Gulf and the Arabian Sea carries an estimated 20% of the world's daily oil supply under normal operating conditions, along with substantial liquefied natural gas volumes destined primarily for Asian import terminals. No other single point in global energy infrastructure concentrates this level of dependency in such a geographically constrained corridor.
When big ASX news breaks, our subscribers know first
Why the Strait Cannot Be Bypassed at Scale
Understanding why Hormuz tanker attacks slow Gulf oil exports so dramatically requires first understanding the structural absence of credible alternatives for most producers in the region. The OPEC market influence over this corridor further compounds the complexity, as member nations' output decisions intersect directly with the physical constraints on export routes.
- Saudi Arabia can reroute a portion of crude through pipeline infrastructure terminating at Red Sea export terminals, providing partial but not complete insulation from Hormuz disruption
- Iraq has no meaningful alternative export route whatsoever, with virtually all crude shipments depending on the Basra Oil Terminal in the northern Gulf
- Kuwait and the UAE face comparable structural constraints, lacking overland pipeline capacity to meaningfully substitute for seaborne Hormuz transit
- Qatar's LNG export terminals sit geographically inside the Gulf, meaning every outbound LNG cargo must pass through the strait regardless of destination
This geography is not incidental. It is the product of decades of infrastructure investment decisions made during periods of relative stability, when the case for expensive bypass construction was difficult to justify economically. The consequence is a regional energy export architecture that channels an extraordinary proportion of global supply through a corridor that can be threatened by a single nation-state's naval and drone capabilities.
A Shipping Collapse Measured in Data
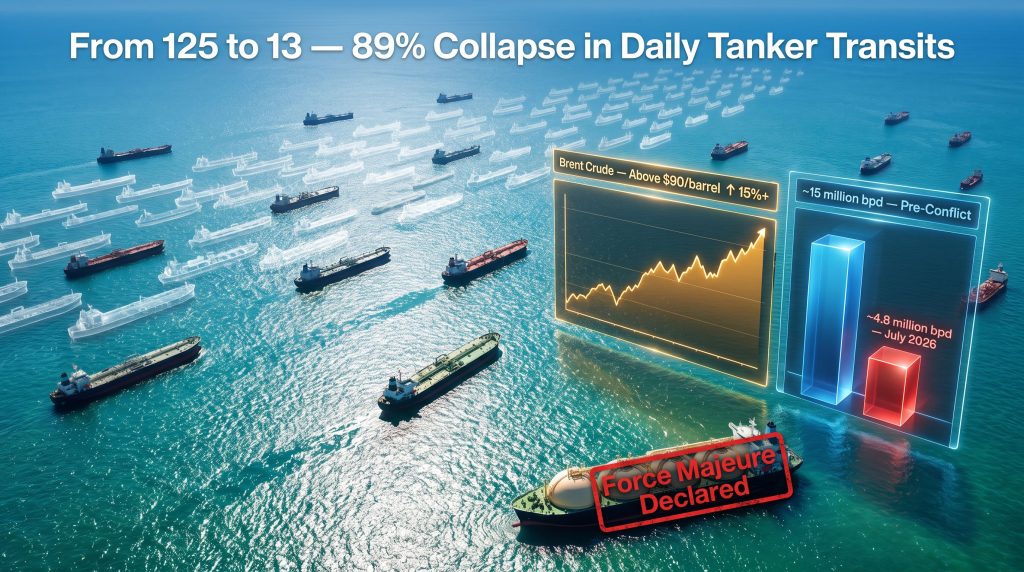
The scale of the current disruption becomes most legible when examined through the lens of quantitative shipping intelligence. Before hostilities escalated in early 2026, approximately 125 commercial vessels transited the strait daily, supporting an oil flow of roughly 15 million barrels per day from Gulf producers to world markets. By July 2026, that picture had changed dramatically.
| Indicator | Pre-Conflict Baseline (Feb 2026) | Current Conditions (Jul 2026) | Change |
|---|---|---|---|
| Daily tanker transits | ~125 vessels/day | 13-15 vessels/day | Down ~89% |
| Gulf oil export volume | ~15 million bpd | ~4.8 million bpd | Down ~68% |
| Peak disruption (Mar 2026) | Baseline | 80% reduction in seaborne traffic | Severe |
| Brent crude price | Pre-conflict levels | Above $90/barrel | Up 15%+ |
| Qatar LNG exports | Normal operations | Force majeure declared | Full suspension |
The methodology behind these figures relies on a dual-track analytical approach combining Sentinel-1 synthetic aperture radar satellite imagery with Automatic Identification System (AIS) vessel tracking data. This pairing allows analysts to count berthed tankers at major terminals even when vessels suppress their own transponder signals, detect loading and offloading activity at major Saudi Gulf export infrastructure, and identify what the industry now refers to as dark shipping — the deliberate disabling of AIS transponders by operators seeking to reduce their targeting profile.
According to UNCTAD's analysis of Strait of Hormuz disruptions, the trade and development implications of sustained corridor closures extend well beyond energy markets, affecting everything from food commodity pricing to industrial input costs across developing economies.
The increasing normalisation of dark shipping operations represents more than a security adaptation. It is actively degrading the transparency of global oil flow data, making both market analysis and coordinated policy responses more difficult to execute with confidence.
Country-by-Country Exposure: Who Bears the Greatest Risk
Saudi Arabia: Partial Protection, Real Vulnerability
Saudi Arabia holds a structural advantage that none of its neighbours can replicate. Its pipeline network connecting Gulf production fields to Red Sea terminals allows a meaningful share of crude volumes to bypass the strait entirely. This advantage is real but bounded.
Satellite data showed as few as one tanker berthed at Saudi Arabia's principal Gulf export facility at the height of the July 2026 deterioration. Loading activity had briefly recovered during the June ceasefire window before unwinding again as conflict conditions resumed. The Red Sea diversion capacity does not cover total Saudi export volumes, leaving a substantial portion of the kingdom's crude still dependent on vessels willing and able to transit Hormuz.
Iraq: Structurally Exposed With No Fallback
Iraq represents the starkest case of export vulnerability in the region. With near-total dependence on the Basra Oil Terminal for crude shipments, any contraction in tanker availability at the northern Gulf creates a chain reaction with predictable consequences:
- Vessel shortages reduce the number of loadings possible at Basra
- Export storage capacity fills as loading rates slow
- Upstream production is curtailed to prevent infrastructure overflow
- Monthly export volumes decline despite remaining above some prior historical benchmarks
An Iraqi oil ministry spokesperson acknowledged that uncertainty surrounding the strait continues to cause fluctuations in export volumes, even as the ministry noted monthly shipments remain above some prior reference levels. The distinction between monthly volumes and daily flow rates matters here: Iraq can partially compensate for disrupted days with accelerated loadings when conditions briefly improve, but sustained tanker shortages erode this flexibility over time.
UAE and Kuwait: Relative Resilience Under Threat
Both the United Arab Emirates and Kuwait demonstrated comparatively stable loading operations in the early stages of the July 2026 deterioration. UAE terminal activity remained relatively resilient according to satellite data, and Kuwait continued loading cargoes ahead of the latest escalation wave. However, two UAE-flagged vessels sustained damage in recent attacks, introducing a forward uncertainty into UAE export continuity that the current data does not yet fully reflect.
Iran: The Asymmetry at the Heart of the Crisis
Perhaps the most consequential and least widely discussed dimension of the Hormuz disruption is the structural asymmetry between Iranian and non-Iranian producer exposure. Iranian crude exports have continued at near-normal volumes through its established shadow fleet network, comprising vessels that operate outside conventional tracking systems, international insurance frameworks, and sanctioned financial channels.
This creates a situation where the nation responsible for the tanker attacks absorbs comparatively little economic disruption from them, while neighbouring producers that have no involvement in the conflict bear the majority of the export revenue damage. Furthermore, for global oil markets, this asymmetry means Iranian supply volumes remain partially available even as total Gulf export capacity contracts sharply.
The Ceasefire That Could Not Hold
Why June 2026 Briefly Offered a Different Trajectory
A 60-day ceasefire negotiated between the United States and Iran in mid-2026 created a genuine, if brief, window for Gulf shipping recovery. During the truce period, Saudi Arabia partially restored Gulf loading operations, tanker operators began cautiously re-entering the corridor, and export trajectories showed early signs of normalisation. Commodity market analysis at the time characterised the recovery trajectory as genuinely promising before noting that it collapsed almost as quickly as it formed, with conditions subsequently moving in the wrong direction across essentially all key metrics.
The truce's failure to hold has practical consequences beyond the immediate security environment. Each cycle of partial recovery followed by renewed disruption deepens the risk premium that tanker operators and their insurers embed into Hormuz transit calculations, making the corridor more expensive and less accessible even during periods of temporary calm.
The IMO Warning and Its Market Significance
Since the ceasefire collapsed, at least nine commercial ships have sustained damage, including five very large crude carriers (VLCCs). The International Maritime Organization issued one of its most forceful navigational advisories since hostilities began, formally declaring conditions in the strait too hazardous for normal commercial navigation. As Reuters has reported, traders remain uncertain about how much oil can realistically escape Hormuz under these conditions, further clouding market pricing signals.
IMO safety advisories of this severity carry direct practical consequences. Many commercial operators and charter parties include clauses allowing vessel withdrawal from designated high-risk zones once official navigational warnings reach certain thresholds. An IMO declaration of this nature effectively provides contractual cover for operators choosing to avoid the corridor entirely, accelerating the withdrawal of available vessel supply independent of any individual operator's risk appetite.
Oil Price Mechanics and the LNG Dimension
Brent crude surpassed $90 per barrel by mid-2026, representing an increase of more than 15% from pre-conflict levels in late February. The oil price movements observed reflect two distinct but reinforcing forces operating simultaneously: the immediate physical reduction of approximately 10 million barrels per day in accessible export volumes, and a risk premium embedded by markets anticipating that the disruption may prove more durable than initial assessments suggested.
The disruption's reach extends into global gas markets through Qatar's position as the world's largest LNG exporter. Following attacks on its export infrastructure, Qatar declared force majeure on LNG shipments, suspending liquefaction operations for at least one month. The LNG supply outlook has consequently deteriorated sharply, with consequences cascading across multiple import markets:
- Asian buyers, particularly in Japan, South Korea, and China, face spot market procurement needs that cannot be rapidly substituted from alternative Atlantic Basin or Australian supply
- European buyers who incorporated Qatari LNG into post-Russia supply diversification strategies face renewed procurement pressure
- LNG spot prices in Asian trading hubs responded with significant upward movement, compressing the margin available to gas-intensive industrial users
Insurance Market Dynamics: The Hidden Multiplier
Beyond direct vessel damage, the war risk insurance market has become an independent constraint on shipping recovery that deserves specific attention. When war risk insurance premiums for Hormuz transit escalate to levels that make voyages economically unviable, vessels are effectively removed from the available fleet without any physical damage occurring.
Underwriters assessing continued exposure to the corridor are applying probability-weighted loss expectations that already incorporate the current IMO advisory, creating a structural floor on how quickly export volumes can recover even if physical hostilities were to cease tomorrow. Insurance market normalisation has historically lagged physical security improvements by weeks to months in analogous disruption events, meaning the effective duration of export constraint may extend well beyond any ceasefire agreement.
The next major ASX story will hit our subscribers first
Recovery Scenarios and Historical Analogues
| Scenario | Trigger Conditions | Estimated Recovery Timeline | Market Impact |
|---|---|---|---|
| Rapid Resolution | Durable ceasefire; IMO safety certification restored | 4-8 weeks for traffic normalisation | Brent correction toward $70-75/barrel |
| Protracted Disruption | Intermittent conflict; no sustained truce | 3-6 months partial recovery | Sustained elevated prices; demand destruction |
| Extended Closure | Full escalation; strait effectively closed | 12+ months; structural reconfiguration | Recession risk; emergency SPR deployment |
Historical precedents from the 1980s Tanker War and the 2019 Gulf of Oman incidents offer partial but imperfect analogies. Neither event involved a disruption of current magnitude or duration. The consistent pattern across prior episodes is instructive: producer infrastructure adaptation to alternative routing takes months to years to develop at scale, insurance market recovery consistently lags physical security improvements, and Strategic Petroleum Reserve releases from the United States and IEA member nations provide meaningful short-term buffers but cannot substitute for the restoration of sustained supply flows.
Demand destruction in oil-importing economies also plays a partial offsetting role over a 3-6 month horizon as price-sensitive industrial users reduce consumption. However, this mechanism works too slowly and imprecisely to prevent near-term price dislocations in tightly supplied markets.
Frequently Asked Questions
What percentage of global oil supply passes through the Strait of Hormuz?
Approximately 20% of global daily oil consumption transits the strait under normal conditions, equating to roughly 15 million barrels per day from Gulf producers combined.
How many tankers are currently transiting the strait daily?
As of July 2026, satellite and vessel tracking data indicate approximately 13-15 tankers per day, compared to a pre-conflict baseline of around 125 daily sailings — a reduction of approximately 89%.
Which Gulf producer is most structurally exposed?
Iraq carries the highest structural vulnerability, given near-total dependence on the Basra Oil Terminal and the absence of any viable alternative export corridor. Saudi Arabia holds meaningful partial insulation through Red Sea pipeline diversion capacity that Iraq simply does not possess.
Has Qatar suspended LNG exports?
Yes. Following attacks on its export infrastructure, Qatar declared force majeure on LNG shipments and suspended liquefaction operations for at least one month. Given Qatar's position as the world's largest LNG exporter, this suspension carries significant implications for global gas markets independently of the crude oil disruption.
What is dark shipping?
Dark shipping describes commercial vessels deliberately disabling their AIS transponders to avoid detection and reduce targeting risk. The practice has expanded significantly among tanker operators attempting Gulf transit, complicating energy flow monitoring and introducing additional maritime safety risks beyond those created by the attacks themselves.
How much have oil prices increased?
Brent crude exceeded $90 per barrel as of mid-2026, representing an increase of more than 15% from pre-conflict levels in late February 2026, driven by both physical supply reduction and forward risk premium.
Strategic Implications: What the Data Collectively Suggests
The commodity price impacts of this disruption extend well beyond energy markets, with flow-on effects already visible across metals, fertilisers, and industrial inputs. Collectively, the data points to several critical conclusions:
- The Strait of Hormuz remains functionally irreplaceable as a global energy transit corridor at current volumes, with no combination of alternative routes capable of fully compensating for its sustained closure
- The asymmetry between Iranian export continuity through shadow fleet infrastructure and the export losses borne by non-Iranian Gulf producers creates a geopolitically skewed economic impact that conventional supply-demand modelling does not adequately capture
- Dark shipping proliferation is materially degrading the transparency of global oil flow data, with implications for both market price discovery and coordinated international policy response
- War risk insurance market dynamics are likely to extend the effective duration of export constraint beyond any physical ceasefire, as underwriters require sustained and verifiable safety evidence before restoring normal coverage terms
- Qatar's force majeure adds a distinct gas-market disruption layer to what is often framed purely as a crude oil supply problem, broadening the macroeconomic exposure across energy-intensive economies globally
- Full export normalisation across the Gulf, even under optimistic conflict resolution scenarios, is realistically measured in months rather than weeks
Further analysis on Gulf energy infrastructure and upstream developments across the Middle East region is available through World Oil at worldoil.com.
Want to Capitalise on the Market Opportunities Created by Major Resource Discoveries?
While geopolitical disruptions reshape global energy markets, Discovery Alert's proprietary Discovery IQ model delivers real-time alerts on significant ASX mineral discoveries — instantly translating complex data across more than 30 commodities into clear, actionable insights for both short-term traders and long-term investors. Explore how historic mineral discoveries have generated substantial returns and begin your 14-day free trial today to position yourself ahead of the market.