July 13, 2026
When Conflict Inflates, Not Elevates: Rethinking Gold's Safe-Haven Logic
The assumption that geopolitical conflict automatically drives gold prices higher is one of the most deeply embedded beliefs in commodity investing. For decades, military escalations, regional wars, and energy supply disruptions have been reliably followed by bullion rallies as investors sought protection from uncertainty. That playbook, however, depends on a specific set of conditions that do not always materialise. When the primary market transmission channel of a crisis runs through energy costs rather than financial system stress, the conventional wisdom can invert with surprising force.
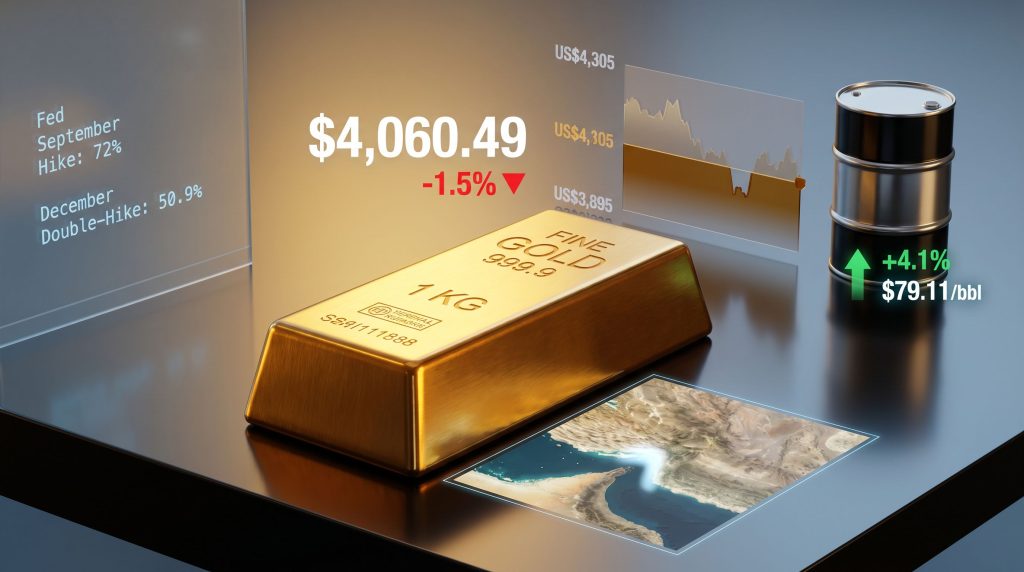
The Hormuz tensions gold price drop of mid-2026 is a textbook example of this inversion. Rather than surging on conflict risk, spot gold fell 1.5% to $4,060.49 per ounce as Iran's declaration of a Strait of Hormuz closure sent Brent crude surging 4.1% to $79.11 per barrel. The energy shock fed directly into inflation expectations, which in turn recalibrated Federal Reserve rate hike probabilities, and that sequence of events overwhelmed whatever safe-haven premium the crisis might otherwise have generated.
Understanding why this happened requires dissecting the mechanics of how geopolitical shocks transmit into gold markets, and why the channel that dominates in any given crisis determines whether bullion rises or falls. For context, the broader gold market outlook heading into 2026 had already positioned bullion near historically elevated levels.
When big ASX news breaks, our subscribers know first
The Strait of Hormuz: A Chokepoint With Global Monetary Consequences
Why Oil and Gold Interact Through Inflation, Not Through Fear
The Strait of Hormuz is the world's most consequential energy chokepoint. Approximately 20% of global oil supply transits this narrow passage daily, connecting the Persian Gulf producers to international markets. When this corridor faces disruption, the supply-side shock registers almost immediately in benchmark crude prices, with downstream consequences that extend well beyond the energy sector.
The 2026 Hormuz closure declaration did exactly what the market feared: it spiked oil prices sharply and rapidly. However, the critical insight for gold investors lies in what an oil price spike does to the macroeconomic environment:
- Higher energy costs elevate headline consumer price indices across import-dependent economies within four to eight weeks
- Elevated inflation expectations reduce the probability of central bank rate cuts, and in acute cases, shift pricing toward additional hikes
- A rising US dollar, which typically strengthens during energy-driven inflation episodes, creates a secondary headwind for gold by making bullion more expensive for non-US buyers
- Federal Reserve rate hike probability shifts directly affect the opportunity cost of holding non-yielding assets like gold
The table below maps the full transmission mechanism from the Hormuz oil shock to gold's price response:
| Transmission Channel | Market Effect | Gold Impact |
|---|---|---|
| Oil price spike | Brent crude +4.1% to $79.11/bbl | Negative: inflation expectations rise |
| Inflation expectations | CPI forecast near 3.9% Q2 peak | Negative: rate cut bets reduced |
| USD Index strengthening | +0.1% to 101.13 | Negative: gold more expensive internationally |
| September Fed hike probability | Rises from 63% to 72% | Negative: non-yielding asset less attractive |
| December double-hike probability | Rises from 47.6% to 50.9% | Negative: sustained tightening concern |
| Safe-haven demand | Partially absorbed by USD | Neutral to mildly negative |
The net effect was not a flight to gold. It was a flight to dollars.
Why This Crisis Defied Gold's Historical War Premium
The Two Pathways of Geopolitical Shock: Financial Stress vs. Inflation Acceleration
Not all geopolitical crises affect gold in the same way. The distinction between two fundamentally different transmission pathways explains why the Hormuz tensions gold price drop confounded so many market participants.
Pathway One: Financial System Stress
When a crisis threatens currency stability, banking system integrity, or sovereign debt sustainability, gold typically benefits. Capital flows toward bullion as a store of value outside the financial system, and safe-haven demand is genuine and sustained. This is the scenario most closely associated with gold's reputation as a gold safe-haven investment.
Pathway Two: Energy-Driven Inflation Acceleration
When a crisis primarily operates through oil markets, the inflation consequences can force central banks toward tighter monetary policy. This raises real yields, strengthens the dollar, and reduces gold's appeal as a non-yielding alternative. Safe-haven demand exists but is overwhelmed by the monetary policy channel.
The 2026 Hormuz episode is a clear instance of Pathway Two. Nicholas Frappell, global head of institutional markets at ABC Refinery, noted that outbreaks of Gulf violence are consistently accompanied by pressure on gold, acknowledging the complexity of the relationship rather than assuming a simple safe-haven outcome. Tony Sycamore, market analyst at IG, observed that the energy price surge reignited concerns about rate hike timelines being pulled forward, identifying the monetary policy channel as the dominant force.
Key Insight: The war premium associated with US-Iran conflict tensions had already been substantially priced into gold markets during the initial escalation phase of 2026. Subsequent developments added limited incremental safe-haven demand because the risk had already been partially discounted.
How Historical Patterns Compare to the 2026 Hormuz Response
| Historical Pattern | Typical Gold Response | 2026 Hormuz Response |
|---|---|---|
| Middle East conflict escalation | +3% to +8% safe-haven rally | -1.5% decline |
| Oil price spike | Mixed (inflation vs. safe-haven) | Negative: inflation dominates |
| USD strengthening during crisis | Moderate gold headwind | Amplified gold headwind |
| Central bank buying cycle | Broadly supportive | Neutral: already at elevated levels |
The divergence from historical norms is significant. It reflects a market that entered the Hormuz crisis with specific vulnerabilities: a technically extended gold price following record central bank gold demand in 2025, pre-existing weakness in speculative positioning on COMEX, and a Federal Reserve already navigating a structurally elevated inflation environment.
COMEX Positioning and the Pre-Existing Weakness Dynamic
Why Institutional Selling Preceded the Geopolitical Trigger
One of the lesser-appreciated aspects of the Hormuz tensions gold price drop is that institutional selling pressure had already been building before Iran's closure declaration. COMEX speculative net long positions fell by 1,964 contracts to 114,854 in the week ending July 7, a reduction that preceded the escalation.
This matters analytically for several reasons:
- It indicates that the market's primary concern was already macroeconomic rather than geopolitical in the days leading up to the shock
- It means the Hormuz-driven selloff encountered a market that was technically vulnerable, with limited speculative buying power available to absorb the downward pressure
- It suggests that much of the momentum-driven long positioning had already been unwound before oil prices spiked
- A stabilisation or recovery in speculative net longs would be an early indicator that institutional sentiment is shifting, potentially preceding a price recovery
Analytical Note: When speculative positioning weakens ahead of a geopolitical event rather than strengthening, it typically signals that macroeconomic concerns dominate geopolitical ones in the market's current framework. This is a contrarian signal worth monitoring carefully.
Gold's Position Within the World Gold Council's Valuation Framework
Mapping Bullion Against Structural Price Targets
The World Gold Council's Gold Valuation Framework provides a structured approach to understanding gold's fair value range under specific macroeconomic conditions. Juan Carlos Artigas, Regional CEO Americas and Global Head of Research at the World Gold Council, has emphasised that gold functions as a genuinely global asset whose price integrates macroeconomic and geopolitical developments across multiple markets simultaneously. He has also noted that gold has repeatedly attracted long-term buyers near the US$4,000/oz level, suggesting structural demand exists at that threshold.
The current framework assumptions and their market readings are as follows:
| Scenario Variable | Baseline Assumption | Current Reading |
|---|---|---|
| Fed rate hike timing | At least one hike by October 2026 | September probability: 72% |
| US inflation peak | ~3.9% in Q2 2026 | CPI data pending |
| Gold price range | US$3,895 to US$4,305 | $4,060.49 (lower half of range) |
| Distance from floor | $165 above US$3,895 | Approaching lower band |
| Distance from ceiling | $244 below US$4,305 | Significant upside required |
Gold was trading at $4,060.49, just $60.49 above the critical US$4,000/oz threshold that the World Gold Council identifies as a potential trigger for additional institutional selling. August gold futures reinforced the pattern, declining 1% to $4,069.50.
The US$4,500+ Scenario: What the Market Needs to See
For gold to break decisively above US$4,500/oz, the World Gold Council's framework requires a set of conditions that are currently absent. Furthermore, the interplay of gold and bond dynamics adds another layer of complexity to any recovery thesis. The required conditions include:
- A strong signal of global economic deceleration
- A meaningful reduction in Federal Reserve rate hike expectations
- Weakening of the US dollar index from current levels
- A reversal of energy-driven inflation pressures, potentially through a diplomatic resolution in the Gulf
None of these conditions are present in the immediate term, which explains why the upper end of the valuation range remains out of reach despite elevated geopolitical tension.
Gold Producer Margins at the US$4,000 Threshold
The Cost Structure Divide Becomes Increasingly Critical
As gold approaches the lower end of its valuation framework, the divergence between low-cost and high-cost producers becomes a material investment consideration. The all-in sustaining cost (AISC) structure across the global gold mining industry is far from uniform:
- Producers with AISC above US$3,900/oz face severely compressed margins if gold tests the US$4,000 support level
- A sustained breach of US$4,000/oz would effectively eliminate profitability for the highest-cost quartile of global gold production
- Mid-tier and major producers with AISC below US$2,500/oz retain substantial buffers at current price levels, but their equity valuations are sensitive to where gold settles relative to the WGC range
- The cost structure divergence means that sector-wide stress at the margin does not necessarily imply distress for well-positioned low-cost operators
This dynamic is particularly relevant given that gold's peak-to-trough decline reached 26%, falling from a record high of approximately US$5,405/oz to approximately US$4,002/oz before finding support. Average gold price volatility reached 30% during the first half of 2026, creating a challenging environment for capital allocation across the producer spectrum.
The next major ASX story will hit our subscribers first
The Key Catalysts Shaping Gold's Next Directional Move
Four Data Points Markets Are Watching
The near-term trajectory for gold is highly data-dependent. The following catalysts carry the most weight in determining whether bullion holds the US$4,000 level or recovers toward the upper end of its target range:
- US June CPI Report: A reading above 3.9% materially increases the risk of gold testing the lower end of its US$3,895 to US$4,305 range. A reading at or below 3.5% would provide a meaningful recovery catalyst.
- Fed Chair Kevin Warsh Congressional Testimony: Any acceleration in rate hike signalling would amplify downward pressure, while dovish commentary could offer temporary support.
- US PPI and Retail Sales Data: PPI serves as a leading indicator for consumer inflation trends. Strong retail sales would reinforce the tightening case.
- Fed Vice Chair Michelle Bowman and Governor Christopher Waller Remarks: Both officials carry significant market weight. Hawkish signals from either would likely push September rate hike odds above the current 72%.
Scenario Analysis: Gold Under Different CPI Outcomes
| CPI Outcome | Fed Response Probability | Likely Gold Range | Key Risk |
|---|---|---|---|
| CPI at or above 4.0% | September hike near-certain | US$3,895 to US$4,000 | Tests critical support |
| CPI between 3.5% and 3.9% | September hike likely at ~72% | US$4,000 to US$4,150 | Consolidation continues |
| CPI at or below 3.5% | September hike odds fall | US$4,150 to US$4,305 | Recovery toward range ceiling |
| CPI at or below 3.0% | Rate cut expectations return | US$4,305 to US$4,500+ | Breakout scenario |
Frequently Asked Questions: Hormuz Tensions and Gold Price Dynamics
Why did gold fall when the Strait of Hormuz was closed?
The closure pushed oil prices sharply higher, which elevated inflation expectations and increased the probability of Federal Reserve rate hikes. Because gold is a non-yielding asset, higher real interest rates reduce its attractiveness relative to interest-bearing instruments. Concurrent dollar strength made gold more expensive for international buyers, further suppressing demand. Analysts tracking the recession impact on gold have consequently highlighted this episode as a reminder that not all macro shocks favour bullion equally.
What makes the US$4,000/oz level structurally significant?
The World Gold Council's Gold Valuation Framework identifies this level as a threshold below which sustained trading could activate additional institutional selling. It functions as both a technical and fundamental reference point for the market.
How does a stronger US dollar affect gold prices mechanically?
Gold is denominated in US dollars. When the dollar strengthens, gold becomes proportionally more expensive for buyers transacting in other currencies, which reduces international demand. This mechanical relationship makes dollar strength one of the most reliable short-term headwinds for bullion prices.
Could gold still rally despite the current Hormuz-driven headwinds?
Yes, under specific conditions. If June CPI surprises to the downside, or if a diplomatic resolution reduces oil prices and moderates inflation expectations, rate hike probabilities could fall and gold could recover toward the upper end of its target range. The US$4,500+ scenario remains achievable but requires a fundamental shift in the macroeconomic data sequence.
What the Hormuz Episode Reveals About Modern Gold Market Dynamics
The 2026 Hormuz tensions gold price drop is more than a counterintuitive data point. It exposes a structural evolution in how gold markets process geopolitical risk. In an environment where central banks are already navigating stubborn inflation, where gold has been technically extended after a 70% price surge driven by record central bank purchases in 2025, and where speculative positioning was already deteriorating, the safe-haven narrative requires a far more specific set of conditions to dominate.
The broader lesson is that the transmission channel of a crisis matters more than the crisis itself. Energy shocks inflate. Financial shocks shelter. Investors who fail to distinguish between these two pathways will consistently be surprised by gold's behaviour in a world where the two frequently occur simultaneously.
Disclaimer: This article is for informational purposes only and does not constitute financial advice. All price levels, probability figures, and valuation ranges referenced reflect conditions and data as of July 2026. Past performance and historical patterns do not guarantee future outcomes. Readers should conduct independent research and consult qualified financial advisors before making investment decisions.
Want to Stay Ahead of Significant ASX Mineral Discoveries Before the Broader Market Does?
Discovery Alert's proprietary Discovery IQ model delivers real-time alerts on high-potential ASX mineral discoveries, turning complex data across more than 30 commodities into clear, actionable insights — explore the historic returns major discoveries have generated and begin your 14-day free trial at Discovery Alert to position yourself ahead of the market.