July 13, 2026
Why Hormuz Transits Sparse After US-Iran Clashes Are Reshaping Global Energy Markets
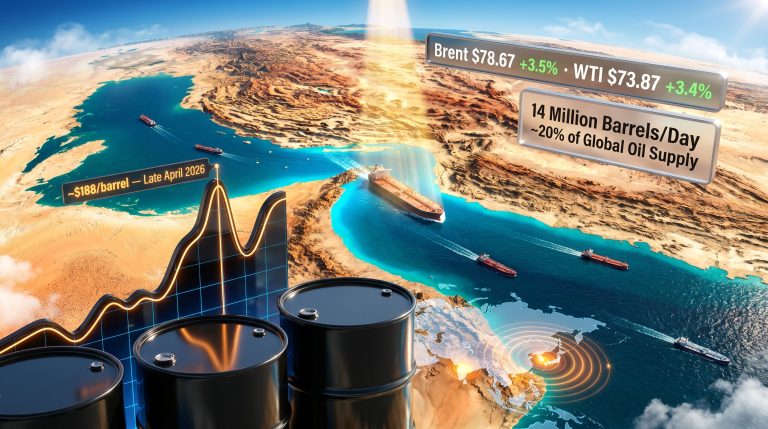
Global energy markets have always carried embedded geopolitical risk, but most of that risk has historically been diffuse, spread across dozens of production regions, transit corridors, and regulatory environments. The Strait of Hormuz is the exception to that rule. It is the single point in the global hydrocarbon supply chain where geography has created a chokepoint so narrow and so consequential that even a partial disruption does not merely inconvenience markets — it restructures them.
Understanding why Hormuz transits sparse after US-Iran clashes carry such outsized implications requires looking at the strait not as a news event but as a systemic vulnerability. It has now been repeatedly stress-tested, partially failed, and partially recovered within the span of a single conflict cycle. Furthermore, the oil market disruption created by this chokepoint extends far beyond the region itself.
When big ASX news breaks, our subscribers know first
Why the Strait of Hormuz Remains the World's Most Critical Energy Chokepoint
The Strait of Hormuz sits between the Persian Gulf and the Gulf of Oman, narrowing to approximately 33 kilometres at its most constrained navigable point. Through this passage moves crude oil, liquefied natural gas, liquefied petroleum gas, refined petroleum products, and petrochemical feedstocks originating from Saudi Arabia, Iraq, Kuwait, Iran, the UAE, and Qatar.
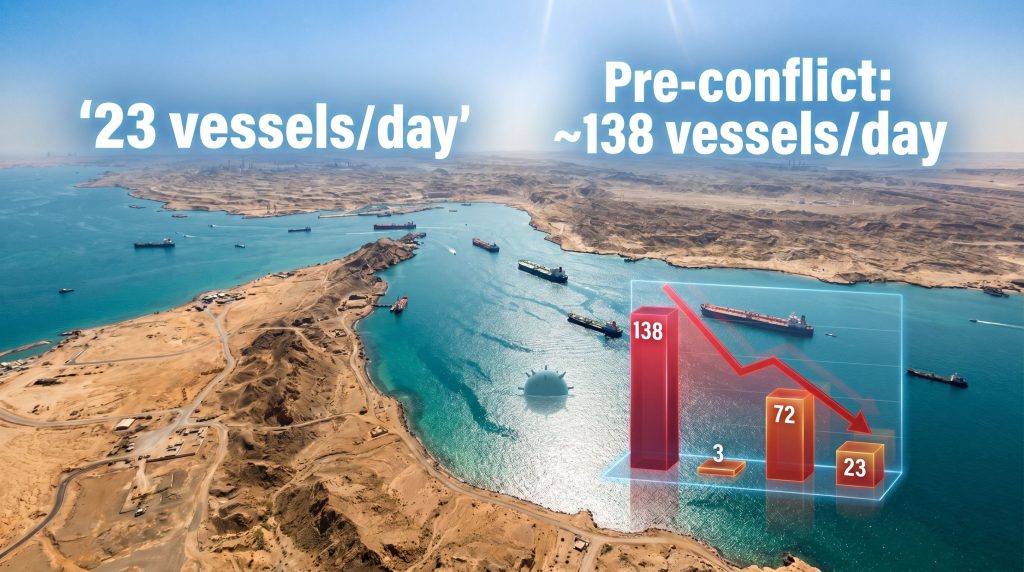
Before the current conflict began, approximately 138 vessels per day transited the strait under normal operating conditions. Roughly 33 of those were oil tankers, carrying a volume of crude that represents a substantial share of global seaborne oil trade. No other single maritime passage comes close to concentrating this level of energy throughput in such a geographically constrained corridor.
The economic logic of alternatives is deeply unfavourable. Routing around the strait requires either:
- Overland pipeline infrastructure that maxes out well below current export volumes
- Significantly longer voyage times through the Strait of Malacca or around the Cape of Good Hope
- Dependence on Red Sea terminal capacity that itself carries separate geopolitical exposure
Key Context: The Strait of Hormuz is not simply a shipping lane. It is the arterial pressure point through which a structurally irreplaceable share of global hydrocarbon supply must travel. Disruption does not merely delay shipments; it reprices global energy markets at the source.
How Severe Is the Hormuz Traffic Collapse? A Data-Driven Assessment
Quantifying the Decline: Transit Numbers Before and After Escalation
The data tells a story of exceptional fragility. Transit volumes have not declined gradually — they have collapsed in discrete steps corresponding directly to military escalation events.
| Metric | Pre-Conflict Baseline | Post-Escalation Low | Partial Recovery | Post-Renewed Clashes |
|---|---|---|---|---|
| Daily vessel transits (all types) | ~138 vessels/day | 3 vessels (20 Apr) | 72 vessels (24 Jun) | 23 vessels (8 Jul) |
| Daily oil tanker crossings | ~33 tankers/day | Near zero | Partial recovery | 13 crossings (8 Jul) |
| Overnight commercial crossings | Multiple daily | Near zero | Moderate | ~5 ships overnight |
| Outbound oil tankers | Multiple daily | Near zero | Partial | 0 overnight |
The collapse from 72 vessels per day on 24 June to just 23 vessels on 8 July, following renewed US-Iran military exchanges, illustrates how rapidly partial recovery can unravel. The overnight figure of zero outbound oil tankers is particularly significant for supply chains operating on tight just-in-time delivery schedules. Consequently, crude oil price trends have reflected these volatile swings in real time.
The "Dark Shipping" Problem: Why AIS Data Understates True Risk
Automatic Identification System tracking is the primary tool used globally to monitor vessel movements and measure strait traffic. AIS transponders broadcast a vessel's position, heading, and speed, enabling port authorities, insurers, and market analysts to construct real-time traffic pictures.
In conflict environments, however, AIS data becomes structurally unreliable. Vessels operating in high-threat zones routinely switch off transponders to avoid detection, a practice known as "dark shipping." When visible AIS data shows near-zero traffic, the actual number of vessels attempting transit may be higher, but this creates its own compounding problem.
Dark shipping introduces several layers of compounded risk:
- Navigational hazard increases dramatically when multiple vessels operate without broadcasting position in a narrow, mine-threatened waterway
- The commercial insurance market treats dark transit as a material risk factor, triggering premium escalation or coverage withdrawal
- Market analysts lose their primary real-time data source, amplifying uncertainty in forward price curves
- Approximately 870 vessels were reported holding positions within the Gulf as of early July, indicating systemic operator caution rather than transit attempts
The paradox is precise: dark shipping data showing reduced traffic actually signals greater risk, not normalisation. According to recent reports, no ships passed through Hormuz in the last 48 hours as US-Iran clashes raised security risks to critical levels.
What Is Driving the Collapse in Hormuz Transits?
The Multi-Vector Threat Environment Facing Commercial Shipping
The current threat environment is unusually complex because it involves simultaneous hazard categories that independently would each be sufficient to suppress commercial shipping.
- Active strike operations: US forces completed a third round of strikes against Iranian military targets on 11 July, hitting approximately 140 Iranian military installations, including missile and drone sites, naval assets, ammunition storage facilities, communication networks, and coastal surveillance infrastructure
- Iranian anti-shipping attacks: Three commercial tankers were attacked during the current escalation cycle. The Cyprus-flagged container vessel GFS Galaxy was struck nine nautical miles east of the Omani coast while transiting via the southern Hormuz route near Oman, forcing a full crew evacuation
- Mine deployment and boarding operations: Iranian forces have reportedly deployed sea mines within the strait corridor and conducted merchant vessel boardings, creating unpredictable hazard zones that cannot be reliably mapped or avoided
- Duqm port strikes: Iran's aerospace forces claimed strikes on logistics and refuelling infrastructure at Oman's Duqm port, a strategically significant facility located well south of the strait itself, suggesting a deliberate effort to degrade the regional maritime support ecosystem
- Musandam drone strikes: Oman's state news agency confirmed drone strikes across Musandam governorate, the country's northernmost territory, which sits directly adjacent to the strait's narrowest point
The Conflicting Closure Narratives: Who Controls the Strait?
Iran's Revolutionary Guard Corps declared the strait closed until further notice via the IRGC-affiliated Tasnim news agency, stating that no vessels would be permitted passage until US military interventions in the region ceased. US Central Command responded directly, asserting that the strait remains open to all vessels seeking lawful transit through the international waterway.
Both statements contain operational truth simultaneously. The strait is legally open under international maritime law. It is also practically inaccessible to most commercial operators given active attack risk, mine threats, and insurance withdrawal. Shipping through the Strait of Hormuz has slowed sharply after fresh US-Iran hostilities, a development that has sent ripples across global commodity markets.
Strategic Insight: When two major military actors issue contradictory operational declarations about the same waterway, the commercial shipping industry does not wait for legal resolution. It routes around the risk entirely, making the traffic collapse self-reinforcing regardless of which party holds the stronger legal position.
How Does This Escalation Fit Within the Broader US-Iran Conflict Timeline?
Key Escalation Milestones and Their Market Impact
The current situation reflects a distinct pattern of escalation, partial stabilisation, and renewed escalation that has emerged across the conflict's five-month trajectory.
- 28 February: Conflict onset; initial outbreak of US-Iran hostilities
- 20 April: Transit volumes hit a recorded floor of just 3 vessels per day, the lowest point since the conflict began
- 18 June: US-Iran interim peace deal; partial Hormuz reopening initiated
- 24 June: Transit volumes recover toward 72 vessels per day following ceasefire
- Early July: US sanctions waiver for Iranian oil exports revoked; renewed military exchanges begin
- 8 July: Transit volumes collapse again to 23 vessels; oil tanker crossings fall to 13; overnight outbound tanker count reaches zero
- 11–12 July: Third round of US strikes against approximately 140 Iranian military targets; IRGC declares indefinite closure
The Ceasefire-to-Conflict Cycle: A Structural Pattern Emerging
The June 18 interim peace deal demonstrated that partial commercial normalisation is achievable within weeks of a ceasefire agreement. Transit volumes recovered from near zero to 72 vessels per day in approximately six days, an encouraging rate of recovery.
However, the revocation of Iran's oil sanctions waiver functioned as a direct economic trigger for renewed hostilities. This establishes a critical structural insight: the economic terms of any ceasefire are as operationally significant as the military terms. When sanctions relief was removed, Iran's incentive structure for maintaining the ceasefire deteriorated rapidly.
The implication for long-term energy security planning is that Hormuz disruption cannot be treated as a binary open or closed scenario. The emerging pattern is one of recurring partial closures driven by the interaction between military operations and economic pressure mechanisms.
What Are the Consequences for OPEC+ Production and Gulf Crude Exports?
OPEC+ Output: Partial Recovery Now Under Renewed Threat
OPEC+ crude production staged a meaningful recovery in June following the interim ceasefire, rising by 2.25 million barrels per day on the month to 31.95 million b/d, the highest level recorded since the conflict began on 28 February. However, output remained approximately 7.2 million b/d below pre-war levels, according to Argus estimates.
| Producer | Pre-War Output (est.) | June Production | Month-on-Month Change | Gap to Pre-War Level |
|---|---|---|---|---|
| Saudi Arabia | ~10.88 mn b/d | 7.09 mn b/d | +520,000 b/d | -3.79 mn b/d |
| Iraq | ~3.75 mn b/d | 2.15 mn b/d | +600,000 b/d | -1.60 mn b/d |
| Kuwait | ~2.80 mn b/d | 1.52 mn b/d | +940,000 b/d | -1.28 mn b/d |
| Iran | ~2.65 mn b/d | 2.75 mn b/d | +100,000 b/d | Sanctions waiver revoked |
| UAE | ~2.11 mn b/d | 3.82 mn b/d (record) | +1.71 mn b/d | +1.71 mn b/d above pre-war |
| Total OPEC+ 17 | ~39.15 mn b/d (est.) | 26.75 mn b/d | +2.12 mn b/d | -7.14 mn b/d vs. target |
The June recovery was driven almost entirely by the five Mideast Gulf members able to ramp up exports through Hormuz during the ceasefire window. Saudi Arabia, Iraq, Kuwait, Iran, and Bahrain collectively increased production by 2.17 million b/d during that period. In addition, OPEC's global influence over price management has become increasingly constrained by the physical realities of transit disruption.
The UAE Divergence: A Market Share Variable to Watch
The most structurally significant development within OPEC+ during this period is the UAE's extraordinary production expansion. Having exited OPEC, the UAE raised output to a record 3.82 million b/d in June, approximately 360,000 b/d above the quota it would have held as a continuing alliance member.
This is not simply opportunistic volume growth. The UAE's position reflects a deliberate strategic calculation: capturing market share at precisely the moment when its Gulf competitors face Hormuz-related export constraints. Saudi Arabia, Iraq, and Kuwait collectively produce far below capacity, while the UAE's export infrastructure and sovereign decision-making independence allows it to run near maximum throughput.
The long-term consequence is significant. When and if Hormuz fully reopens, the UAE's elevated production baseline will complicate OPEC+ production coordination considerably. A UAE producing 3.82 million b/d sets a high floor from which any return to quota compliance requires politically difficult cuts.
Russia's Compounding Output Constraint
Russia's production held at approximately 9.0 million b/d in June, roughly 760,000 b/d below its production target, reflecting the ongoing impact of Ukrainian infrastructure strikes on Russian energy facilities. This simultaneous constraint on two of the world's largest oil exporters — Russia and the Gulf OPEC members — creates a compounding supply deficit that no single alternative producer can offset.
Venezuela's production recovery to approximately 1.2 million b/d in June represents a marginal offset, but it is orders of magnitude smaller than the combined Gulf and Russian deficit.
The next major ASX story will hit our subscribers first
Three Strategic Scenarios for Hormuz: What Happens Next?
Scenario 1: Prolonged Stalemate (Base Case Risk)
- Traffic remains suppressed in the 15 to 30 vessels per day range for an extended period
- Commercial operators institutionalise Hormuz avoidance into freight pricing and routing protocols
- Gulf producers maintain output curtailments of 6 to 8 million b/d below pre-war levels
- Global oil prices remain structurally elevated; LNG spot markets face acute tightness
- War-risk insurance premiums escalate to levels that render most commercial transits economically unviable without extraordinary cargo value
Scenario 2: Rapid Diplomatic Resolution (Optimistic Case)
- A second, more durable ceasefire restores partial transit confidence
- Traffic recovers toward 60 to 80 vessels per day within four to six weeks of agreement
- Saudi Arabia and Iraq accelerate output restoration, pulling total OPEC+ production back toward pre-war levels
- The UAE's record production creates meaningful downward price pressure as supply normalises
- Structural risk premiums remain embedded in energy forward curves even after physical flows recover
Scenario 3: Full Strait Closure and Escalation (Tail Risk)
- Sustained Iranian mining or anti-shipping campaigns render Hormuz operationally inaccessible across all vessel categories
- Global oil supply faces a structural near-term deficit of 15 to 20 million b/d
- Alternative routing capacity through the Saudi Petroline, Strait of Malacca, and Cape of Good Hope is tested beyond practical limits
- IEA member states coordinate emergency Strategic Petroleum Reserve releases from a combined reserve base of approximately 1.5 billion barrels
- Asian energy import flows begin a structural long-term redirection that accelerates renewable and nuclear investment across Japan, South Korea, and India
Risk Calibration Note: The probability-weighted outcome currently sits closest to Scenario 1, with episodic movement toward Scenario 2 dependent on diplomatic re-engagement. Scenario 3 represents a low-probability, extreme-consequence tail risk that energy security planners must explicitly model regardless of its current likelihood.
What Alternative Routes Exist If Hormuz Remains Inaccessible?
Mapping the Bypass Options: Capacity, Cost, and Limitations
- Saudi East-West Pipeline (Petroline): Capacity of approximately 5 million b/d; connects Eastern Province fields to the Red Sea export terminal at Yanbu; the most viable near-term bypass for Saudi crude, but insufficient to carry total Gulf volumes
- Iraq-Turkey Pipeline: Operational capacity constrained by conflict damage and longstanding political disputes; limited near-term contribution to bypass capacity
- Strait of Malacca rerouting: Adds 7 to 14 days of voyage time for Asian-bound cargoes; tanker fleet utilisation tightens sharply and freight rates spike
- Cape of Good Hope routing: Adds approximately 6,000 nautical miles for Europe-bound cargoes, with significant cost and scheduling implications for refinery throughput planning
- Strategic Petroleum Reserves: IEA combined reserves of approximately 1.5 billion barrels provide a buffer, but coordinated release mechanisms take time to activate and cannot substitute for lost production indefinitely
The LNG-Specific Problem: No Viable Alternative Route
Crude oil has imperfect but real bypass options. LNG does not. Qatar, the world's largest LNG exporter, has no pipeline alternative to Hormuz. Furthermore, the LNG supply outlook for European and Asian buyers is increasingly precarious given the absence of viable rerouting options for Qatari cargoes.
LNG carrier rerouting is disproportionately costly compared to crude tanker diversions, and the physical constraints of LNG terminal infrastructure mean that alternative supply sources cannot scale quickly enough to substitute for Qatari volumes. US LNG export capacity represents a partial offset for European buyers, but is insufficient to bridge the full Qatari gap at current capacity levels.
How Are Energy Markets Pricing the Hormuz Risk Premium?
The Insurance Market as a Leading Indicator
War-risk insurance premiums have emerged as one of the most reliable real-time proxies for commercial operator risk assessment during the current conflict. As premium rates escalate, the effective delivered cost of any cargo transiting Hormuz rises regardless of the underlying commodity price.
At extreme premium levels, commercially rational operators will hold vessels at anchor rather than accept the insurance cost, which is precisely the dynamic visible in the 870 vessels reported holding within the Gulf as of early July. The UK Maritime Trade Operations authority plays a central role in aggregating and disseminating maritime security advisories for the region.
Asymmetric Price Response Patterns
A consistent and important pattern has emerged across the current conflict cycle: crude oil benchmark volatility responds asymmetrically to escalation versus de-escalation. Escalation triggers sharper and faster upward price moves than de-escalation triggers equivalent recoveries. This reflects the structural difficulty of verifying that threat conditions have genuinely normalised, as opposed to merely pausing before the next escalation phase.
The oil price movements associated with each escalation event have reinforced this asymmetry, with LNG spot prices in Asian markets exhibiting an even more pronounced response given the absence of viable alternative supply routes for buyers in Japan, South Korea, and China.
The Broader Geopolitical Architecture: What Sustains This Conflict?
Structural Drivers Beyond the Immediate Military Exchange
Several structural factors extend beyond the immediate military exchange and have material implications for the duration and intensity of the disruption:
- The revocation of Iran's oil sanctions waiver removed the primary economic incentive Tehran had to maintain ceasefire compliance, functioning as a direct trigger for renewed hostilities
- Kuwait's position as an active theatre of conflict, including border checkpoint attacks and offshore oil facility targeting, introduces a second Gulf producer vulnerability beyond the strait itself
- Oman's historically neutral role has been compromised by Iranian strikes on Duqm port and Musandam governorate, removing a key diplomatic intermediary from the negotiating environment
- The simultaneous continuation of the Ukraine conflict and its repeated infrastructure strike campaigns against Russian energy facilities creates a compounding global supply constraint that amplifies the market impact of every disruption involving Hormuz transits sparse after US-Iran clashes
- Venezuela's parallel production recovery trajectory provides only marginal global supply relief
The OPEC+ Production Ceiling Paradox
Seven core OPEC+ members — Saudi Arabia, Russia, Iraq, Kuwait, Kazakhstan, Algeria, and Oman — agreed on 5 July to a further 188,000 b/d collective production ceiling increase for August. This leaves just 188,000 b/d of voluntary cuts remaining in the alliance framework, which could theoretically be fully unwound in September.
The paradox embedded in this decision is stark: OPEC+ is raising production targets at precisely the moment when its members' physical export capacity is most severely constrained by conflict. The targets have limited market impact when the bottleneck is not production capacity but export infrastructure access.
If Hormuz fully reopens and a durable ceasefire is achieved, the combination of pent-up Gulf production capacity, the UAE's record output baseline, and the near-complete exhaustion of OPEC+ voluntary cuts creates a structural risk of supply overshoot and rapid price normalisation. That scenario would represent a sharp reversal of current elevated price conditions.
Frequently Asked Questions: Hormuz Transits and the US-Iran Conflict
What is the Strait of Hormuz and why does it matter for global energy?
The Strait of Hormuz is a narrow maritime passage between the Persian Gulf and the Gulf of Oman, approximately 33 kilometres wide at its narrowest navigable point. It serves as the primary export corridor for crude oil, LNG, and refined products from Saudi Arabia, Iraq, Kuwait, Iran, the UAE, and Qatar, collectively representing a substantial share of global seaborne hydrocarbon trade.
How many ships are currently transiting the Strait of Hormuz?
As of early July 2026, transit volumes had fallen sharply to approximately 23 vessels per day following renewed US-Iran military exchanges, a steep decline from the pre-conflict baseline of approximately 138 vessels per day and well below the partial recovery of 72 vessels recorded on 24 June following the interim ceasefire.
Has Iran actually closed the Strait of Hormuz?
Iran's Revolutionary Guard Corps declared the strait closed until further notice following US military strikes. US Central Command disputed this, asserting the waterway remains open to lawful transit. In practice, commercial traffic has collapsed due to active conflict conditions, mine threats, and vessel attack risk, creating a de facto operational closure even without internationally recognised legal closure.
What happens to oil prices if Hormuz stays closed?
A sustained closure would remove approximately 15 to 20 million b/d of supply from accessible global markets in the near term, triggering severe upward price pressure on crude benchmarks. The scale of the impact depends on the speed and volume of strategic petroleum reserve releases, alternative routing capacity utilisation, and the duration of the disruption.
Which countries are most exposed to a Hormuz closure?
Asian economies, particularly Japan, South Korea, China, and India, are disproportionately exposed given their heavy reliance on Gulf crude imports. European LNG buyers face acute risk given Qatar's absence of viable export alternatives to Hormuz. Gulf producers including Saudi Arabia, Iraq, and Kuwait face severe output curtailment as their primary export infrastructure depends on Hormuz access.
What is dark shipping and why does it complicate the situation?
Dark shipping refers to vessels disabling AIS transponders to avoid detection during transit. Whilst this allows some vessels to attempt passage without broadcasting position, it removes the market's ability to accurately measure traffic volumes and introduces additional collision and navigational risk in a mine-threatened, conflict-active waterway.
Key Takeaways: What the Hormuz Transit Data Tells Us About Global Energy Security
The data emerging from the current US-Iran conflict establishes several structural conclusions that extend well beyond the immediate crisis:
- Transit volumes at the Strait of Hormuz can collapse from 138 vessels per day to near zero within weeks of escalation, demonstrating extreme system fragility
- The June 2026 ceasefire-driven recovery proved rapid but fragile, reversing sharply upon renewed hostilities and establishing a dangerous escalation-recovery-escalation cycle
- AIS dark shipping data and the 870 vessels holding in Gulf waters signal rational commercial risk avoidance that collectively amplifies supply disruption regardless of individual vessel decisions
- The UAE's production expansion to 3.82 million b/d, approximately 360,000 b/d above its former OPEC quota level, represents a structural market share shift that will complicate post-conflict OPEC+ coordination considerably
- The near-exhaustion of OPEC+ voluntary production cuts, with just 188,000 b/d remaining, removes a key market stabilisation lever precisely when physical supply disruptions are most acute
- Energy security planners must model Hormuz disruption not as an exceptional tail risk but as a recurring operational scenario requiring durable contingency infrastructure investment
This article contains forward-looking scenarios and analysis based on current available data. Energy market conditions, conflict dynamics, and production figures are subject to rapid change. Nothing in this article constitutes investment advice. Readers should conduct independent due diligence before making any financial or commercial decisions based on the information presented here.
For ongoing commodity market intelligence covering crude oil, LNG, freight, and related sectors, Argus Media provides detailed market reporting at argusmedia.com.
Want to Stay Ahead of the Commodity Disruptions Reshaping ASX Mining Opportunities?
When geopolitical shocks like the Hormuz crisis rattle global energy and commodity markets, the ripple effects can create significant opportunities across ASX-listed resource and exploration stocks — and Discovery Alert's proprietary Discovery IQ model scans ASX announcements in real time, instantly alerting subscribers to significant mineral discoveries before the broader market reacts. Explore historic examples of major discoveries and their market returns, then begin your 14-day free trial at Discovery Alert to position yourself ahead of the next major market-moving event.