August 7, 2026
The Chokepoint That Moves the World: Understanding the Strait of Hormuz's Grip on Global Oil Markets
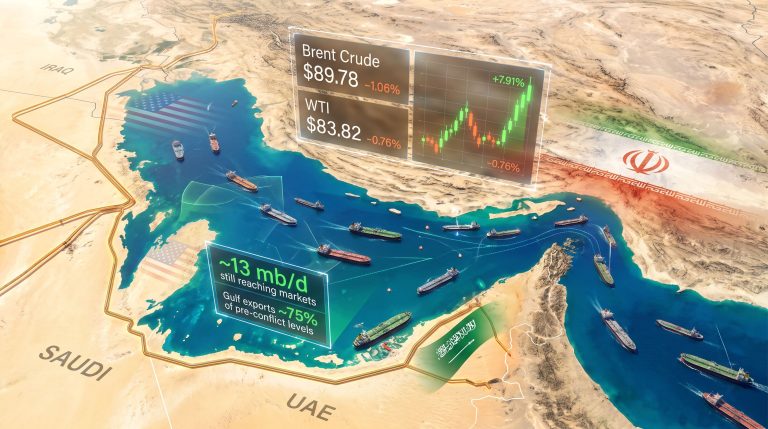
Few geographic features carry as much economic weight as a narrow body of water measuring roughly 33 kilometres at its tightest point. The Strait of Hormuz sits at the intersection of the Persian Gulf and the Gulf of Oman, and as oil prices rise as U.S. and Iran fight for control of Strait of Hormuz, its significance to global energy markets extends far beyond its modest dimensions. When tensions flare in this corridor, oil traders around the world react within minutes, futures markets reprice risk overnight, and energy ministers across Asia convene emergency briefings. The events of July 2026 are the latest and most severe illustration of this dynamic.
When big ASX news breaks, our subscribers know first
The Strait of Hormuz: Geography, Volume, and Why It Cannot Be Bypassed
Why This Waterway Holds the Global Energy System Hostage
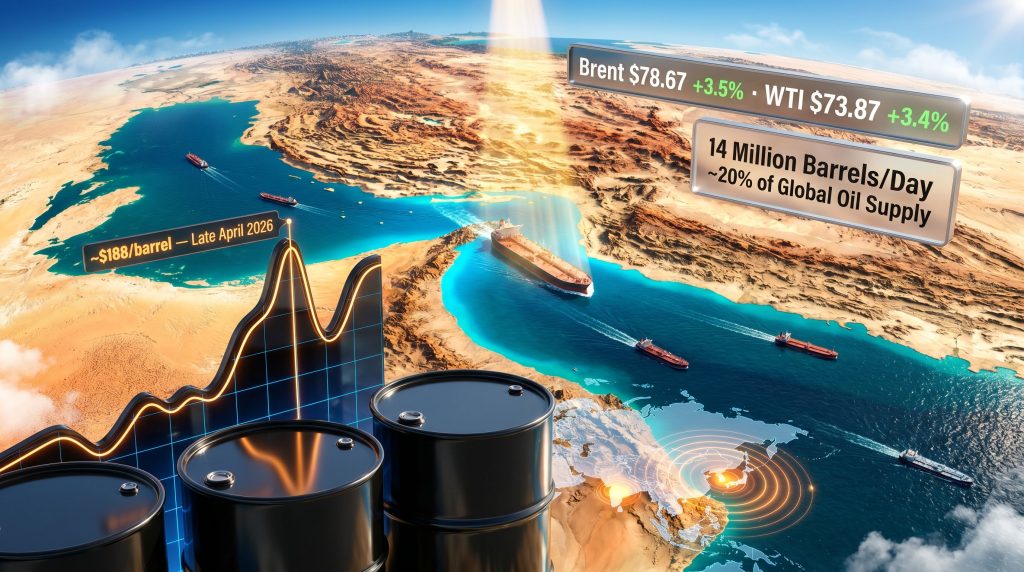
Before the escalation of U.S.-Iran hostilities in early 2026, approximately 20% of the world's total oil supplies transited the Strait of Hormuz on a daily basis. That figure translates to roughly 14 million barrels per day, making it the single most consequential maritime chokepoint in the global energy supply chain.
The strait's geographic design compounds its strategic vulnerability. Two navigable channels, each only about 3 kilometres wide, handle all inbound and outbound tanker traffic. The surrounding coastline is divided between Iranian territory to the north and the UAE and Omani territory to the south, giving Iran extraordinary positional leverage over traffic flows.
"The critical distinction that most casual observers miss is that Hormuz is not simply a trade route. It is a structural dependency embedded into the energy infrastructure of multiple major economies simultaneously."
Alternative Routes: Costly, Constrained, and Insufficient
Several pipeline and shipping alternatives exist, but none can absorb the volume or speed that the strait currently handles:
- The Abqaiq-Yanbu pipeline in Saudi Arabia can transport roughly 5 million barrels per day to Red Sea terminals, covering only a fraction of Hormuz-dependent flows.
- The Iraq-Turkey pipeline operates at significantly reduced capacity due to years of conflict and infrastructure damage.
- Rerouting supertankers around the Cape of Good Hope adds approximately 15 additional days of transit time and significantly elevates shipping insurance premiums.
- Abu Dhabi's Habshan-Fujairah pipeline provides some bypass capacity but is limited in total throughput relative to demand.
No combination of these alternatives can fully substitute for unobstructed Hormuz transit, which is precisely why markets respond so sharply to any credible disruption signal. Understanding crude oil price trends helps contextualise just how sensitive these markets are to chokepoint threats.
From Diplomatic Breakdown to Naval Confrontation: The 2026 Escalation Timeline
The February 2026 Turning Point and Its Market Consequences
The present crisis traces its origins to joint U.S.-Israeli strikes on Iranian territory on February 28, 2026. What followed was a rapid deterioration of the limited diplomatic framework that had previously governed Iranian behaviour in the strait. By early March, the Islamic Revolutionary Guard Corps had begun conducting targeted attacks on commercial vessels transiting Hormuz, sending tanker traffic sharply lower and triggering an immediate repricing of crude oil risk across global markets.
The market impact was historic. By late April 2026, oil market volatility had driven prices to nearly $188 per barrel, a level that represented not just a supply disruption premium but a genuine fear-of-closure scenario being priced into futures contracts. According to Al Jazeera's reporting, prices surged dramatically following U.S. strikes on Iran, reversing earlier declines to pre-war levels.
| Timeline Event | Date | Market Response |
|---|---|---|
| U.S.-Israel strikes on Iran | Feb. 28, 2026 | Initial oil price surge |
| Iran begins attacking ships | Early March 2026 | Hormuz traffic plunges |
| Oil prices peak near $188/barrel | Late April 2026 | Historic commodity spike |
| Late June Brent spike | June 2026 | Brent reaches $97.23 (+6.7%) |
| U.S.-Iran interim peace deal | June 17, 2026 | Temporary market stabilisation |
| Deal announcement causes drop | Post-June 17 | Brent falls to $83.88 (-3.95%) |
| IRGC attacks container ship | July 11, 2026 | Fourth round of U.S. strikes launched |
| Oil prices re-spike | July 12, 2026 | Brent +3.5% to $78.67; WTI +3.4% to $73.87 |
The June 17 Peace Deal: A Framework That Generated New Ambiguity
The interim agreement signed on June 17, 2026 brought temporary relief, producing a 60-day ceasefire framework and unlocking approximately $24 billion in previously frozen Iranian funds. Sanctions were partially suspended, and the prospect of resumed Iranian crude exports entering global supply contributed to the sharp price correction that followed.
Consequently, Brent dropped to $83.88 and WTI fell to $80.96, declines of roughly 3.95% and 4.62% respectively. However, the deal contained a fundamental ambiguity that would prove destabilising. The two sides held contradictory interpretations of how commercial shipping was supposed to transit the strait during the ceasefire period.
Iran insisted that vessels use a northern routing corridor passing through waters it claims as its own territorial jurisdiction. Washington maintained that international maritime law guarantees all vessels the right of transit passage through the strait as an internationally recognised waterway, irrespective of Iranian preferences. The 2026 Strait of Hormuz crisis on Wikipedia provides further background on these competing legal claims.
"The core disagreement is not merely logistical. It is a contest over whether Iran can leverage its geographic position to extract ongoing economic and political concessions from the international community, including tacit acknowledgment of its sovereignty claims over waters that international law designates as an open passage."
What the July 12 Price Spike Actually Tells Markets
Decoding WTI at $73.87 and Brent at $78.67
By 6:03 p.m. ET on July 12, 2026, U.S. crude futures had risen 3.4% to $73.87 per barrel, while Brent crude, the international benchmark, was trading 3.5% higher at $78.67. These moves followed confirmation that the U.S. military had launched a fourth consecutive round of airstrikes against Iran in retaliation for an IRGC attack on a container ship transiting the southern Hormuz corridor.
Iran simultaneously launched retaliatory missile and drone strikes against U.S. military installations in Jordan, Kuwait, Bahrain, and Oman, broadening the geographic footprint of the conflict and elevating regional risk premiums across multiple asset classes.
Risk Premium vs. Confirmed Supply Disruption: A Critical Distinction
One of the most important analytical frameworks for understanding oil price movements during geopolitical crises is the distinction between confirmed supply disruptions and risk premium expansion. The July 12 price movement falls firmly in the second category.
Iranian state media declared that the Revolutionary Guard had closed the strait indefinitely. U.S. Central Command directly disputed this claim, stating that the waterway remained open to all vessels seeking lawful transit. The maritime intelligence firm Windward tracked nine vessels transiting the strait on Saturday, confirming that physical closure had not occurred.
"When geopolitical actors issue contradictory claims over a critical shipping corridor, energy futures markets historically price in the worst-case scenario first and reassess once ground truth becomes clearer. The July 12 movement reflects risk premium expansion, not confirmed supply loss."
Furthermore, the Joint Maritime Information Center, a U.S.-led naval coalition operating out of Bahrain, confirmed that the southern Oman corridor remained technically accessible for both inbound and outbound traffic, though it simultaneously issued an advisory urging mariners to exercise extreme vigilance. Such advisories carry immediate consequences for shipping insurance underwriters, who adjust war risk premiums in real time, effectively raising the cost of every barrel transited through the region.
The Full 2026 Oil Price Cycle: Context Behind the Volatility
Mapping Crude Oil's Extraordinary Trajectory
Understanding the July price movements requires situating them within oil's remarkable 2026 arc. The year has seen current crude oil prices experience one of the most volatile periods in modern commodity market history.
| Price Event | Brent Crude | WTI Crude | Primary Trigger |
|---|---|---|---|
| Late April 2026 peak | ~$188/barrel | Elevated | Full Hormuz disruption fear |
| Late June re-escalation spike | $97.23 (+6.7%) | $94 (+7.8%) | Iran threatens renewed closure |
| Post-deal announcement drop | $83.88 (-3.95%) | $80.96 (-4.62%) | Trump-Iran MoU confirmed |
| July 12 conflict resurgence | $78.67 (+3.5%) | $73.87 (+3.4%) | IRGC attacks; U.S. fourth-strike response |
The partial resumption of Iranian crude exports following the June deal added genuine supply to global markets, contributing to downward price pressure even as geopolitical uncertainty remained elevated. This interplay between supply fundamentals and risk premiums creates a particularly complex trading environment for commodity investors.
Scenario Analysis: What Happens If the Strait Closes Completely?
Modelling the Range of Outcomes
The current situation represents a partial disruption scenario, and markets are pricing in a risk premium above baseline. A more severe outcome would produce substantially different price responses.
| Scenario | Estimated Price Impact | Key Duration Variable |
|---|---|---|
| Partial disruption with vigilance advisories | +3% to +8% risk premium | Days to weeks |
| Sustained shipping attacks on multiple vessels | +15% to +30% above baseline | Weeks to months |
| Full and confirmed closure of the strait | Potential return toward $120-$150 range | Months |
| Diplomatic resolution with Iranian exports resuming | -5% to -15% correction | Immediate to 30 days |
Which Nations Face the Greatest Supply Exposure?
The countries most structurally vulnerable to a full Hormuz closure are concentrated in Asia:
- Japan imports approximately 80-90% of its crude oil through the strait, making it among the most exposed economies globally.
- South Korea maintains similar dependency levels, with Hormuz-routed crude underpinning the majority of its refinery throughput.
- China and India, as the world's two largest crude importers, both rely heavily on Persian Gulf supply chains that transit Hormuz.
- European nations face indirect exposure through LNG import competition and rerouting cost increases that tighten global tanker availability.
The United States, by contrast, benefits from a degree of insulation through its substantial domestic shale production base. However, U.S. refiners with Gulf crude processing configurations and American allies in Asia ensure that Washington remains deeply invested in maintaining freedom of navigation.
The next major ASX story will hit our subscribers first
The Geopolitics of Freedom of Navigation
U.S. Naval Positioning and the Escalation Ladder
The U.S. military's Joint Maritime Information Center plays a central coordinating role in providing real-time security advisories to commercial shipping operators. The escalation pattern visible in 2026 follows a recognisable ladder structure: Iranian provocation, U.S. military response, Iranian counter-strike, and diplomatic messaging running in parallel on both sides.
As oil prices rise as U.S. and Iran fight for control of Strait of Hormuz, the fourth consecutive round of U.S. airstrikes, targeting 140 Iranian targets on Saturday before additional strikes on Sunday, represents a significant escalation of the deterrence posture. Whether this constitutes a deliberate escalation strategy or reflects reactive deterrence will be a central question for energy market analysts in the days ahead.
Iran's persistent demand that commercial vessels use its territorial waters as a transit corridor carries profound implications for international maritime law, specifically the principle of transit passage codified under the United Nations Convention on the Law of the Sea.
"If Iran successfully normalises the expectation that vessels must seek Iranian permission or routing guidance to transit Hormuz, it would represent a fundamental shift in the legal and practical architecture of global energy security, one that no major oil-consuming nation could afford to accept."
OPEC Spare Capacity and Strategic Reserve Deployment as Market Stabilisers
Should conditions deteriorate further, two key mechanisms exist to partially offset supply disruption impacts. First, OPEC's market influence means member nations, particularly Saudi Arabia, retain meaningful spare production capacity that could theoretically be directed to non-Hormuz export terminals. Second, coordinated Strategic Petroleum Reserve releases by International Energy Agency member nations represent a short-term buffer available to governments seeking to calm price spikes.
However, both mechanisms have well-documented limitations. SPR releases are finite and politically complex to coordinate across multiple governments simultaneously. Furthermore, OPEC spare capacity, while real, cannot fully replace 14 million barrels per day of disrupted flow, and not all of Saudi Arabia's export infrastructure bypasses the strait entirely.
Frequently Asked Questions: Oil Prices and the Strait of Hormuz Crisis
Why did oil prices rise on July 12, 2026?
Oil prices rose because the U.S. and Iran exchanged military strikes in and around the Strait of Hormuz, with the IRGC attacking a commercial container ship and the U.S. military responding with its fourth round of airstrikes in a week. Markets priced in elevated supply disruption risk, pushing WTI up 3.4% to $73.87 and Brent up 3.5% to $78.67.
Is the Strait of Hormuz currently open or closed?
As of the July 12, 2026 reporting, the strait remained physically navigable. U.S. Central Command confirmed traffic was flowing, and maritime intelligence tracking confirmed nine vessel transits on Saturday. However, the security situation was classified as severe, with extreme vigilance advisories issued for all mariners.
What was the June 17, 2026 U.S.-Iran interim peace deal?
The deal established a 60-day ceasefire framework, unlocked approximately $24 billion in frozen Iranian assets, and included partial sanctions relief. It temporarily restored shipping traffic through the strait but contained ambiguous language regarding transit routing that has since become the central point of renewed conflict.
Could oil prices return to the $188 per barrel level seen in April 2026?
A return to that level would require a confirmed and sustained full closure of the strait, lasting weeks to months. Current pricing reflects elevated risk premium rather than confirmed supply loss. A full closure scenario is not the base case but cannot be excluded given the ongoing military exchange dynamic. This represents speculative analysis and should not be interpreted as financial advice.
How does Iranian control over Hormuz affect global energy security?
Iran's geographic position gives it asymmetric leverage over global energy flows. Even without fully closing the strait, the threat of interdiction raises insurance costs, rerouting expenses, and risk premiums across global crude markets, effectively functioning as an invisible tax on the international energy system during periods of tension. These are among the key geopolitical oil price drivers that analysts continue to monitor closely.
Key Factors That Will Determine the Path Forward
Three Variables Worth Watching Closely
The trajectory of oil prices rise as U.S. and Iran fight for control of Strait of Hormuz will hinge on several distinct but interrelated variables in the weeks ahead:
- Whether the diplomatic framework holds: Any credible signal of resumed negotiations between Washington and Tehran capable of resolving the transit routing dispute would likely produce a meaningful price correction.
- Physical mine-clearing and safety restoration: Even if a diplomatic agreement is reached, the physical safety of the transit corridor depends on mine-clearing operations and the withdrawal of IRGC naval assets from the waterway, processes that take time and cannot be accelerated through political statements alone.
- Iranian export volumes: The degree to which Iranian crude re-enters global supply under any revised framework will materially affect the fundamental supply-demand balance, independent of the geopolitical risk premium.
The July 2026 oil price movements are best understood not as isolated events but as data points within a sustained volatility cycle driven by the most consequential chokepoint dispute in modern energy market history. The fundamental tension between Iran's sovereignty assertions and the international community's insistence on unimpeded transit rights has no quick resolution pathway, and energy markets will continue pricing that uncertainty until a durable framework emerges.
Disclaimer: This article contains forward-looking analysis, price scenario modelling, and geopolitical assessments that involve significant uncertainty. Nothing contained herein constitutes financial or investment advice. Commodity markets are subject to rapid change, and past price behaviour during geopolitical events is not necessarily indicative of future outcomes.
Want to Stay Ahead of the Next Major Commodity Market Movement?
When geopolitical shocks like the Strait of Hormuz crisis send commodity markets into sharp repricing cycles, the investors best positioned to act are those with real-time intelligence at their fingertips. Discovery Alert's proprietary Discovery IQ model scans ASX announcements the moment they are released, delivering immediate alerts on significant mineral discoveries across more than 30 commodities — turning complex market signals into clear, actionable opportunities. Begin your 14-day free trial today and see why subscribers trust Discovery Alert to keep them ahead of the market, or explore the discoveries page to understand the historic returns that major mineral discoveries have generated.