August 7, 2026
When Supply Reality Overrides Geopolitical Fear
Energy markets have a long memory for false alarms. From the tanker wars of the 1980s to the Libyan civil war disruptions of 2011, history repeatedly shows that oil's initial response to conflict tends to overshoot what physical supply data eventually justifies. Traders who anchor to headlines rather than barrels-in-transit have consistently found themselves on the wrong side of subsequent corrections. The pattern unfolding across Gulf energy markets in mid-2026 is, in many respects, a high-stakes replay of that same dynamic, albeit at a scale and complexity the market has rarely encountered before.
Understanding why oil slips as markets look for cues on Gulf supplies requires moving beyond the headline price and examining the structural mechanics underneath it. Furthermore, the crude oil price trends of recent months offer essential context for interpreting the volatility playing out in real time.
When big ASX news breaks, our subscribers know first
Brent and WTI: What the Numbers Actually Reveal
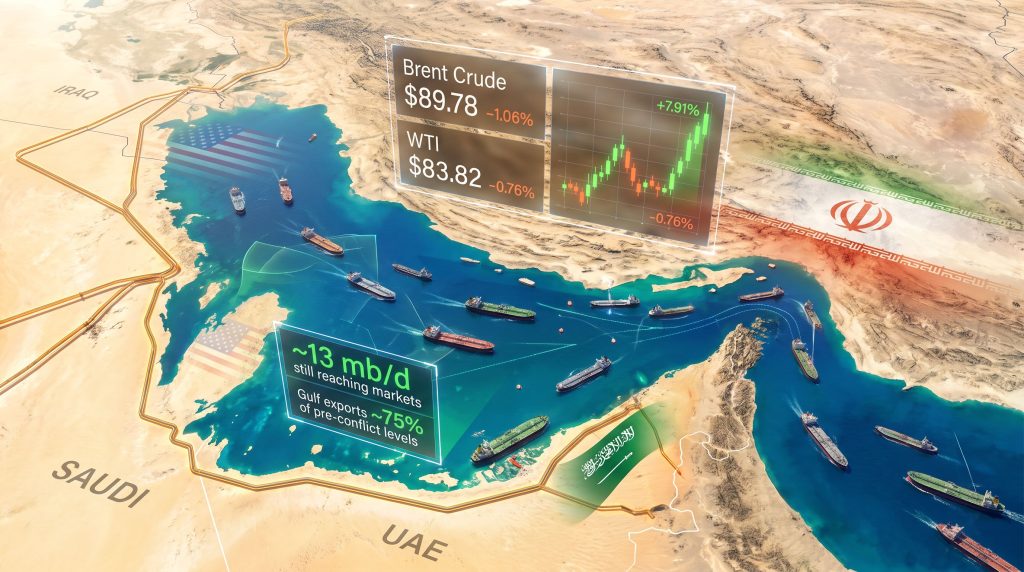
On July 30, 2026, both major crude benchmarks retreated during early Asian and Middle Eastern trading hours. Brent crude futures fell $0.96, or 1.06%, to $89.78 per barrel as of 07:18 a.m. Saudi time, while WTI crude declined $0.64, or 0.76%, to $83.82 per barrel. On the surface, these look like modest, orderly corrections.
The context, however, makes them far more significant.
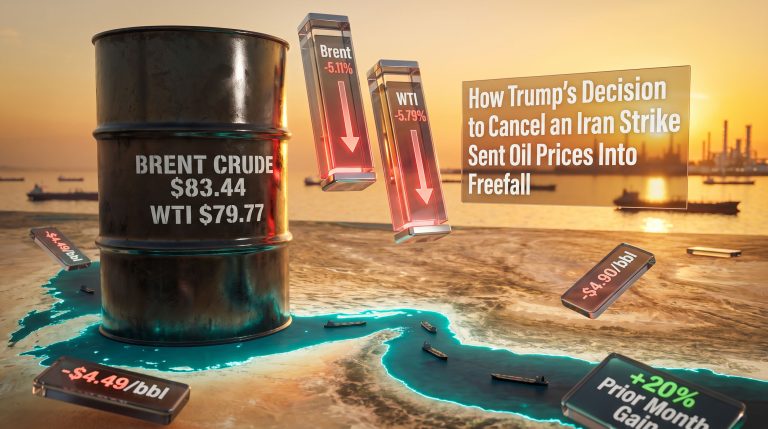
The session's decline followed one of the sharpest single-day rallies recorded during the entire conflict period. Brent had surged 7.91% in the prior session, and WTI had climbed 6.56%, collectively reversing a steep 5% drop from Tuesday when a temporary cessation of hostilities briefly convinced markets that the worst supply disruption scenarios were off the table. Within 48 hours, the market had swung violently in both directions.
| Benchmark | Tuesday | Wednesday | Thursday |
|---|---|---|---|
| Brent Crude | -5.00% (hostility pause) | +7.91% (escalation resumes) | -1.06% (supply reassessment) |
| WTI Crude | ~-5.00% | +6.56% (escalation resumes) | -0.76% (supply reassessment) |
This three-session sequence captures something important about how the market is functioning: it is not trending, it is oscillating. Each piece of geopolitical news triggers a sharp repricing, which is then partially unwound as physical supply intelligence catches up to the emotional response. This kind of oil market volatility has become a defining feature of the current trading environment.
The Strait of Hormuz: Closed in Name, Partially Open in Practice
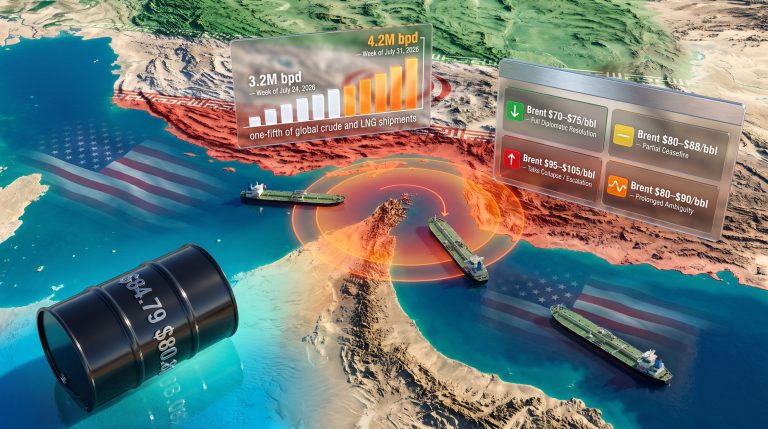
Few chokepoints carry more systemic weight than the Strait of Hormuz. The narrow passage between Iran and Oman historically facilitated the transit of approximately one-fifth of global oil and gas supply, making it arguably the single most consequential maritime corridor in the energy world. Iran's decision to formally close the waterway following the outbreak of the US-Israeli conflict on February 28, 2026 was, in theory, a supply shock of historic proportions.
In practice, the disruption has been severe but not total.
Rystad Energy estimates that approximately 13 million barrels per day of Gulf oil is still reaching global markets through a combination of alternative channels. Gulf export volumes across Saudi Arabia, the UAE, Iraq, and Kuwait have reportedly recovered to roughly 75% of pre-conflict levels in the months since the closure, a figure that has surprised many institutional forecasters who initially modelled far steeper disruptions.
How Oil Is Still Moving: The Alternative Routing Architecture
The mechanics of how Gulf producers are maintaining export flows despite the Hormuz closure deserve closer examination, as they represent a form of logistical improvisation that is actively reshaping long-term supply chain assumptions:
- Overland pipeline diversion: Existing pipeline infrastructure has been repurposed and accelerated to route crude away from maritime chokepoints entirely. Saudi Arabia's East-West Pipeline, which connects the Eastern Province to the Red Sea port of Yanbu, has seen dramatically increased utilisation.
- Tanker network adaptation: Operators with Chinese commercial relationships have modified routing, flagging arrangements, and insurance structures to maintain cargo movement through contested waters. This is not a new phenomenon, but the scale and sophistication of these arrangements have expanded considerably since February 2026.
- Blending and re-export hubs: Regional trading centres are being used to obscure cargo origin and facilitate onward delivery, a practice sometimes described in shipping circles as cargo laundering, though it operates in a legal grey zone that varies by jurisdiction.
- Demand-side moderation as a buffer: Softer-than-expected Chinese crude demand has reduced the severity of the supply shortfall's impact on global price balances. Had Chinese industrial activity been running at full capacity, the market would be significantly tighter.
According to reporting from Petroleum Australia, while overall volumes from the Gulf are reduced, oil continues to reach global markets through multiple channels. Furthermore, as IG Markets analyst Tony Sycamore has noted, the longer this situation persists, the more these alternative routes will progressively erode Iran's leverage over the Strait of Hormuz as a strategic instrument of pressure.
This last point carries a strategic implication that markets are beginning to price in: Iran's chokepoint leverage may be depreciating over time rather than appreciating.
The Bab el-Mandeb Complication
As if one closed chokepoint were not sufficient, Iran-aligned Houthi forces in Yemen imposed a naval blockade on Saudi Arabia in the Red Sea on July 20, 2026, disrupting shipping through the Bab el-Mandeb strait. This secondary waterway connects the Red Sea to the Gulf of Aden and serves as the primary routing for Gulf exports travelling towards Europe via the Suez Canal.
The blockade introduced a second layer of logistical complexity. However, certain tanker operators, particularly those with Chinese commercial ties, have maintained limited cargo flows through the strait, suggesting the blockade is effective but not airtight. The pattern mirrors the Hormuz situation: maximum political signalling, incomplete physical enforcement.
Why Markets Are Discounting Presidential Rhetoric
The single largest price movement in the current trading cycle occurred on Wednesday, July 30, when US President Donald Trump publicly threatened to strike Iran very hard following an Iranian missile attack on a US military base in Jordan. Brent surged nearly 8% within the session. By the following morning, roughly a quarter of that gain had been surrendered.
Commodity analysts have identified a market behavioural pattern that has become increasingly relevant to this conflict: the tendency for markets to initially price in sharp presidential rhetoric as a genuine escalation signal, then partially reverse those gains when the threatened military action does not materialise at the implied scale. This dynamic has been informally labelled the TACO framework by commodity traders, an acronym that has migrated from political commentary into active trading strategy discussions.
The earlier oil price rally driven by Trump-era policy signals followed a broadly similar pattern, where initial price surges were subsequently tempered by market reassessment of actual supply consequences.
Lin Ye, Vice President of Commodity Markets at Rystad Energy, has described the market's operating pattern as one where geopolitical headlines trigger rapid price spikes, but those gains tend to be short-lived once actual supply flow data and concurrent diplomatic activity are factored into trader assessments.
This is not simply cynicism about political credibility. It reflects a rational Bayesian updating process: each time rhetoric does not translate into supply disruption at the feared scale, the market assigns a lower probability to the next rhetorical event causing a sustained price move. The structural ceiling on headline-driven price spikes is being built one unrealised worst-case scenario at a time.
A Conflict Timeline That Explains the Price Swings
| Date | Event | Market Response |
|---|---|---|
| February 28, 2026 | US-Israeli conflict begins; Iran closes Strait of Hormuz | Major supply shock priced in immediately |
| Mid-July 2026 | Gulf exports recover to ~75% of pre-conflict levels | Supply fear premium partially removed |
| July 20, 2026 | Houthi naval blockade imposed on Saudi Arabia in Red Sea | Secondary disruption adds new pressure |
| Tuesday, July 29 | Iran missile strike on US base in Jordan; hostility pause ends | Oil falls ~5% on pause, then reverses |
| Wednesday, July 30 | US and Saudi Arabia conduct joint air strikes on Iran-backed paramilitary forces in Iraq | Brent surges +7.91% |
| Wednesday, July 30 | US Central Command conducts two hours of direct strikes on Iran | WTI surges +6.56% |
| Thursday, July 30 | Markets reassess; supply flow data moderates price | Brent -1.06%, WTI -0.76% |
One development in this timeline warrants particular attention. The joint US-Saudi air campaign against Iran-backed paramilitary forces in Iraq on July 30 marked the first publicly confirmed instance of Saudi Arabia participating in US-led air strikes during the conflict. This is not merely a tactical development. It represents a structural shift in the regional alliance configuration that introduces new variables into long-term Gulf supply risk modelling, particularly regarding the security of Saudi export infrastructure. Consequently, OPEC's market influence over production decisions is becoming increasingly entangled with the broader geopolitical realignment.
The next major ASX story will hit our subscribers first
The IEA Data Gap: Crude vs. Refined Products
A critical and underreported dimension of the current supply picture is the divergence between crude oil flow recovery and the continued suppression of refined product and LPG shipments. The IEA's July 2026 report acknowledged that crude flows through the Strait of Hormuz had recovered strongly from their post-closure lows, yet refined products and liquefied petroleum gas remained well below pre-conflict levels.
This distinction matters enormously for end-use markets. Crude oil can be re-routed through alternative channels with relative flexibility. Refined products, which serve direct consumer and industrial needs, are far more constrained by existing refinery locations, pipeline infrastructure, and product-specific tanker availability. A market focused purely on crude benchmarks like Brent and WTI may be systematically underestimating downstream energy stress. As detailed analysis from Investing.com confirms, the divergence between crude and refined product flows has become one of the most consequential yet under-discussed aspects of the current supply picture.
Scenario Analysis: What Could Break the Current Price Range
| Scenario | Trigger Condition | Price Direction |
|---|---|---|
| Full Hormuz Closure Enforcement | Iran successfully intercepts all alternative routing | Strongly bullish |
| Diplomatic Breakthrough | Ceasefire or partial de-escalation agreement reached | Bearish, rapid war premium reversal |
| Chinese Demand Recovery | Accelerated Chinese industrial activity absorbs available supply | Moderately bullish |
| Alternative Route Normalisation | Producers restore 90%+ of pre-conflict volumes | Bearish, war premium collapses |
| Broader Regional Escalation | Additional state actors enter the conflict | Strongly bullish, sharp risk repricing |
Disclaimer: Scenario projections involve inherent uncertainty and should not be interpreted as financial advice or price forecasts. Energy markets are influenced by a wide range of variables that cannot be fully anticipated.
What This Environment Means for Market Participants
Several structural conclusions are emerging from the current trading pattern that have implications beyond the immediate price level. In addition, these conclusions speak directly to why oil slips as markets look for cues on Gulf supplies remains such a persistent and recurring dynamic:
- Volatility is a feature, not a bug: The alternating spike-and-correction cycle is not noise around a trend. It is the market's mechanism for continuously repricing the probability distribution of worst-case supply outcomes.
- Flow data is the primary price anchor: As long as Gulf producers maintain their alternative export architecture, headline-driven price spikes will face a ceiling set by physical supply reality.
- Refined products carry differentiated risk: Investors and analysts focusing exclusively on crude benchmarks are missing the more acute stress building in downstream energy markets, where supply recovery has lagged crude considerably.
- Diplomatic optionality has tangible value: The market's willingness to partially reverse geopolitical spikes reflects an embedded assumption that some form of de-escalation pathway remains available. The moment that assumption is seriously challenged, the pricing regime changes fundamentally.
- Iran's Hormuz leverage is time-limited: The longer Gulf producers successfully develop and institutionalise alternative routing, the less the Strait's formal closure functions as an effective supply weapon.
Understanding the broader impact on oil prices from macro-level disruptions remains essential for contextualising these structural conclusions within the wider energy landscape.
The defining dynamic of the current oil market is not the conflict itself. It is the continuously narrowing gap between what the worst-case geopolitical scenario implies for supply, and what traders are actually observing in physical cargo flows.
Frequently Asked Questions
Why did oil prices fall even as Gulf military activity intensified?
Markets shifted attention from geopolitical signalling to actual supply flow data. With Rystad Energy estimating approximately 13 million barrels per day still reaching markets and Gulf exports tracking near 75% of pre-conflict levels, traders concluded the physical disruption was materially less severe than the headline environment implied.
What makes the Strait of Hormuz so critical to global energy markets?
The strait previously facilitated the transit of roughly one-fifth of all global oil and gas supply. Its closure by Iran in February 2026 represented the most significant single chokepoint disruption in recent energy history, though alternative routing has substantially offset the initial impact on crude volumes.
Why do refined products remain more disrupted than crude oil?
Crude oil benefits from greater routing flexibility, as it can be moved through pipelines, re-export hubs, and a wider range of tanker types. Refined products are constrained by specific refinery locations, product tanker availability, and tighter infrastructure dependencies, meaning their recovery from disruption is inherently slower and more complex.
What is the TACO dynamic in commodity trading?
The term has been adopted by commodity traders to describe the observed pattern whereby markets initially price in presidential threats of military escalation as genuine signals, then partially unwind those gains when the threatened action does not materialise at the implied scale. It has become a recognised behavioural factor in oil market analysis during the current conflict period, and its influence is clearly visible in recent sessions where oil slips as markets look for cues on Gulf supplies.
Want to Stay Ahead of the Next Major Resource Discovery Amid Market Volatility?
While energy markets oscillate between geopolitical fear and supply reality, Discovery Alert's proprietary Discovery IQ model cuts through the noise by delivering real-time alerts on significant ASX mineral discoveries — explore historic discoveries and their exceptional returns to understand the opportunity, then begin your 14-day free trial at Discovery Alert to position yourself ahead of the broader market.