
June 17, 2026
The Structural Logic of Mining Equity Corrections: What Cycles Reveal Before Price Does
Most investors focus on where a market index is trading today. Far fewer examine why a correction is happening at all, what it is architecturally designed to accomplish within a larger trend structure, and what specific conditions must be satisfied before the next advance can be sustained. In commodity-linked equity indices, this distinction between surface-level price movement and structural market behaviour is especially consequential. Nowhere is this more apparent right now than in the HUI Gold Bugs Index correction that has been unfolding since early March 2026.
Understanding this correction requires moving well beyond simple price observation. It demands a multi-timeframe analytical framework, an appreciation of sector breadth dynamics, and a clear-eyed assessment of what technical signals actually confirm a trend change versus what merely resembles one. Furthermore, understanding gold stock secular cycles provides essential context for interpreting where any given correction sits within the broader long-term structure.
When big ASX news breaks, our subscribers know first
What the HUI Gold Bugs Index Actually Tracks (and Why the Design Matters)
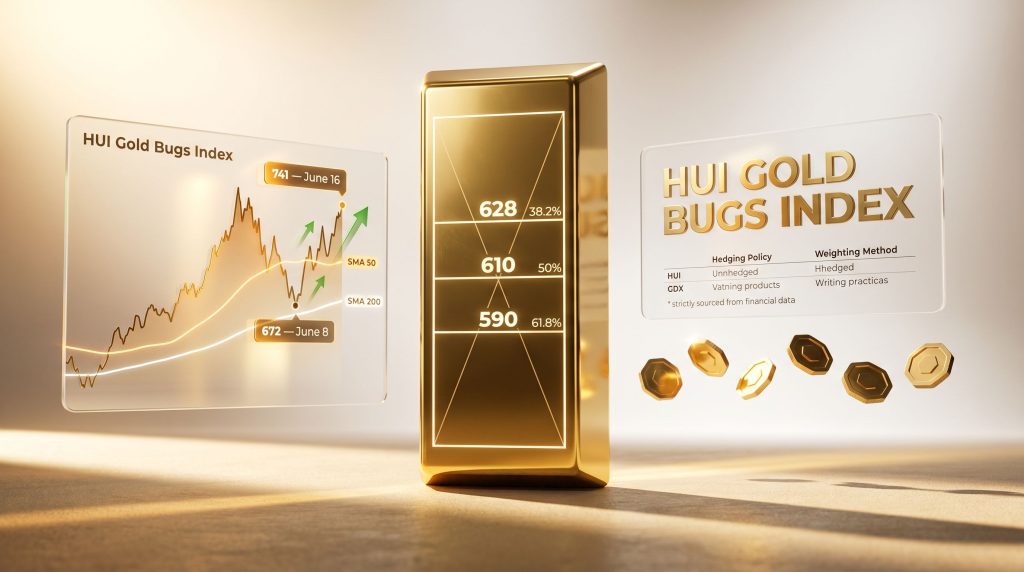
The HUI, formally known as the NYSE Arca Gold BUGS Index, is not a generic mining benchmark. Its structural design makes it fundamentally different from broader sector proxies. BUGS is an acronym for Basket of Unhedged Gold Stocks, and this naming is deliberate. Every constituent company in the index is required to maintain minimal forward hedging on its gold production, meaning these miners carry nearly full exposure to spot gold price movements.
This unhedged mandate has a profound effect on how the index behaves. Because constituent companies cannot meaningfully insulate themselves from gold price swings through derivatives contracts, the HUI functions as an amplified proxy for gold sentiment rather than a simple sector tracker. When gold rises, unhedged miners capture the full benefit in their revenue and margin projections. When gold falls, there is no hedging cushion to absorb the impact.
The index also uses a modified equal-dollar weighting methodology, rebalanced quarterly, which differs materially from market-capitalisation-weighted instruments like the GDX ETF. This design choice means the HUI does not become overly concentrated in the largest miners over time, maintaining more consistent cross-company exposure.
| Feature | HUI Gold Bugs Index | GDX (VanEck Gold Miners ETF) | XAU Philadelphia Gold Index |
|---|---|---|---|
| Hedging Policy | Unhedged only | Mixed | Mixed |
| Weighting Method | Modified equal-dollar | Market-cap weighted | Market-cap weighted |
| Rebalancing Frequency | Quarterly | Quarterly | Periodic |
| Price Sensitivity to Gold | Very High | High | Moderate to High |
| Typical Volatility | Elevated | Moderate to High | Moderate |
The practical implication for investors is significant. Traders seeking amplified participation in gold price cycles will find the HUI more responsive than cap-weighted alternatives, but that amplification works symmetrically, cutting sharply in both directions during volatile periods.
Defining the Current Correction: What It Is and What It Isn't
A market correction is conventionally understood as a decline of 10% or more from a recent peak that does not constitute a full reversal of the primary trend. In commodity equity indices like the HUI, corrections tend to be sharper in magnitude and faster in development than in diversified equity benchmarks, owing to concentrated sector exposure and the directional leverage embedded in unhedged mining operations.
The critical analytical distinction investors must make is between a mid-cycle correction within a secular bull market and a genuine trend-ending bear market reversal. Confusing these two conditions leads to opposite errors, either abandoning a position prematurely during a healthy consolidation, or holding through a genuine structural breakdown.
Critical Distinction: A correction occurring within a secular bull market typically maintains higher lows across the medium term, temporarily breaches short-term moving averages without sustained breakdown below long-term trend measures, and resets breadth indicators to healthier levels. A genuine bear market reversal produces successive lower highs and lower lows across multiple timeframes, sustained breakdown below the 200-day moving average, and deteriorating long-term breadth trends.
The HUI's current corrective phase began after a March 2, 2026 high that is now characterised as a classic bull trap. The index had been advancing through its fifth upward leg since the broader bull market structure that originated in 2016, and that fifth leg carried enough momentum to generate extreme overbought readings on monthly timeframes before rolling over sharply.
Daily Chart Analysis: Three Steps Required to Break the Downtrend
From a daily chart perspective, the HUI has accomplished meaningful technical work during the corrective phase. The index traded near 672 on June 8, 2026, recovering to approximately 741 by June 16, 2026, representing a volatile but significant bounce from the corrective low zone.
The sequence of events on the daily chart is technically informative. The index experienced a plunge below its 200-day simple moving average (SMA 200) followed by a sharp whipsaw recovery back above that level, testing the upper boundary of a major structural support zone in the process. A partial Fibonacci retracement toward the 628 level (approximately the 38.2% retracement zone from the corrective low) was observed, indicating meaningful downside absorption.
However, reclaiming the SMA 200 represents only the first of three sequential conditions required to technically confirm that the corrective downtrend has been broken. Gary Tanashian, founder and editor of Notes from the Rabbit Hole (NFTRH), has outlined this three-step recovery framework clearly in his technical analysis published at Gold-Eagle.com:
- Step 1 (partially achieved): The index must close and sustain above the 200-day moving average
- Step 2 (not yet confirmed): The 50-day moving average (SMA 50) must be cleared to the upside, signalling a shift in short-term momentum
- Step 3 (not yet confirmed): The index must register a higher high above the most recent notable high of approximately 842, confirming the corrective structure has been definitively broken
Warning for Investors: Until all three steps are sequentially confirmed, upward movements in the HUI should be interpreted as tradeable rallies within an ongoing corrective structure, not necessarily the beginning of the next sustained bull leg. The risk/reward calculation changes materially depending on the index's position relative to its corrective low.
The Absent Capitulation Signal: Why Volume Context Matters
One of the more technically significant observations about the current corrective phase is what has not happened. Genuine correction lows in commodity equity markets are historically accompanied by spike capitulation volume, a surge in selling pressure that exhausts bearish momentum and clears the market of weak holders who bought during the preceding advance.
The current HUI Gold Bugs Index correction has not produced identifiable capitulation volume signatures. This observation does not definitively preclude the correction from being complete, but it does meaningfully reduce statistical confidence in a definitive bottom. Technically informed investors treat the absence of capitulation volume as a reason for continued caution rather than confident accumulation.
Monthly Chart Perspective: Long-Term Structure Remains Constructive
Stepping back to the monthly timeframe introduces a substantially different analytical context. The monthly chart reveals that the HUI's corrective work has accomplished something structurally important: it has relieved the extreme overbought conditions that had accumulated during the fifth leg of the bull market advance since 2016.
The most critical feature of the monthly chart is the structural support zone defined by the 2010-2011 topping pattern. During that earlier period, the HUI formed a significant price consolidation and subsequent top as the gold bull market of that era peaked. The price levels associated with that multi-year topping structure now function as a durable long-term support zone, representing a reference point where decades of historical buying and selling activity established meaningful technical significance.
The current correction has brought the HUI into contact with the upper boundary of this zone. From a long-term perspective, and considering the broader gold market outlook for 2025 and beyond, the index is behaving constructively by testing and partially holding this level.
| Fibonacci Retracement Level | Approximate HUI Price | Technical Significance |
|---|---|---|
| 38.2% | ~628 | Near-term support, partially tested and absorbed |
| 50.0% | ~610 | Mid-range retracement, not yet reached |
| 61.8% | ~590 | Deep correction target, aligns with structural support zone |
A deeper retracement toward the 62% Fibonacci level near 590 remains technically viable and would represent the most thorough washout of bull market excess accumulated during the fifth leg advance. Whether the market provides that opportunity depends on whether the current bounce develops into a sustained recovery or ultimately stalls and revisits lower levels.
It is worth noting that genuine bull markets do not always offer investors the opportunity to enter at the most technically logical support levels. A real bull market resumption may occur before the 590 zone is reached, leaving patient investors waiting for a deeper entry that never materialises.
The BPGDM Breadth Indicator: Looking Past the Headline Reading
Among the analytical tools available for assessing the structural health of the gold mining sector, the BPGDM (Bullish Percent Index for Gold Miners) deserves careful treatment. The BPGDM measures the percentage of gold mining stocks currently generating a Point and Figure buy signal, functioning as a sector-wide breadth thermometer rather than a price indicator.
The BPGDM recently registered a near-zero reading, one of the most extreme oversold breadth conditions measurable. This type of extreme reading generates considerable excitement among contrarian investors who interpret deeply oversold conditions as automatically bullish. That interpretation, while intuitively appealing, misses the more important signal.
Analytical Discipline Required: The significance of a single extreme BPGDM reading is frequently overstated. The headline spike low, even reaching zero, is far less important than the 200-day moving average trend of the BPGDM itself. That longer-term trend reveals whether the sector's structural breadth is in a bull or bear configuration regardless of short-term volatility.
The BPGDM's SMA 200 is currently trending upward, establishing a pattern of higher highs and higher lows that parallels the bull market structure visible in the HUI itself. This long-term breadth trend confirms the structural bull market in gold mining equities remains intact, even as short-term breadth collapsed to extreme lows during the correction.
However, the SMA 200 of the BPGDM is likely to require additional time and price consolidation before producing the higher low that would fully complete its corrective process. Reacting to an extreme daily breadth reading without this context is a common analytical error that leads to premature position entries.
The next major ASX story will hit our subscribers first
A Broader Macro Shift: Gold Miners Are No Longer Alone
One of the more strategically significant developments in the precious metals mining landscape during this period is a shift in the sector's relative market positioning. Through much of 2025, the relationship between gold price and mining equities meant that gold, silver, and the broader precious metals mining complex — including royalty companies and exploration-stage operators — functioned as uniquely isolated outperformers in an otherwise challenged macro environment.
That dynamic has, however, changed. The precious metals sector has transitioned from being a standalone performance story to becoming part of a wider group of macro beneficiary sectors that are collectively responding to the same underlying economic and monetary conditions. This shift has implications for how the sector is valued, how institutional capital is allocated across it, and how it behaves relative to other risk assets during periods of market stress.
For investors in gold mining equities, this evolution means that top-down macro analysis becomes increasingly important alongside traditional technical analysis of the HUI. The sector's performance going forward will be influenced not only by gold's price trajectory but also by how it competes for capital allocation against other beneficiary sectors responding to the same macro tailwinds.
Three Investor Scenarios for the Path Forward
Given the current technical configuration of the HUI Gold Bugs Index correction, investors face meaningfully different risk/reward profiles depending on which scenario ultimately plays out.
Scenario A: The Correction Is Complete at Current Levels
The HUI has found its low at the structural support zone defined by the 2010-2011 topping pattern. The bounce develops into a sustained trend reversal, progressing through all three recovery steps. The primary risk in this scenario is entering positions before Step 2 (SMA 50 clearance) and Step 3 (higher high above 842) are confirmed, leaving capital exposed to renewed downside if the recovery stalls.
Scenario B: Additional Consolidation Is Required
The HUI bounces but fails to clear the SMA 50 or register a higher high. The index grinds sideways or lower, eventually testing the 62% Fibonacci zone near 590. This scenario offers a superior entry point for long-term investors but demands patience and tolerance for continued drawdown before conditions improve. In addition, it may present opportunities in undervalued mining stocks that have been disproportionately affected by the corrective phase.
Scenario C: Immediate Bull Market Resumption Without Deeper Retracement
A rapid sequence of upward steps confirms the correction is over before the deeper Fibonacci levels are tested. Historical precedent in genuine bull markets suggests that optimal re-entry levels are not always offered twice. Investors waiting for 590 may miss the next advance entirely.
Each scenario carries a different optimal strategy. What all three share is the same foundational observation: the risk/reward profile from current post-correction levels is substantially more favourable than it was near the January to March 2026 peak, when the HUI was registering extreme overbought readings on the monthly chart.
Key Takeaways for HUI Gold Mining Investors
- The HUI Gold Bugs Index correction has accomplished meaningful technical work, testing major structural support defined by the 2010-2011 topping zone and relieving extreme overbought monthly conditions
- Three sequential recovery steps (SMA 200 reclaim, SMA 50 clearance, higher high above 842) must all be confirmed before the corrective downtrend is technically broken
- The absence of capitulation volume reduces confidence that the correction is definitively complete
- The BPGDM's SMA 200 trend remains the most important breadth signal to monitor; its series of higher highs and higher lows confirms the structural bull market in gold miners remains intact
- A deeper retracement toward 590 (62% Fibonacci) remains technically viable and represents the most complete correction scenario, though bull markets do not guarantee such opportunities
- The sector has shifted from isolated outperformer to part of a broader macro beneficiary group, increasing the importance of top-down macro analysis alongside technical indicators
- Understanding the types of gold mining stocks within the index helps investors assess which individual components carry the greatest sensitivity to corrective price action
- Long-term risk/reward is substantially more favourable at current post-correction levels than it was at the early 2026 peak
Furthermore, the au.investing.com HUI tracking data provides a useful real-time reference for monitoring whether the three-step recovery framework is progressing as technically required.
This article is intended for informational and educational purposes only and does not constitute financial advice. All technical analysis involves assumptions and uncertainty. Past performance of index levels and technical patterns does not guarantee future results. Investors should conduct their own due diligence or consult a qualified financial adviser before making investment decisions.
Want to Know When the Next Major Gold Mining Discovery Hits the ASX?
While navigating the structural complexities of HUI corrections and gold mining cycles demands patience and discipline, Discovery Alert's proprietary Discovery IQ model cuts through the noise by delivering real-time alerts the moment significant ASX mineral discoveries are announced — empowering both traders and long-term investors to act decisively ahead of the broader market. Explore Discovery Alert's discoveries page to see the historic returns major mineral discoveries have generated, and begin a 14-day free trial to secure your edge in the gold mining sector.