July 9, 2026
The Invisible Spectrum That Changes Everything in Mineral Exploration
Every rock surface tells a chemical story that human eyes are structurally incapable of reading. The visible light spectrum, spanning roughly 400 to 700 nanometres, represents less than one percent of the full electromagnetic range. Yet conventional geological mapping has relied on this narrow visual window for more than a century, leaving the vast majority of mineralogically diagnostic information embedded in rock surfaces effectively unread. This is not a minor limitation. In an era when the world's most accessible ore bodies have already been found, the exploration industry's capacity to decode what the eye cannot see has become a genuine competitive differentiator.
A hyperspectral imaging system for mining exploration is the technology engineered specifically to fill this gap. By capturing hundreds of contiguous spectral bands across wavelength ranges far beyond visible light, these systems can identify individual mineral species, map hydrothermal alteration zones, and generate spatially continuous chemical maps of terrain at scales ranging from a single drill core tray to hundreds of square kilometres of open ground.
When big ASX news breaks, our subscribers know first
Why Conventional Exploration Leaves Value on the Table
The standard exploration workflow, built around field sampling, assay laboratories, and manual core logging, introduces three compounding problems that hyperspectral technology is uniquely positioned to address. Understanding these limitations is essential context for appreciating why mineral exploration methods are evolving so rapidly.
First, sampling is inherently discontinuous. A geologist logging a drill core at one-metre intervals captures perhaps five percent of the available chemical information along that hole. Hydrothermal alteration zones that transition over centimetres, or thin mineralised intervals sandwiched between barren lithologies, are routinely missed or mischaracterised.
Second, manual interpretation is subjective. Two experienced geologists examining the same core tray may assign different mineral identifications to the same clay assemblage, particularly where phyllic and argillic alteration minerals coexist. This interpreter variability propagates into resource models and drill targeting decisions with measurable economic consequences.
Third, laboratory turnaround times create bottlenecks. In active drilling programs, assay results often lag drilling by weeks, preventing real-time adjustment of hole positioning or depth decisions based on mineralogical feedback.
The electromagnetic spectrum contains hundreds of mineralogically distinct absorption features invisible to the naked eye. A hyperspectral imaging system is engineered specifically to decode this hidden chemical landscape at scale, transforming a qualitative visual exercise into a quantitative spectroscopic one.
The Physics Behind Spectral Mineral Detection
Understanding why a hyperspectral imaging system for mining exploration works requires a basic grasp of reflectance spectroscopy. When electromagnetic radiation strikes a mineral surface, specific wavelengths are absorbed by the atomic bonds within that mineral's crystal structure, while the remaining wavelengths are reflected back toward the sensor. The pattern of absorbed wavelengths is unique to each mineral species, functioning as a chemical fingerprint.
Kaolinite absorbs differently from illite. Calcite produces a distinct signature from dolomite. Goethite and hematite, both iron oxides but with different hydroxyl content, are distinguishable from one another at wavelengths invisible to any camera capturing only red, green, and blue channels.
Mining-grade hyperspectral systems exploit three primary electromagnetic windows:
- Visible and Near-Infrared (VNIR), approximately 400 to 1,000 nm: Most effective for detecting iron oxides, hydroxides, and vegetation stress indicators that can serve as geobotanical proxies for subsurface mineralisation.
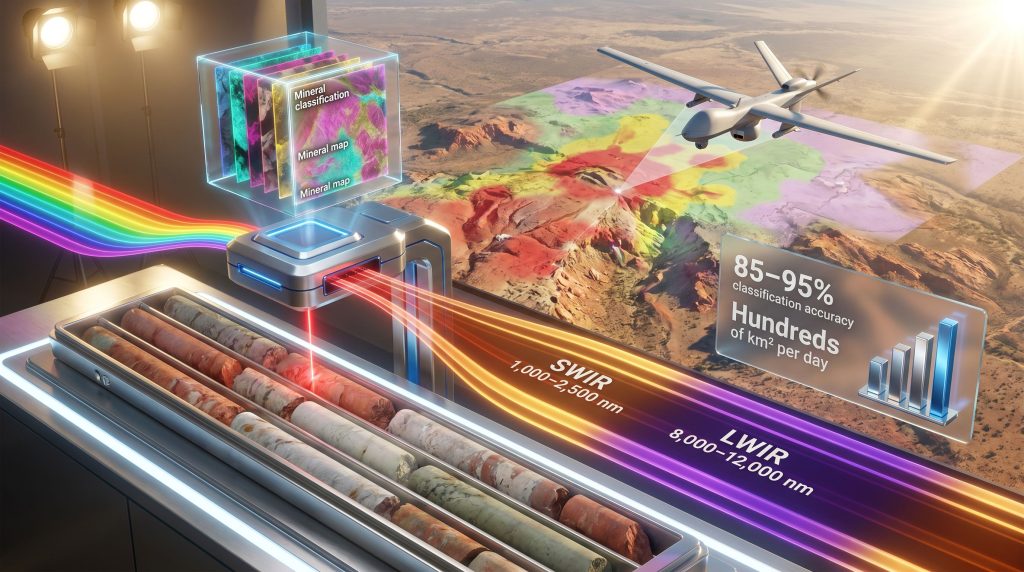
- Shortwave Infrared (SWIR), approximately 1,000 to 2,500 nm: The workhorse range for mineral exploration. Clay minerals, carbonates, sulfates, and many hydrothermal alteration assemblages produce their most diagnostic absorption features in this window.
- Longwave Infrared (LWIR), approximately 8,000 to 12,000 nm: Critical for silicate mineral differentiation, including quartz, feldspar, and amphibole identification, which supports lithological boundary mapping even through partial vegetation cover.
From Raw Photons to Mineral Maps
The sensor itself captures what is called a hyperspectral data cube: a three-dimensional dataset with two spatial axes and one spectral axis, containing reflectance values at every measured wavelength for every pixel in the image. A single airborne acquisition over a one square kilometre survey area can generate more mineralogical information than months of manual field mapping.
Two sensor architectures dominate operational systems. Pushbroom sensors capture one spatial line at a time as the aircraft or drone moves forward, building the spatial image progressively. Snapshot sensors capture entire two-dimensional scenes simultaneously, trading some spectral resolution for speed. Both require rigorous radiometric calibration and atmospheric correction to convert raw digital counts into physically meaningful reflectance values that can be matched against verified spectral libraries.
Spectral unmixing algorithms then decompose each pixel into proportional contributions from multiple mineral end-members, acknowledging that most geological surfaces are mineralogically heterogeneous at sub-pixel scales. This mathematical decomposition is what converts a spectral image into a quantitative mineral abundance map. Furthermore, AI in mineral exploration is increasingly being used to accelerate this classification process at scale.
Core Detection Capabilities Across Deposit Types
| Detection Function | Spectral Range | Mining Application |
|---|---|---|
| Clay mineral discrimination (kaolinite, illite, smectite) | SWIR | Hydrothermal alteration mapping |
| Iron oxide and hydroxide identification | VNIR | Gossans, oxidation zones, weathering profiles |
| Carbonate mapping (calcite, dolomite, siderite) | SWIR | Skarn and carbonate-hosted deposit targeting |
| Sulfate and sulfide proxies | SWIR | Porphyry systems, acid drainage risk |
| Silicate mineral differentiation | LWIR | Lithological boundary delineation |
| Vegetation stress and geobotanical anomalies | VNIR | Biogeochemical exploration targeting |
| Quantitative grade estimation | SWIR plus machine learning | Resource model calibration |
Hydrothermal Alteration: The Primary Exploration Signal
A frequently underappreciated insight among non-specialists is that hyperspectral systems rarely detect ore minerals directly. Instead, they map the alteration halos surrounding mineralisation, which are often orders of magnitude larger in spatial extent than the ore body itself, and therefore far more detectable from the air.
Porphyry copper-gold systems, for example, display concentric alteration zones radiating outward from the mineralised core: potassic alteration nearest the intrusion, grading outward through phyllic (sericite-pyrite) and argillic (kaolinite-rich) zones to propylitic assemblages at the distal margin. Each zone produces a spectrally distinct signature in the SWIR range. An airborne hyperspectral survey can map these concentric patterns across tens of square kilometres, generating a geological vector that points toward the buried mineralised centre before a single drill hole has been collared.
Lithium minerals present a particularly instructive case for critical mineral explorers. Spodumene and lepidolite, the primary lithium-bearing silicates in hard-rock pegmatite systems, produce characteristic absorption features in the SWIR range between approximately 1,400 and 2,200 nm. While direct detection from airborne platforms is challenging due to spatial resolution constraints and weathering effects, drill core scanning at sub-millimetre resolution can generate continuous lithium mineral logs along entire pegmatite intersections, enabling far more precise resource estimation than conventional spot sampling.
Deployment Platforms: Matching Scale to Objective
| Platform | Spatial Resolution | Coverage Rate | Best Application |
|---|---|---|---|
| Satellite (e.g., Pixxel, PRISMA) | 5 to 30 m per pixel | Global, frequent revisit | Regional reconnaissance, brownfields screening |
| Fixed-wing aircraft | 0.5 to 5 m per pixel | Hundreds of km² per day | District-scale alteration mapping |
| UAV or Drone | 2 to 20 cm per pixel | Tens of km² per day | Detailed outcrop and open-pit mapping |
| Laboratory core scanner | Sub-millimetre per pixel | Full drill core libraries | Core mineralogy and grade estimation |
| Portable field spectrometer | Point measurement | Sample by sample | Field verification and quality assurance |
Airborne deployment remains the preferred balance between spatial resolution and areal coverage for greenfields exploration programs. A well-configured fixed-wing mission can characterise surface mineralogy across areas that would require years of ground-based mapping, delivering preliminary alteration maps within days of data acquisition. According to Mining Technology, hyperspectral imaging from aircraft is increasingly being recognised as a transformative step-change in remote mineral mapping capability.
The European-led m4mining consortium, which included geoscience and remote sensing researchers from the University of Queensland's Sustainable Minerals Institute, advanced this capability significantly. The consortium delivered a hyperspectral imaging system capable of mapping surface patterns of minerals, soils, and vegetation from aircraft in real time, substantially compressing the gap between data acquisition and actionable geological output. This kind of multi-institutional collaboration, combining sensor physics engineering with applied geoscience domain expertise, represents the most operationally effective model for advancing HSI capability beyond commercial vendor limitations.
Drill Core Scanning: The Subsurface Spectral Record
Laboratory core scanners occupy a special position in the hyperspectral workflow because drill core is simultaneously the highest-value and most information-dense sample type in any exploration program. Systems such as the Specim SisuROCK capture continuous spectral logs at sub-millimetre resolution along entire core lengths, generating an unbroken mineralogical record that conventional chip-tray logging cannot replicate.
The practical workflow proceeds as follows:
- Core trays are loaded sequentially into the scanner following core retrieval from the drill site.
- The system captures a full VNIR-SWIR spectral image of each tray, typically in under two minutes per metre of core.
- Automated spectral classification assigns mineral identifications to every pixel, generating a continuous depth log of mineral abundances.
- The spectral log is integrated with downhole geophysics and assay data to build three-dimensional mineralogical models of the deposit.
- Alteration vectoring analysis identifies spatial trends that guide subsequent drill hole positioning.
This workflow has demonstrated the capacity to reduce the number of assay samples required for resource characterisation, directing laboratory resources toward the intervals most likely to deliver grade information rather than processing the entire core at uniform intervals.
Accuracy, Limitations, and How to Navigate Them
Controlled core scanning studies have reported mineral classification accuracies of 85 to 95 percent when spectral libraries are well-calibrated against verified reference minerals. However, several constraints require deliberate management:
| Limitation | Technical Cause | Mitigation Strategy |
|---|---|---|
| Vegetation cover interference | Canopy obscures surface mineralogy | Geobotanical proxies; LWIR penetration |
| Atmospheric absorption windows | Water vapour and CO₂ mask spectral bands | Rigorous atmospheric correction |
| Mixed pixel problem | Sub-pixel mineral heterogeneity | Spectral unmixing, higher resolution sensors |
| Spectral library dependency | Accuracy limited by reference database | Continuous library expansion; field validation |
| High airborne deployment cost | Sensor and processing infrastructure | Drone deployment; satellite pre-screening |
| Depth limitation | Surface and near-surface only | Integration with downhole geophysics |
Hyperspectral imaging is a surface and near-surface technology. Its greatest diagnostic power is realised when it functions as the first filter in a multi-method workflow, directing subsurface investigation rather than replacing it.
One constraint that receives insufficient attention in commercial literature is the spectral variability problem. The same mineral can produce meaningfully different spectral signatures depending on grain size, surface roughness, moisture content, and the degree of crystallinity. A poorly calibrated spectral library trained on pristine laboratory samples may systematically misclassify weathered or fine-grained field equivalents. Continuous library refinement using field-validated reference samples from the specific geological terrain being surveyed is a non-negotiable requirement for high-confidence mapping.
The next major ASX story will hit our subscribers first
Machine Learning and the Democratisation of Spectral Interpretation
The integration of artificial intelligence with hyperspectral data processing is arguably the most consequential development in the field over the past five years. Supervised classification models trained on labelled spectral libraries can automate mineral identification at scales that no specialist team could match manually. Convolutional neural networks applied to hyperspectral data cubes simultaneously exploit spatial and spectral patterns, achieving classification performance that exceeds traditional wavelength-position matching algorithms in complex, mineralogically mixed terrains.
Perhaps more significant for the broader industry is the emergence of cloud-based HSI processing platforms that allow junior exploration companies to access enterprise-grade mineral mapping without capital investment in specialised processing infrastructure. This democratisation is reshaping the competitive landscape, making district-scale alteration mapping accessible to companies that previously could not justify the cost of specialist spectroscopists on staff.
The trajectory points toward fully autonomous exploration systems where airborne HSI sensors, AI classifiers, and robotic or semi-autonomous drilling platforms operate as an integrated discovery engine, with spectral feedback from surface mapping directly informing subsurface drill targeting in near-real time. Consequently, outputs from these systems feed naturally into 3D geological modelling workflows, enabling far more precise deposit characterisation at earlier stages of a program.
Frequently Asked Questions: Hyperspectral Imaging in Mining
What is the difference between multispectral and hyperspectral imaging?
Multispectral systems capture between 3 and 15 broad spectral bands, sufficient for vegetation health indices and coarse lithological discrimination. Hyperspectral systems capture 100 to 500 or more narrow contiguous bands, which is the minimum spectral density required to resolve individual mineral species through their characteristic absorption features. For regional screening, multispectral data provides a cost-effective first pass. For mineralogical precision, hyperspectral is required.
Can hyperspectral imaging replace geochemical assays?
Not for regulatory-grade resource estimation. HSI functions most effectively as a pre-screening and prioritisation tool, directing assay resources toward the highest-value intervals and reducing total analytical cost. Emerging hybrid workflows combine continuous HSI spectral logs with selective assay validation to maintain resource model integrity while meaningfully reducing laboratory expenditure. In addition, interpreting drill results alongside HSI outputs allows teams to build a far more complete picture of a deposit's geometry and grade continuity.
Which spectral range matters most for critical mineral exploration?
- Lithium minerals (spodumene, lepidolite): SWIR, with diagnostic features between 1,400 and 2,200 nm.
- Rare earth element proxies in carbonatite and laterite systems: VNIR to SWIR, targeting carbonate and phosphate absorption features.
- Cobalt and nickel laterites: VNIR to SWIR, using iron oxide and clay mineral assemblages as indirect proxies.
- Copper porphyry systems: SWIR, targeting phyllic and argillic clay alteration assemblages as the primary exploration signal.
The Strategic Position of Hyperspectral Imaging in Critical Mineral Supply Chains
Global demand trajectories for battery metals, rare earth elements, and the full suite of materials required for energy transition technologies are compressing the timelines within which exploration programs must deliver economically viable discoveries. In this environment, a hyperspectral imaging system for mining exploration that accelerates the transition from greenfields target identification to maiden resource estimate carries a premium that is measurable in years saved and capital preserved.
Beyond pure discovery, HSI is gaining traction in environmental and regulatory contexts. Non-destructive, spatially comprehensive surveys generate objective baseline documentation of surface mineralogy and vegetation condition before mining commences, providing a verifiable reference dataset for progressive rehabilitation monitoring. According to Headwall Photonics, the ability to deliver spatially continuous mineralogical data without physical disturbance is becoming an increasingly valuable attribute in jurisdictions where environmental approvals are tied to baseline survey quality. Regulators and communities are increasingly receptive to time-stamped spectral evidence of mine-site recovery as a complement to, and in some jurisdictions a partial substitute for, more invasive sampling programs.
The University of Queensland's Sustainable Minerals Institute represents one of the most active intersections of geoscience, remote sensing, and responsible resource development globally, with research programs spanning the full arc from sensor development to ESG reporting frameworks. Its ranked position as fifth in the world for Mineral and Mining Engineering in the 2026 QS World University Rankings by Subject reflects the institutional depth behind this work. Readers seeking to expand their understanding of remote sensing applications in geoscience and sustainable mineral exploration can explore related research and educational content published by the Institute at smi.uq.edu.au.
Disclaimer: This article is intended for informational and educational purposes only. It does not constitute financial or investment advice. Forecasts, technology performance benchmarks, and market projections discussed herein are subject to change and should not be relied upon as the basis for investment decisions. Readers should conduct their own independent research and consult qualified professionals before making any financial commitments.
Want to Be First When the Next Major Mineral Discovery Hits the ASX?
Discovery Alert's proprietary Discovery IQ model scans ASX announcements in real time, instantly translating complex mineralogical data into actionable alerts across more than 30 commodities — so subscribers can act on significant discoveries before the broader market catches on. Explore historic discoveries and their remarkable returns, then start your 14-day free trial at Discovery Alert to position yourself ahead of the next major find.