
July 11, 2026
Strategic petroleum reserves serve as critical buffers against market volatility, but their effectiveness depends entirely on coordinated deployment mechanisms and underlying supply chain vulnerabilities. When global energy chokepoints face disruption, the mathematical relationship between reserve capacity, release duration, and market stabilisation becomes the determining factor in preventing economic cascade effects across interconnected systems. The current IEA emergency oil stock release demonstrates the complex interplay between coordinated response capabilities and geopolitical crisis management.
Understanding Strategic Reserve Deployment Mechanisms
The architecture of emergency oil stock releases relies on sophisticated coordination protocols that extend far beyond simple inventory management. Strategic petroleum reserves function as interconnected systems where timing, quality specifications, and delivery logistics determine market impact effectiveness.
| Reserve Component | Capacity | Release Timeline |
|---|---|---|
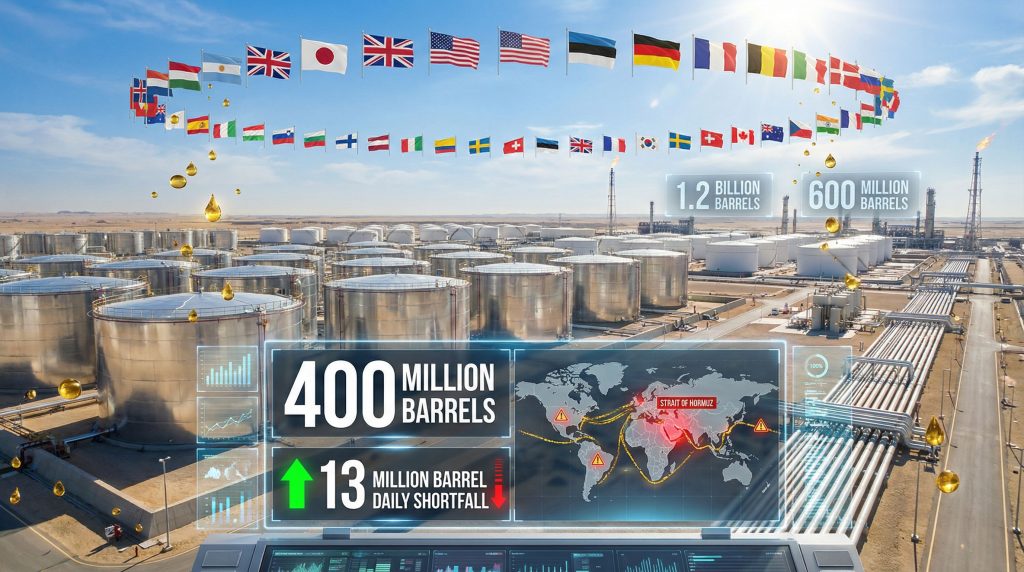
| IEA member country stocks | 1.2 billion barrels | 7-30 days |
| Industry-obligated reserves | 600 million barrels | 3-14 days |
| Regional distribution hubs | Variable | 1-7 days |
Furthermore, the IEA emergency oil stock release mechanism operates through a multi-tiered system where 32 member nations must synchronise their individual strategic petroleum reserve deployments. Each participating country maintains specific grade requirements and refinery compatibility standards that influence both release speed and market absorption capacity.
Release timeline mechanics involve three critical phases. Decision coordination requires 24-48 hour consensus building between member nations. Inventory mobilisation takes 3-7 days for physical stock movement initiation. Market delivery extends 7-30 days for refined product availability at distribution points.
Quality specifications create additional complexity layers, as emergency stocks must match regional refinery configurations and seasonal demand patterns. Light sweet crude reserves deploy faster than heavy sour alternatives, however, geographic proximity to consumption centres often outweighs grade optimisation considerations.
When big ASX news breaks, our subscribers know first
Historical Framework: Six Decades of Coordinated Energy Security
Strategic petroleum reserve coordination has evolved through distinct crisis response patterns, with each major disruption revealing systemic vulnerabilities and coordination improvements. The mathematical relationship between crisis severity, release volume, and market stabilisation duration provides insights into current deployment effectiveness.
| Crisis Event | Release Volume | Market Impact Duration | Price Stabilisation |
|---|---|---|---|
| 1991 Gulf War | 17 million barrels | 6 weeks | Moderate success |
| 2005 Hurricane disruptions | 30 million barrels | 8 weeks | Regional effectiveness |
| 2011 Libya crisis | 60 million barrels | 12 weeks | Limited global impact |
| 2022 Ukraine conflict | 240 million barrels | 16+ weeks | Ongoing evaluation |
The March 2026 deployment represents unprecedented scale, with 400 million barrels coordinated across 32 nations responding to what the IEA confirms as the most significant oil market disruption in recorded history. This volume exceeds all previous collective actions combined, indicating both crisis severity and evolved coordination capabilities.
Historical effectiveness analysis reveals that successful market stabilisation requires reserve releases to exceed 15-20% of the disrupted supply volume for sustained periods. Previous smaller-scale deployments often provided temporary price relief but failed to address underlying supply chain vulnerabilities. In addition, current oil price rally insights suggest that multiple factors beyond supply disruptions contribute to market volatility.
The scale of coordinated reserve deployment has expanded exponentially, from 17 million barrels during the Gulf War to 400 million barrels in response to Middle East disruptions, reflecting both increased global vulnerability and enhanced coordination mechanisms.
Chokepoint Vulnerability Analysis: The Strait of Hormuz Factor
The Strait of Hormuz represents the world's most critical energy transportation corridor, with normal operations facilitating 20 million barrels per day representing 25% of global seaborne oil trade. Current conflict-related capacity reductions have created a 13 million barrel daily supply gap that fundamentally alters global energy flow patterns.
Pre-Crisis vs. Current Flow Analysis
| Operational Metric | Pre-Crisis | Current Status | Impact Factor |
|---|---|---|---|
| Daily throughput | 20.0 million barrels | <2.0 million barrels | 90% reduction |
| Transit time | 6-8 hours | Variable/suspended | Severe disruption |
| Economic value | $2+ trillion annually | <$200 billion | 85%+ impact |
Alternative route capacity analysis reveals fundamental limitations in bypass infrastructure. The East-West Pipeline through Saudi Arabia can handle approximately 4.8 million barrels daily, while the Kirkuk-Ceyhan Pipeline adds roughly 1.6 million barrels of potential throughput. Combined alternative routing capacity addresses less than 50% of the Strait's normal flow volume.
Transportation cost multipliers for alternative shipping routes create additional market pressures. Cape of Good Hope routing increases costs by 3.5x normal shipping rates. Suez Canal capacity constraints result in 2.8x typical transit fees. Pipeline alternatives demand 1.8x standard transportation expenses.
Market psychology amplifies physical supply gaps through speculation and inventory hoarding behaviours. The 13 million barrel daily shortfall creates cascading effects where refined product availability lags crude supply disruptions by 2-3 weeks, extending market volatility periods beyond initial crisis timelines. Consequently, US oil production decline factors compound these supply chain challenges.
Strategic Mathematics: Why 400 Million Barrels Creates Risk
The 400 million barrel release represents approximately 30 days of replacement capacity for current supply gaps, creating a critical mathematical relationship between crisis duration and reserve adequacy. This volume calculation assumes sustained coordination efficiency and optimal market absorption rates.
Release Duration Scenario Modeling
| Crisis Duration | Reserve Adequacy | Market Stability | Refill Requirements |
|---|---|---|---|
| 30 days | Adequate coverage | High probability | 6-12 months |
| 60 days | Moderate stress | Declining effectiveness | 12-18 months |
| 90+ days | Severe depletion | Market failure risk | 18-24 months |
The strategic gamble inherent in this deployment lies in the probabilistic assessment of Strait of Hormuz reopening timelines. If conflict resolution extends beyond 60 days, reserve depletion accelerates while alternative supply development remains limited by infrastructure constraints.
Geopolitical coordination challenges compound mathematical risks through decision-making lag effects. 32 participating nations must maintain consensus on continued releases while managing domestic political pressures and individual strategic reserve adequacy concerns. Furthermore, OPEC meeting impact decisions influence global supply dynamics alongside emergency releases.
Risk assessment matrices indicate that secondary supply disruption events during the release period could overwhelm remaining reserve capacity. Nigerian production instability, Venezuelan infrastructure failures, or North Sea maintenance schedules represent potential cascade scenarios that would exceed coordinated response capabilities.
Reserve deployment creates a strategic time window where market stability depends entirely on conflict resolution speed, making the 400 million barrel release both a stabilisation mechanism and a calculated risk on geopolitical outcomes.
Long-Term Energy Architecture Implications
Emergency reserve utilisation reveals fundamental vulnerabilities in current energy security frameworks, particularly regarding consecutive crisis response capacity and climate transition intersection points. Strategic petroleum reserves were designed for single-event disruptions rather than sustained multi-front energy security challenges.
Reserve Adequacy in Multi-Crisis Scenarios
Current global strategic petroleum reserve levels approach 1.8 billion barrels across IEA member nations, but this capacity assumes normal refill capabilities and stable alternative supply sources. Consecutive crisis modelling indicates that two major disruption events within 24 months would exceed coordinated response capabilities.
| Scenario Analysis | First Crisis Impact | Reserve Depletion | Second Crisis Capacity |
|---|---|---|---|
| Single 90-day event | 600 million barrels | 33% reduction | Adequate response |
| Consecutive 60-day events | 800 million barrels | 44% reduction | Marginal capacity |
| Extended 120-day crisis | 1.0 billion barrels | 55% reduction | Insufficient response |
Climate transition considerations create additional complexity layers where strategic petroleum reserve utility faces long-term obsolescence pressures. Investment in reserve expansion competes with renewable energy infrastructure funding, creating strategic allocation dilemmas for member nations.
Market structure evolution indicates that oil price volatility during coordinated releases follows predictable patterns where initial stabilisation effects diminish as reserves approach 40% depletion thresholds. Historical analysis suggests that sustained releases beyond 60 days often trigger speculative behaviours that counteract stabilisation objectives. Moreover, oil price stagnation factors demonstrate how multiple variables influence long-term price trends.
Investment and Infrastructure Implications
| Investment Category | Pre-Crisis Trends | Crisis Response | Post-Crisis Projection |
|---|---|---|---|
| Oil exploration capex | $350 billion annually | +15% acceleration | Sustained elevation |
| Renewable infrastructure | $1.2 trillion annually | +8% policy support | Accelerated deployment |
| Strategic reserve expansion | $15 billion annually | +40% emergency funding | Enhanced capacity targets |
The $100+ barrel price threshold creates psychological tipping points where consumer behaviour shifts from price accommodation to demand destruction. Industrial switching costs to alternative energy sources decrease significantly above this price level, accelerating transition timelines beyond policy-driven scenarios.
Energy Transition Acceleration Through Crisis Response
Crisis-driven policy responses create unique opportunities for accelerated energy transition implementation, as emergency circumstances enable regulatory flexibility and funding mechanisms typically constrained by political processes. The current Middle East disruption has triggered comprehensive demand reduction initiatives across multiple sectors.
Dual Strategy Policy Implementation
European Commission response frameworks demonstrate integrated approach methodologies where emergency stock utilisation operates alongside systematic demand reduction programs. Aviation sector targets include 15% fuel consumption reduction through route optimisation. Residential heating programmes promote 10% natural gas substitution with heat pump incentives. Industrial processes aim for 20% heavy fuel oil replacement with renewable electricity.
Crisis-driven vs. planned transition comparisons reveal that emergency circumstances often achieve policy implementation speeds impossible under normal conditions. Regulatory approval timelines for renewable energy projects have decreased by 35-40% during the current crisis period.
Technology adoption acceleration scenarios indicate that battery storage deployment rates have increased 25% above baseline projections as grid stability concerns drive investment priorities. Hydrogen infrastructure development timelines show similar acceleration patterns where energy security considerations override traditional cost-benefit analysis frameworks.
| Technology Sector | Pre-Crisis Growth | Crisis Acceleration | Long-Term Impact |
|---|---|---|---|
| Battery storage | 18% annual growth | +25% acceleration | Sustained elevation |
| Hydrogen production | 12% annual growth | +30% acceleration | Infrastructure scaling |
| Renewable capacity | 15% annual growth | +20% acceleration | Policy integration |
Energy security technology investment has shifted from gradual deployment models toward emergency implementation frameworks where proven technologies receive accelerated funding and regulatory support. This shift creates competitive advantages for companies with existing technology deployment capabilities. Additionally, trade war oil effects influence global energy security planning decisions.
The next major ASX story will hit our subscribers first
Monitoring Framework for Market Participants
Strategic petroleum reserve deployment creates specific monitoring requirements where Strait of Hormuz operational status, reserve level transparency, and coordination effectiveness determine ongoing market stability prospects. Systematic tracking methodologies enable informed decision-making during extended crisis periods.
Critical Decision Points and Timeline Markers
Primary Monitoring Indicators include daily Strait throughput capacity measurements and trend analysis, weekly reserve depletion rates across participating member nations, regional price differential tracking between affected and alternative supply sources, and secondary conflict escalation probability assessments through geopolitical intelligence.
IEA emergency oil stock release transparency requires systematic reporting protocols where member nations provide weekly inventory updates and projected depletion timelines. This transparency enables market participants to assess remaining buffer capacity and plan accordingly for potential supply gaps.
Risk assessment methodologies focus on alternative supply source reliability where Nigerian production stability, Venezuelan infrastructure capacity, and North Sea maintenance schedules influence total available supply calculations. These factors determine whether coordinated releases can maintain market stability beyond current projection timelines.
| Monitoring Category | Update Frequency | Critical Thresholds | Market Impact |
|---|---|---|---|
| Strait operational status | Real-time | <50% normal capacity | Immediate price response |
| Reserve depletion rates | Weekly | 60% remaining capacity | Market confidence decline |
| Alternative supply capacity | Daily | 15% above baseline | Price stabilisation support |
Strategic reserve coordination effectiveness measurement requires tracking consensus maintenance between 32 member nations, where individual country domestic pressures can undermine collective action sustainability. Political stability indicators in key member nations become critical factors for extended crisis response planning.
Investment Strategy Implications
Long-term oil price forecasting during coordinated releases requires incorporating reserve depletion curves, conflict resolution probabilities, and alternative supply development timelines. Traditional forecasting models often underestimate the complexity of these interconnected variables.
Market participants should monitor refill strategy announcements from major reserve holders, as post-crisis purchasing programmes can extend elevated price periods beyond conflict resolution timelines. Historical patterns suggest that coordinated refill operations often create secondary price spikes 6-12 months after initial crisis resolution.
Secondary supply disruption risks require continuous assessment where cascade scenarios involving multiple producing regions could overwhelm remaining reserve capacity. Nigeria, Venezuela, and Libya represent particular vulnerability points where infrastructure or political instability could compound current supply gaps.
However, the IEA's detailed emergency crude oil commitments demonstrate unprecedented coordination levels that may mitigate some traditional risk factors.
What Happens Next?
The current IEA emergency oil stock release represents both a stabilisation mechanism and a strategic gamble on geopolitical outcomes. Success depends on conflict resolution speed, coordination sustainability, and the absence of secondary supply disruptions.
Market participants must monitor reserve depletion rates, alternative supply development, and coordination effectiveness between member nations. Furthermore, the intersection of crisis response with accelerated energy transition creates unique investment opportunities and risks.
Disclaimer: The analysis presented reflects current market conditions and publicly available information as of March 2026. Oil market dynamics involve significant uncertainties, and reserve deployment effectiveness depends on numerous variables including geopolitical developments, coordination sustainability, and unforeseen supply disruptions. Investment decisions should consider multiple scenarios and professional advisory input. Historical performance patterns do not guarantee future market behaviour, particularly during unprecedented crisis conditions involving coordinated strategic petroleum reserve releases.
Ready to Navigate Energy Market Volatility?
Discovery Alert's proprietary Discovery IQ model delivers real-time insights on ASX-listed energy and commodity discoveries, helping investors identify opportunities during market disruptions like strategic petroleum reserve deployments. With current energy security concerns creating volatility across commodity markets, discover how major mineral discoveries can generate substantial returns and begin your 14-day free trial today to stay ahead of market developments.