June 25, 2026
The Dual Pressure Reshaping Every Dollar of Global Energy Spending
Rarely in modern economic history has a single geographic flashpoint triggered a simultaneous reconfiguration of both short-term commodity markets and decades-long infrastructure investment pipelines. That is precisely what is unfolding across global energy markets in 2026. The IEA energy security crisis Iran war has exposed a structural vulnerability that policymakers and investors have long acknowledged in theory but never fully stress-tested in practice: the fragility of a deeply interconnected global energy system when its most critical physical chokepoints come under sustained pressure.
The International Energy Agency's 2026 World Energy Investment report, released in late May, delivers a sobering assessment. IEA Executive Director Fatih Birol characterised the current situation as the largest energy security crisis the world has ever faced, drawing explicit parallels to the transformative oil shocks of the 1970s while noting that the modern crisis is structurally more complex, more interconnected, and more consequential in its reach.
Understanding why this moment is different from every prior energy disruption requires moving beyond the headline figures and examining the underlying mechanics of how modern energy systems fail, adapt, and ultimately restructure themselves.
When big ASX news breaks, our subscribers know first
The Strait of Hormuz: A Chokepoint the World Cannot Afford to Lose
Few geographic features carry the economic weight of the Strait of Hormuz. At its narrowest point, the waterway measures approximately 33 kilometres across, yet it carries a volume of energy traffic that no alternative route can meaningfully absorb.
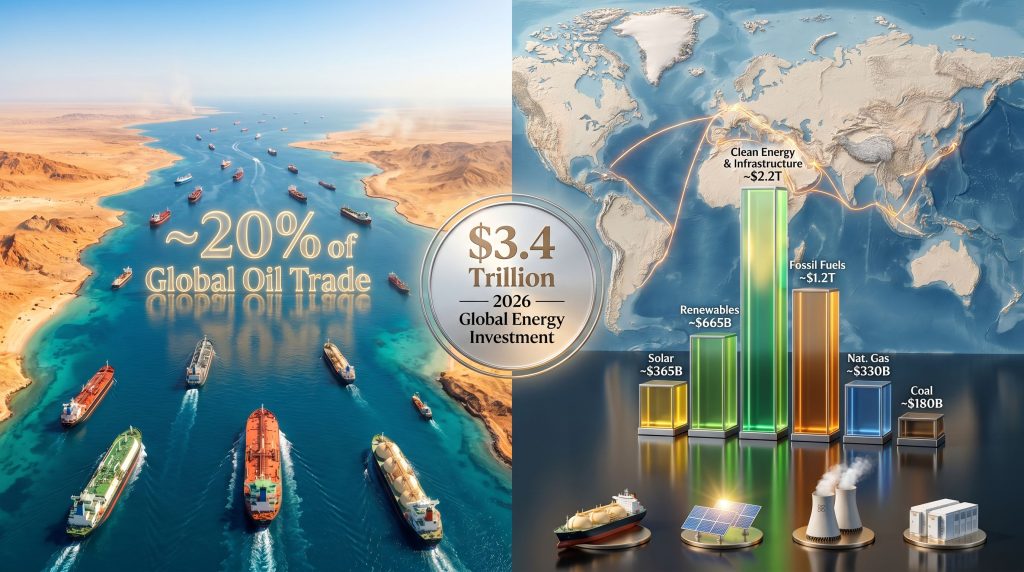
Approximately 20% of all global oil trade transits through the strait on any given day, along with a substantial share of the world's LNG exports. The absence of viable alternative infrastructure is what transforms Hormuz from a regional concern into a global systemic risk.
| Flow Type | Daily Volume (Approx.) | Alternative Route Capacity |
|---|---|---|
| Crude Oil | ~17-18 million barrels per day | Limited (Suez Canal, East-West Pipeline) |
| LNG Exports | ~30% of global LNG trade | Minimal viable alternatives |
| Refined Products | Significant regional share | Partial rerouting possible |
Historical precedent is instructive here. During the 1980s Tanker War, attacks on commercial shipping in the Gulf created temporary market disruptions, but the global energy infrastructure of that era was less tightly integrated and less dependent on just-in-time LNG delivery systems. Today's energy networks, with their complex multi-modal supply chains linking liquefaction terminals, regasification facilities, and grid-connected power generation, are far more sensitive to route interruption than the relatively simpler oil pipeline systems of the 1970s and 1980s.
The IEA has explicitly framed any sustained Hormuz disruption not as a regional supply problem but as a threat to the integrity of the global energy system itself.
$3.4 Trillion: What the 2026 Investment Numbers Actually Reveal
The headline figure of $3.4 trillion in projected global energy investment for 2026 is significant not because of its absolute size, but because of the dramatic reallocation of capital it represents beneath the surface.
| Investment Category | Projected 2026 Spend | Key Driver |
|---|---|---|
| Total Clean Energy and Infrastructure | ~$2.2 trillion | Energy security plus transition momentum |
| Electricity Supply and Infrastructure | ~$1.6 trillion | Grid resilience demand |
| Power Grids Alone | ~$550 billion | Domestic energy security pivot |
| Renewables | ~$665 billion | Solar-led cost competitiveness |
| Solar Power (subset of renewables) | ~$365 billion | Rapid deployment and fuel-free operation |
| Nuclear | >$80 billion annually | Energy independence narrative |
| Battery Storage | >$100 billion | Grid flexibility requirements |
| Natural Gas | ~$330 billion | LNG export wave, US and Qatar |
| Oil Production | <$500 billion | Third consecutive annual decline |
| Coal | ~$180 billion | Decade-high, China-led |
The ratio embedded in these numbers tells a structural story. For every dollar directed toward fossil fuels, roughly $1.83 is flowing into clean or low-emission energy systems. This is not purely a climate-driven phenomenon. The crisis has accelerated a realisation among governments and institutional investors alike that domestically controlled energy infrastructure, whether renewable generation, nuclear baseload, or grid storage, reduces geopolitical exposure in ways that imported fossil fuels fundamentally cannot.
The strategic reframing of clean energy from a climate obligation to an energy security asset may prove to be one of the most consequential long-term legacies of the 2026 Iran war crisis. Nations that might have delayed clean energy investment on cost grounds now have a powerful security rationale to accelerate.
The Oil Investment Paradox
One of the most analytically revealing aspects of the 2026 investment landscape is the continued decline in oil production investment even as crude prices have risen in response to supply disruption fears. Oil production investment is on track to fall below $500 billion in 2026, marking the third consecutive annual decline.
This apparent paradox has four structural explanations:
- Price signal uncertainty: Investors lack confidence that elevated crude prices reflect durable demand fundamentals rather than temporary conflict-driven risk premiums. Long-cycle oil projects require price visibility across a decade or more, which the current environment cannot provide.
- Supply chain constraints: Equipment, specialised materials, and skilled labour for upstream oil development remain constrained following years of underinvestment, limiting the ability to translate higher prices into new project execution.
- Extended project timelines: The gap between a final investment decision and first production for most major oil projects spans five to ten years, making current spot price signals largely irrelevant to project economics.
- Offshore rig market tightening: Limited rig availability is constraining near-term offshore development capacity, particularly outside the Middle East, where operational risk has simultaneously increased.
The declining oil investment trend predates the current conflict. Furthermore, the Iran war has deepened investor hesitancy by adding a new layer of geopolitical risk that is genuinely difficult to price into long-cycle project models. This creates a slow-motion supply gap that the market may not fully price in until the mid-2030s.
Natural Gas: The Strategic Beneficiary of Global Disruption
If oil is the sector caught between structural headwinds and geopolitical risk, natural gas is the clearest commercial beneficiary of the current crisis.
Natural gas investment is projected to reach $330 billion in 2026, the highest level in approximately a decade. The investment surge is being driven primarily by a new wave of LNG export project sanctions, with the United States and Qatar as the two dominant centres of new liquefaction capacity development.
The strategic logic is compelling. LNG offers something that pipeline gas cannot: route flexibility. A cargo of LNG loaded in Louisiana or Ras Laffan can be redirected mid-voyage to the highest-bidding market, whether that is Northern Europe, Japan, South Korea, or India. This flexibility is precisely what importers are willing to pay a significant premium to access in an environment of persistent route insecurity.
European importers, who spent 2022 and 2023 in emergency procurement mode following the Russian pipeline gas disruption, have been among the most aggressive in signing long-term LNG supply agreements as a deliberate policy of permanent supply diversification. Consequently, shifts in global LNG supply are reshaping how Asian importers also approach their strategies, as many simultaneously try to reduce Hormuz exposure for piped gas while securing enough LNG to sustain industrial and power generation growth.
The LNG projects being sanctioned in 2025 and 2026 will shape global gas supply availability well into the 2030s and potentially the 2040s, given typical LNG project operational lifespans. This is not short-cycle crisis response investment. It is structural reconfiguration of the global gas trade architecture.
Coal's Uncomfortable Comeback
Perhaps the most politically charged aspect of the 2026 investment landscape is the resurgence of coal. Investment in coal is projected to reach $180 billion in 2026, a decade high, with China accounting for nearly 70% of global coal supply spending.
Beyond China, several Asian nations are actively extending the operational life of existing coal-fired power plants rather than retiring them on previously announced schedules. The economic logic is straightforward: a coal-fired plant that is already built and fully depreciated provides dispatchable power at marginal fuel cost, with no exposure to volatile international gas markets or Hormuz-linked supply risk.
This reveals an underappreciated dimension of energy security policy. Nations with abundant domestic coal reserves face a fundamentally different strategic calculus than import-dependent economies. For coal-rich countries, the current crisis validates existing resource strategies. For those without domestic fossil fuel resources, it accelerates the renewable energy solutions and nuclear pivot.
The tension between energy security imperatives and net-zero commitments is not a theoretical future problem. It is the defining policy conflict of 2026, being resolved differently in different capitals based on domestic resource endowments, political economy, and the relative cost of alternatives.
The stranded asset risk embedded in crisis-driven coal investment is real but not immediate. Coal plants extended today under energy security justifications will face a reckoning as clean energy costs continue to fall and carbon pricing mechanisms potentially tighten. The question for investors and policymakers alike is whether the short-term security value justifies the long-term economic exposure.
Electricity Infrastructure: The $1.6 Trillion Security Foundation
Across the entire investment landscape, the most structurally significant single category may be electricity supply and infrastructure, which is approaching $1.6 trillion in 2026. This figure encompasses generation, transmission, distribution, and storage, and it reflects a recognition that physical grid infrastructure is as critical to national energy security as the fuels flowing through it.
Power grid investment alone is projected at approximately $550 billion, reflecting a global acknowledgement that transmission and distribution bottlenecks have become a primary constraint on energy system resilience. A nation with abundant renewable generation capacity but insufficient grid infrastructure to move that power to where it is needed has not actually solved its energy security problem.
Battery storage is crossing the $100 billion threshold for the first time in 2026. This milestone reflects the maturation of grid-scale storage from a demonstration technology to a core infrastructure asset. The surge in battery raw materials demand is, in turn, driving broader investment in upstream supply chains essential for managing the intermittency of high-renewable systems and providing real-time grid flexibility.
Solar power, absorbing roughly $365 billion of the total renewable investment envelope, dominates because it combines three characteristics that are uniquely valuable in a security-driven investment environment: rapid deployment timelines measured in months rather than years, continuously falling levelised cost of energy, and zero fuel import dependency once installed.
The next major ASX story will hit our subscribers first
Historical Parallels and What They Predict About the Long Term
| Crisis | Primary Trigger | Duration | Primary Response | Long-Term Structural Change |
|---|---|---|---|---|
| 1973 OPEC Embargo | Arab-Israeli War | ~6 months | Strategic reserve creation | IEA formation; efficiency standards |
| 1979 Iranian Revolution | Political regime change | Multi-year | Demand destruction; diversification | North Sea and Alaska development; nuclear expansion |
| 2022 Russia-Ukraine War | European gas supply disruption | Ongoing | LNG acceleration; renewables surge | European energy independence pivot |
| 2026 Iran War Crisis | Middle East conflict escalation | Ongoing | Route diversification; domestic production | $3.4 trillion reallocation; LNG decade-high |
The IEA's explicit invocation of the 1970s oil shocks as a parallel is analytically significant. Both the 1973 and 1979 crises produced durable structural changes that reshaped the global energy system for decades. The post-1973 response created the strategic petroleum reserve system and established the IEA itself. The post-1979 response accelerated non-OPEC supply development across the North Sea and Alaska and launched the first serious wave of nuclear expansion programmes in Europe and Asia.
However, as OPEC's market influence continues to evolve alongside these shifts, the IEA energy security crisis Iran war will not be visible in its full structural form for another five to ten years. Nevertheless, the capital allocation decisions being made today will determine the shape of the global energy system through the 2030s and beyond.
The IEA's Near-Term Crisis Management Toolkit
Beyond its analytical and forecasting role, the IEA functions as the coordinating body for member nation energy security responses. Its primary near-term crisis management instrument is the coordinated release of strategic petroleum reserves held across member countries.
This mechanism has been deployed in both the 2011 Libya crisis and the 2022 Russia-Ukraine response, providing temporary price stabilisation by injecting additional supply into tight markets. However, strategic reserves are a buffer measured in weeks to months, not a structural solution to sustained supply route disruption.
The IEA also plays an advisory role in recommending demand-side conservation measures to member governments during acute supply stress periods. These tools include fuel efficiency mandates, transport demand management programmes, industrial load shifting, and emergency fuel substitution frameworks. The increasing importance of demand-side response reflects a wider recognition that supply-side responses, specifically new production capacity, face multi-year lead times that make them structurally inadequate as immediate crisis management tools. Furthermore, the critical minerals demand arising from the energy transition adds yet another layer of complexity to any near-term supply-side strategy.
Three Scenarios for the Path Forward
Scenario 1: Rapid De-escalation. Conflict subsides within six to twelve months. Oil prices normalise. Crisis-driven infrastructure investment in LNG and power grids continues due to structural momentum, but coal life extensions are reversed where economically feasible. The clean energy transition resumes its pre-crisis trajectory.
Scenario 2: Prolonged Instability. Conflict persists across two to four years, with periodic Hormuz disruptions. LNG infrastructure investment accelerates dramatically. Coal capacity additions become permanent rather than temporary. Energy security permanently displaces climate as the primary investment criterion for many governments, creating a lasting deviation from net-zero pathways.
Scenario 3: Hormuz Closure. A sustained closure triggers a global supply shock exceeding any historical precedent. Emergency IEA stock releases prove insufficient. Demand destruction and recession dynamics emerge alongside accelerated domestic energy independence investment across all fuel types and all geographies simultaneously.
The most probable near-term path sits between Scenarios 1 and 2. However, according to the IEA's crisis policy response tracker, the structural investment changes already underway make elements of the prolonged instability scenario durable regardless of how quickly the immediate conflict resolves. Capital committed to LNG terminals, power grids, and nuclear reactors does not reverse when geopolitical conditions improve. It defines the energy landscape for the next generation.
Disclaimer: This article contains forward-looking statements, projections, and scenario analyses based on publicly available IEA reporting and independent research. These do not constitute financial advice. Energy market conditions, geopolitical developments, and investment flows are subject to rapid and material change. Readers should consult qualified financial and energy sector advisors before making investment decisions.
Want to Track the ASX Mining Opportunities Emerging From the Global Energy Security Shift?
As capital reallocates across energy sectors at unprecedented scale, Discovery Alert's proprietary Discovery IQ model scans ASX announcements in real time, instantly identifying significant mineral discoveries tied to critical commodities driving the clean energy and LNG infrastructure boom — from battery materials to uranium. Explore how historic ASX discoveries have delivered extraordinary returns and begin your 14-day free trial today to position yourself ahead of the market.