
July 15, 2026
The Chokepoint That Holds the World Hostage: Understanding Hormuz, Inventory Collapse, and the IEA's Dramatic 2026 Demand Rethink
Few mechanisms in the global economy operate with the concentrated vulnerability of an oil transit chokepoint. Unlike supply chains that can reroute around disruptions, or commodity markets that can shift sourcing across continents, the world's most critical oil passage has no meaningful alternative. When that passage is compromised, the consequences cascade through every downstream market — and the IEA cuts oil demand outlook as Strait of Hormuz reopening nears, presenting one of the most significant single-cycle forecast revisions in the agency's history.
When big ASX news breaks, our subscribers know first
A Forecast Revision Unlike Any Other in Recent Memory
To understand the magnitude of what the IEA announced, it helps to look at the numbers in context rather than in isolation. The agency's previous forecast projected global oil demand growing by roughly 640,000 barrels per day in 2026. Its June revision flipped that entirely, now projecting a year-on-year decline of 1.1 million barrels per day (MMbpd) — a swing of approximately 720,000 bpd within a single reporting cycle.
That is not a gradual softening of the demand picture. It is an abrupt model recalibration forced by an extraordinary geopolitical event compressing into an unusually short window. Furthermore, crude oil price trends heading into mid-2026 reflected precisely this kind of acute disruption dynamic, with prices spiking before partially correcting as diplomatic signals emerged.
The full scope of the revision is captured below:
| Metric | Previous IEA Forecast | June 2026 Revision | Change |
|---|---|---|---|
| 2026 Global Demand Growth | +640,000 bpd | -80,000 bpd | -720,000 bpd swing |
| Full-Year Demand Revision | — | -1.1 MMbpd YoY | -700,000 bpd downgrade |
| Q2 2026 Demand Contraction | — | -1.5 MMbpd | Deepest since COVID-19 |
| 2026 Implied Market Surplus | ~2.46 MMbpd | ~410,000 bpd | -2.05 MMbpd narrowing |
The Q2 2026 figure deserves particular attention. A 1.5 MMbpd demand contraction in a single quarter is a threshold the market had not crossed since the depths of the COVID-19 pandemic. The critical difference, however, is that 2020 was a demand shock driven by the collapse of economic activity.
The 2026 event is primarily a supply-side disruption that induced demand destruction as a secondary effect: conflict restricted physical flows, which drove prices higher, which compressed refiner margins, which reduced end-user consumption. The transmission mechanism is structurally different, and so too will be the recovery pathway.
Key Insight: When supply restriction drives demand down rather than demand collapsing organically, recovery depends on physical infrastructure restoration, not just the return of consumer confidence. This distinction matters enormously for timing the market's eventual normalisation.
Why the Strait of Hormuz Has No Substitute
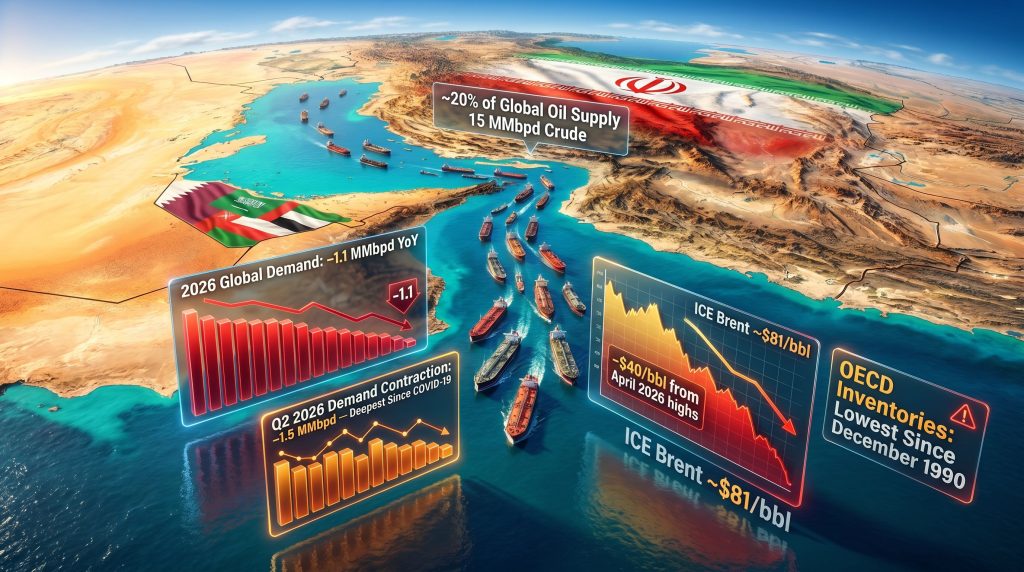
The Strait of Hormuz is a narrow waterway connecting the Persian Gulf to the Gulf of Oman, spanning roughly 21 nautical miles at its narrowest navigable point. Under normal operating conditions, it carries approximately 20% of the world's total oil supply, broken down roughly as:
- ~15 MMbpd of crude oil
- ~5 MMbpd of refined petroleum products
- A significant share of global LNG supply, particularly from Qatar — a dimension explored in detail by analysts tracking global LNG supply vulnerabilities
What makes Hormuz uniquely dangerous as a concentration point is the near-total absence of scalable alternatives. The Petroline pipeline across Saudi Arabia carries roughly 5 MMbpd at maximum capacity, and the Abu Dhabi Crude Oil Pipeline offers additional relief for UAE production, but neither can come close to absorbing the full throughput of Hormuz.
A meaningful disruption to the strait is, for practical purposes, a disruption to the global oil system itself. This is precisely why the IEA explicitly identified the resumption of regular Hormuz flows as the single most consequential variable for restoring stability across global energy supply, pricing, and broader macroeconomic conditions.
How Flow Disruption Moves Through the Supply Chain
The transmission mechanism from geopolitical event to end-user demand destruction follows a reasonably predictable sequence:
- Conflict restricts physical vessel movement through the strait.
- Reduced throughput tightens crude availability for importing refiners.
- Spot crude prices rise sharply as buyers compete for scarce non-Gulf barrels.
- Refiner margins compress as input costs rise faster than product prices can adjust.
- Refiners reduce crude run rates to protect economics, cutting product output.
- Reduced product availability and higher retail prices suppress consumption.
- Aggregate demand statistics register the destruction weeks after the initiating event.
This lag between geopolitical trigger and measured demand impact is one reason forecasting agencies are perpetually behind the curve during acute disruption events. According to UNCTAD's analysis of Hormuz disruptions, the implications for global trade and development extend well beyond the energy sector itself.
Mapping the Physical Damage: From Flow Collapse to Inventory Crisis
The data on Hormuz throughput quantifies exactly how severe the physical disruption became. Traffic through the strait fell to a May 2026 low of approximately 9.6 MMbpd, compared to a pre-conflict baseline of roughly 20 MMbpd. That represents a reduction of more than 50% in the world's most critical oil artery.
By early June 2026, flows had partially recovered to approximately 12 MMbpd, suggesting some restoration of commercial shipping confidence following the interim diplomatic agreement. However, the gap between 12 MMbpd and the pre-conflict 20 MMbpd baseline remains enormous, and operational constraints mean closing that gap will take considerably longer than the diplomatic timeline suggests.
The aggregate supply consequence of this disruption is reflected in the IEA's forecast for global oil supply, which is projected to contract by 3.9 MMbpd in 2026 to reach 102.4 MMbpd.
The Inventory Drawdown: A Crisis Beneath the Price Headlines
While crude price movements tend to dominate market coverage, the inventory data in the IEA's June report may be the more structurally significant story. Global observed oil stocks declined by 143 million barrels in May 2026 alone, equivalent to a drawdown rate of 4.6 MMbpd. Since the onset of the Gulf conflict, inventories have been depleted at an average pace of 3.8 MMbpd.
The OECD government stockpile picture is particularly stark:
- OECD strategic reserves declined by 163 million barrels from the conflict's onset through mid-June 2026.
- These reserves reached their lowest level since December 1990, a period corresponding to the build-up to the first Gulf War.
- The acceleration in drawdown rate reflects both the scale of emergency releases and the absence of commercial replenishment flows.
Warning: Inventory levels last seen during the Gulf War of 1990 represent a structural vulnerability that diplomatic agreements cannot resolve on short notice. Physical restocking of both commercial and strategic reserves requires months of sustained production surplus, not weeks.
The IEA coordinated the release of approximately 400 million barrels of strategic petroleum reserves to buffer the market through the worst of the disruption. While this intervention prevented an outright supply crisis, analysts broadly characterise it as a bridging mechanism with a finite lifespan.
Strategic reserves are not designed to substitute for production, and the act of depleting them creates its own subsequent demand signal: once the crisis resolves, those reserves must be replenished, generating an additional layer of structural demand that will compete with consumption recovery in 2027.
Refinery Throughput: The Downstream Damage
The disruption has propagated deeply into refinery operations globally. The IEA now forecasts global refinery crude runs will contract by 2 MMbpd in 2026 to 82 MMbpd. The regions experiencing the most severe reductions are:
- China — the largest single-country reduction by volume, reflecting the scale of Chinese import dependency on Gulf crude grades.
- The Middle East — direct exposure to conflict-zone supply chain disruption.
- Eurasia — secondary supply chain impacts from redirected trade flows.
- Other Asian markets — high structural dependency on Persian Gulf crude imports.
The Chinese dynamic is particularly worth monitoring. China has invested heavily in refinery capacity configured to process medium-sour Arab grades, the dominant crude type transiting Hormuz. When those grades become unavailable or prohibitively expensive, Chinese refiners cannot simply switch feedstocks without processing adjustments, and the resulting run-rate cuts are larger and slower to reverse than simple price adjustments would imply.
The U.S.-Iran Interim Agreement: What the Market Is Pricing and What It Isn't
The catalyst behind the partial crude price correction from April highs is the interim diplomatic framework between the United States and Iran, which has created a conditional pathway for Persian Gulf export resumption. However, a critical distinction separates the existence of a political agreement from the restoration of reliable commercial oil flows.
In addition, oil market volatility during this period has been amplified by broader trade tensions, making it harder for participants to distinguish geopolitical noise from structural signal.
Operational Constraints the Market May Be Underpricing
The timeline between agreement and normalised exports involves several independent processes, each with its own execution risk:
- Demining operations: Naval mine clearance in and around Hormuz shipping lanes requires coordinated multi-party activity. Estimates suggest weeks of dedicated operations are required before commercial vessels can transit under standard insurance terms.
- Transit protocol re-establishment: Vessel traffic management, naval escort arrangements, and insurance underwriting frameworks all need to be rebuilt from scratch. Lloyd's of London and the international marine insurance market effectively repriced Hormuz transit risk to near-uninsurable levels during the conflict peak, and reversing that designation requires sustained evidence of physical safety.
- Upstream infrastructure restart: Oil fields and associated gathering infrastructure that were partially shut in or damaged during the conflict period cannot be brought back to full output instantaneously. Reservoir management considerations, wellbore integrity checks, and surface facility recommissioning each add time.
Analysts familiar with previous Gulf disruption recovery cycles estimate that approximately two months after a strait reopening would be the minimum timeline before steady, reliable export volumes could be considered restored. Broader market normalisation, including inventory rebuilding and full trade flow normalisation, is more realistically a 2027 story.
The IEA itself has been careful to maintain downside risk language in its base-case scenario, noting that operational and political constraints persist even within an optimistic diplomatic framework. Its base case assumes mid-2026 resumption of regular deliveries, but explicitly models those deliveries at sub-pre-conflict levels for the remainder of the year. Consequently, the oil market downside risks remain material even as the headline diplomatic narrative turns constructive.
Scenario Analysis: If operational delays push the effective export resumption beyond the IEA's mid-2026 base case, current market pricing may prove premature. Brent crude has already corrected approximately $40/bbl from its April 2026 peak to trade near $81–82/bbl by mid-June. A reopening delay of even four to six weeks relative to consensus expectations could trigger a significant re-pricing event to the upside.
Benchmarking 2026 Against Historical Oil Market Shocks
Context is essential when evaluating whether the market's current response is proportionate to the disruption's severity. The table below places the 2026 Hormuz disruption alongside comparable historical events:
| Event | Demand/Supply Impact | Duration | Recovery Timeline |
|---|---|---|---|
| COVID-19 (2020) | -9 MMbpd peak demand | ~12 months | 18–24 months |
| 1973 Arab Oil Embargo | -2 to -3 MMbpd | ~6 months | 12+ months |
| Gulf War (1990–91) | ~4 MMbpd disruption | ~6 months | 6–9 months |
| 2026 Hormuz Disruption | -3.9 MMbpd supply; -1.5 MMbpd Q2 demand | Ongoing | 2027 projected |
The 2026 event sits between the Gulf War and COVID-19 in terms of raw supply impact, but its nature is closer to 1973 than to 2020. The 1973 embargo was also a supply-side restriction that induced demand destruction through price mechanism, and that episode required over a year of sustained market adjustment before structural normalisation was achieved. The recovery was not linear, and neither should the 2026 recovery be assumed to be.
The next major ASX story will hit our subscribers first
The 2027 Rebound Scenario: Reading the Supply Surge and Its Implications
The IEA's multi-year projection creates a striking contrast between 2026 and 2027 market conditions:
| Metric | 2026 Forecast | 2027 Forecast | Change |
|---|---|---|---|
| Global Oil Supply | 102.4 MMbpd | 110.3 MMbpd | +7.9 MMbpd |
| Global Oil Demand | ~103.3 MMbpd | 105.3 MMbpd | +2.0 MMbpd |
| Implied Balance | Tight/deficit | Surplus | Significant surplus |
An 8 MMbpd supply increase in a single year would represent one of the largest documented annual supply expansions in modern oil market history. The combination of returning Gulf production, non-OPEC+ growth continuity, and the cessation of conflict-era production shut-ins all compound simultaneously.
For market participants, the 2027 surplus projection carries several layered implications:
- Strategic inventory replenishment will absorb a portion of the surplus, partially offsetting downward price pressure.
- OPEC+ production discipline will face its most significant internal test since 2020, as member states with constrained output during the conflict will push to restore volumes. Indeed, OPEC's market influence will be central to determining whether surplus conditions translate directly into price weakness or are managed through coordinated restraint.
- Commercial inventory rebuilding by end-users, refiners, and trading houses will create a secondary demand wave that supports prices above what pure consumption metrics would imply.
- Refinery restart and expansion decisions that were deferred during 2025–2026 will return to the investment agenda, adding medium-term complexity to the supply picture.
What Energy Market Participants Should Be Watching
Near-Term Signals (Next 60–90 Days)
- Weekly Hormuz throughput data will be the primary leading indicator for physical market tightness.
- Progress reports on mine clearance operations and the resumption of commercial marine insurance coverage for Hormuz transits.
- IEA emergency reserve deployment rate and remaining accessible capacity.
- OPEC+ production committee decisions as Gulf member states assess the pace of supply restoration.
Medium-Term Structural Questions (2026–2027)
- Whether upstream restart timelines in Iran, Iraq, Kuwait, and the UAE align with the IEA's 2027 supply projection or face technical delays.
- The pace at which OECD strategic reserves can realistically be replenished, given that restocking itself creates demand.
- Chinese refinery crude run recovery and its implications for medium-sour crude grade pricing differentials.
- Whether the current $81–82/bbl Brent price level reflects an accurate base-case reopening scenario or whether it has already priced an optimistic outcome that operational realities will challenge.
Investment Consideration: The asymmetry in the current setup is meaningful. If Hormuz normalisation proceeds on schedule, the price downside is limited given inventory deficits that still need rebuilding. If normalisation is delayed, the upside re-pricing risk is substantial. That asymmetric distribution of outcomes is worth careful consideration when constructing energy exposure over the next two to three quarters.
Frequently Asked Questions: IEA Oil Demand Outlook and the Hormuz Situation
What exactly did the IEA revise in its June 2026 oil demand forecast?
The IEA downgraded its 2026 global oil demand projection by approximately 700,000 bpd from its previous estimate. Rather than expecting demand growth, the agency now projects a year-on-year decline of 1.1 MMbpd, driven by higher consumer fuel prices and dramatically reduced product availability resulting from Persian Gulf supply disruptions. The IEA's Oil Market Report series provides the full methodological detail behind these revisions.
Why can't global oil supply simply reroute around the Strait of Hormuz?
The strait handles roughly 20% of all global oil flows under normal conditions, approximately 20 MMbpd in combined crude and product volumes. Existing pipeline alternatives in the region can handle only a fraction of that throughput, and rerouting tankers around the Arabian Peninsula adds weeks to transit times, compounding the effective supply reduction.
How long before oil markets fully normalise after Hormuz reopens?
Based on IEA projections and analyst assessments of prior disruption recovery cycles, a minimum of two months from strait reopening is required before steady commercial export volumes can be expected. Full market normalisation, including inventory rebuilding and upstream infrastructure recommissioning, is more realistically a 2027 horizon. As the IEA cuts oil demand outlook as Strait of Hormuz reopening nears, the agency is careful to emphasise that diplomatic timelines and operational timelines are not the same thing.
What is the IEA projecting for global oil supply in 2027?
The IEA forecasts a rebound of approximately 8 MMbpd, bringing global supply to 110.3 MMbpd in 2027. This recovery, combined with demand growth of 2 MMbpd to 105.3 MMbpd, implies a significant market surplus that would support inventory restocking. The EIA's global oil outlook offers a complementary perspective on these forward supply projections.
How depleted are global oil inventories?
OECD government stockpiles have dropped to their lowest level since December 1990, having declined by 163 million barrels since the start of the Gulf conflict. Global observed inventories fell by 143 million barrels in May 2026 alone, equivalent to a drawdown rate of 4.6 MMbpd.
Disclaimer: This article contains forward-looking projections sourced from the IEA's June 2026 Oil Market Report and independent analytical commentary. Forecasts are inherently uncertain and subject to revision based on geopolitical, operational, and economic developments. Nothing in this article constitutes financial or investment advice. Readers should conduct their own due diligence before making any investment decisions related to energy markets or commodity-linked assets.
For additional institutional analysis on global oil market dynamics, readers can consult the IEA's Oil Market Report series at iea.org and industry coverage from World Oil at worldoil.com.
Want to Capitalise on the Next Major Resource Discovery Before the Broader Market Reacts?
While oil market disruptions reshape global energy dynamics, significant mineral discoveries on the ASX continue to create asymmetric opportunities for well-positioned investors — and Discovery Alert's proprietary Discovery IQ model delivers real-time alerts the moment those discoveries are announced, turning complex data across more than 30 commodities into clear, actionable insights. Explore Discovery Alert's dedicated discoveries page to understand how historic finds have generated substantial returns, and begin a 14-day free trial today to ensure you are positioned ahead of the market.