July 10, 2026
The Hidden Mechanics of an Oil Market in Partial Recovery
Few events in modern energy history have tested the architecture of global oil supply as severely as a prolonged closure of the world's most consequential maritime chokepoint. The Strait of Hormuz is not simply a shipping lane — it is the circulatory system of Gulf energy exports, and when that system seizes, the downstream consequences ripple across refineries, fuel terminals, and consumer markets on every inhabited continent. Understanding the IEA oil forecast and Strait of Hormuz reopening dynamics requires looking beyond the headline supply rebound numbers and examining the structural fragilities that a partial recovery cannot disguise.
The June 2026 data, captured in the IEA's July Oil Market Report, tells a story of meaningful but deeply incomplete normalisation. The numbers confirm progress. They also confirm how far the market remains from stability.
When big ASX news breaks, our subscribers know first
A Supply Shock Unlike Anything in Modern Energy Memory
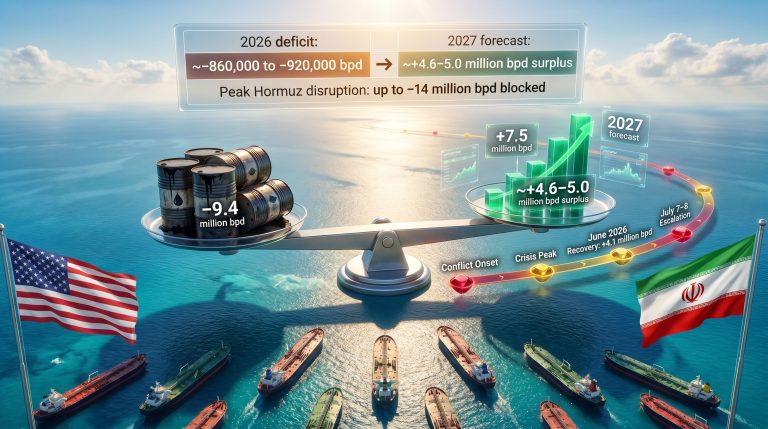
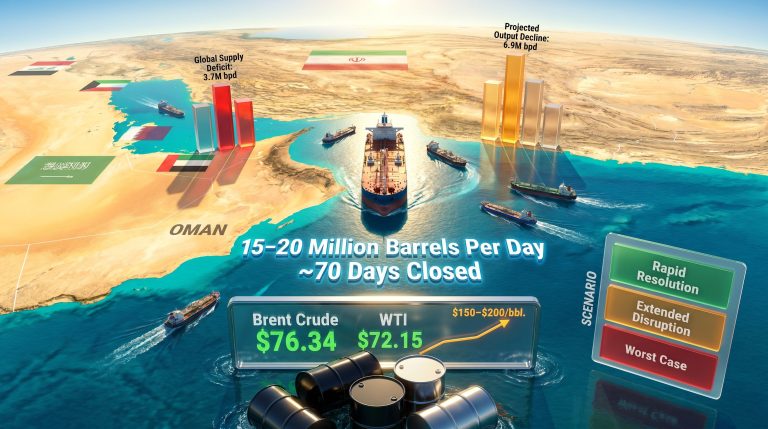
To appreciate the scale of what occurred, consider that the Strait of Hormuz typically facilitates the transit of roughly 24 million barrels per day of Gulf oil exports under normal operating conditions. At the peak of the conflict-driven disruption, approximately 14 million bpd of crude flows were knocked offline — a volume equivalent to roughly 14% of total global daily consumption vanishing from accessible supply almost simultaneously.
The closure persisted for more than 100 days, during which time approximately 10 million bpd of oil supply and an estimated 300 million cubic meters per day of LNG were disrupted. There is no modern precedent for unwinding a supply interruption of this magnitude across both crude oil and liquefied natural gas simultaneously. Furthermore, the global LNG supply disruption created downstream tightness across Asian and European import terminals that extended well beyond the crude oil shock itself.
Global oil demand reflected the shock directly. Consumption bottomed at 97.9 million bpd in May 2026, representing a year-on-year decline of 5.3 million bpd — the steepest contraction recorded outside of the COVID-19 pandemic era, when travel restrictions and industrial shutdowns compressed demand across multiple economic sectors simultaneously.
Pre-War vs. June 2026: The Recovery Gap in Numbers
| Metric | Pre-War Level | June 2026 Level | Remaining Gap |
|---|---|---|---|
| Global oil supply | ~108.2 million bpd | 98.8 million bpd | -9.4 million bpd |
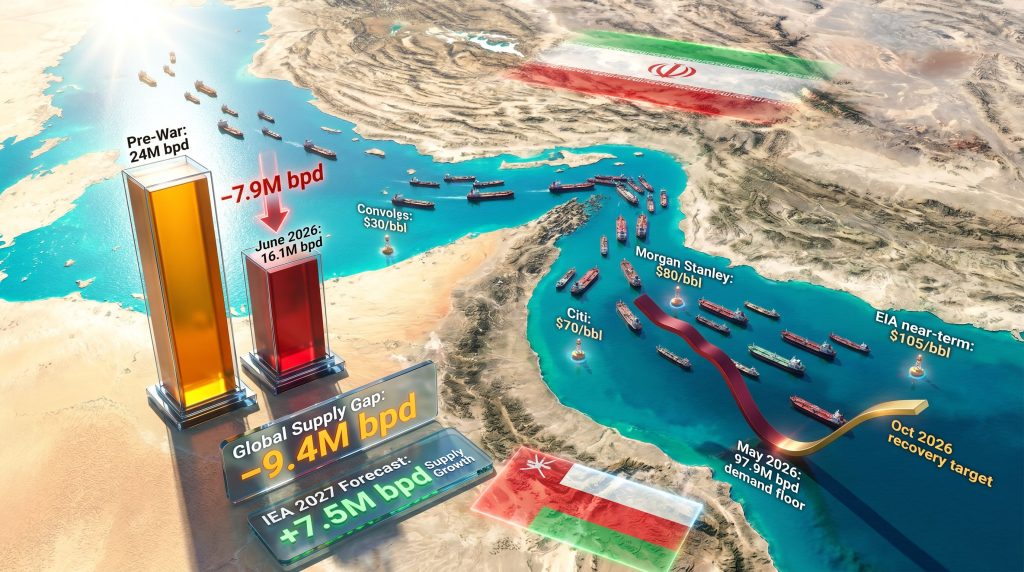
| Gulf oil exports (total) | 24 million bpd | 16.1 million bpd | -7.9 million bpd |
| Gulf crude production | ~14.9 million bpd est. | ~3.5 million bpd below pre-war | -11.4 million bpd |
| Global refinery runs | Baseline | Down 6 million bpd YoY | Significant deficit |
| Refined products/LPG exports | Pre-war baseline | Below 50% of pre-war levels | Over 50% shortfall |
Even after the ceasefire-driven June recovery, global oil supply remained nearly 9.4 million bpd below pre-war output — confirming that a ceasefire creates the conditions for recovery but does not itself constitute one.
What the June 2026 Rebound Actually Represents
Global oil supply rose by 4.1 million bpd in June, reaching 98.8 million bpd, as the US-Iran ceasefire enabled tankers that had been stranded in or near the Strait to resume voyages. Total Gulf oil exports surged by 6.5 million bpd during the month to reach 16.1 million bpd — a figure that sounds impressive until it is measured against the pre-war average of 24 million bpd, leaving a shortfall of 7.9 million bpd still to be closed.
Crude and condensates represented 85% of the monthly export increase, supported in meaningful part by drawdowns of floating storage and onshore inventories that had accumulated during the conflict period. This distinction matters considerably for interpreting the headline number: a significant portion of the June export surge represented the release of pre-existing stockpiles rather than newly produced barrels entering the market.
Gulf production itself rose by a more modest 3.5 million bpd in June, leaving upstream output 11.4 million bpd short of pre-war capacity — a gap that underscores how much genuine field-level restart activity still needs to occur before supply recovery becomes self-sustaining. For a broader perspective on the crude oil market overview heading into this period, prior structural conditions had already signalled vulnerability.
Floating Storage and the Inventory Illusion
Global observed oil inventories posted their first increase in four months during June, rising by 21 million barrels. On the surface, this appears to signal meaningful market re-supply. Beneath the surface, however, the composition of that build tells a more cautious story.
Oil-on-water volumes surged by 117 million barrels, while onshore draws of approximately 96 million barrels continued — including 44 million barrels of OECD government stock releases. OECD stocks overall fell 62 million barrels in June, following a 73 million barrel decline in May. Non-OECD crude stocks eased by 37 million barrels, with China accounting for 41 million barrels of that draw.
The headline inventory build in June was largely driven by oil-on-water accumulation — tankers in transit rather than barrels available for immediate delivery. The increase overstates the degree of genuine market re-supply in the physical sense.
This distinction between oil-on-water and deliverable onshore inventory is one of the most frequently overlooked analytical variables in assessing post-disruption recovery speed. Tankers in transit represent supply that is still days or weeks away from a refinery intake point, and in a market where refinery operations themselves remain disrupted, even deliverable crude creates limited immediate relief.
The IEA's Conditional Surplus: What the 2026 and 2027 Forecasts Actually Say
The IEA's July 2026 Oil Market Report revised its 2026 global supply decline forecast modestly upward, from a previously projected -3.9 million bpd to -3.7 million bpd, reflecting the partial June recovery. For 2027, the agency projects supply growth of 7.5 million bpd — but attaches explicit conditions to that projection. The IEA oil forecast and Strait of Hormuz reopening dynamics, as Reuters noted, point to a gradual recovery tipping into a significant 2027 surplus only under favourable conditions.
IEA Supply and Demand Projections: 2026 and 2027
| Forecast Variable | 2026 Projection | 2027 Projection |
|---|---|---|
| Global supply change | -3.7 million bpd (annual avg.) | +7.5 million bpd growth |
| Global demand change | -1.0 million bpd (annual avg.) | +2.0 million bpd rebound |
| Global refinery runs | -2.4 million bpd | +3.1 million bpd |
| Demand seasonal peak | Above 2025 levels by October 2026 | Full recovery trajectory |
The 2027 surplus scenario requires three simultaneous conditions to hold: continued improvement in Strait of Hormuz transit volumes, coordinated upstream field restarts across multiple sovereign producers, and the resumption of refinery operations across the Gulf region. The failure of any one of these conditions would compress or eliminate the projected surplus.
Global demand, having bottomed in May, is expected to rise by more than 8 million bpd by October 2026, pushing consumption above 2025 levels for the first time since February. Even so, the full-year 2026 average is projected to decline by 1 million bpd, reflecting the depth of the earlier demand compression.
It is worth noting the contrast with prior IEA demand forecasting cycles. Before the conflict disrupted baseline assumptions, the agency had projected demand growth of 680,000 bpd in 2024 and 700,000 bpd in 2026, with global consumption targeting 104.4 million bpd — figures now displaced significantly by the structural shock of a prolonged Hormuz closure.
Four Structural Barriers to Full Hormuz Normalisation
Operational reality imposes constraints that no ceasefire agreement can immediately dissolve. Four distinct categories of obstruction stand between the current partial recovery and the full-scale normalisation that the IEA's surplus forecast requires.
-
Clearing stranded vessels: Approximately 500 trapped ships and thousands of sailors remain in the Strait zone. An estimated 118 tankers stranded specifically within the Persian Gulf require prioritised exit clearance before inbound traffic can scale meaningfully.
-
Scaling tanker traffic: Analysts project tanker entries could rise to roughly 12 vessels per day — approximately 50% of pre-war levels — within 30 days of a formal reopening, but restoring full pre-war traffic volumes will take considerably longer.
-
Restarting upstream production: Gulf crude output remains 11.4 million bpd below pre-war levels, requiring coordinated field restart operations across multiple sovereign producers, each with their own infrastructure conditions, workforce availability, and reservoir management requirements.
-
Repairing physical infrastructure: Sea mines, damaged port facilities, and degraded export terminal equipment represent physical constraints entirely independent of any political agreement. Mine clearance operations alone typically proceed over weeks to months, not days.
Projected Reopening Timeline: Phase by Phase
| Phase | Timeframe | Key Milestone |
|---|---|---|
| Initial agreement signed | July 2026 (Switzerland) | Formal ceasefire framework |
| Stranded tanker clearance | Within 15 days | ~118 Persian Gulf tankers exit |
| Traffic at 50% of pre-war | Within 30 days | ~12 tanker entries per day |
| Toll-free passage window | 60 days post-reopening | Iran/Oman joint management begins |
| Full pre-conflict production | Early 2027 (EIA estimate) | Complete upstream restart |
Adding complexity to the political dimension: transit fee arrangements for the Strait following the initial 60-day toll-free window are expected to fall under joint Iran and Oman management. Deep structural mistrust between the United States and Iran over these arrangements introduces an additional source of ongoing uncertainty into the recovery timeline, beyond purely operational considerations.
Crude Oil Price Dynamics: Volatility as a Geopolitical Barometer
Price behaviour through the June-July 2026 period illustrated how sensitively benchmark crude responds to geopolitical signals, both positive and negative. Benchmark North Sea Dated crude fell $31 per barrel over the course of June, declining to approximately $68 per barrel — its lowest level since January and roughly $2 below pre-war pricing — as the ceasefire underpinned recovering Hormuz flows. The oil price shock experienced in prior cycles had already conditioned executives to anticipate rapid and severe repricing events of this nature.
Following the resumption of hostilities on 7-8 July 2026, prices rebounded sharply to approximately $77 per barrel at the time of the IEA's July report publication. The initial Brent crude response to the reopening agreement had seen prices fall to $79 per barrel, broadly consistent with pre-war baseline levels.
What Major Banks Are Forecasting for 2026-2027
| Institution | Price Forecast | Key Assumption |
|---|---|---|
| Morgan Stanley | $80/barrel | Continued oversupply trajectory |
| Goldman Sachs | $80/barrel | Gradual Hormuz normalisation |
| Citi | $70/barrel | Accelerated surplus materialisation |
| EIA (near-term) | $105/barrel | Strait effectively closed Q2/Q3 2026 |
| EIA (post-reopening) | $79/barrel by 2027 | Full pre-conflict flows restored |
The $35/barrel spread between Citi's $70/barrel forecast and the EIA's near-term $105/barrel assumption is not primarily a disagreement between analysts — it is a direct reflection of the binary uncertainty embedded in the pace and permanence of Hormuz reopening.
For investors and procurement teams, this price range is itself a critical piece of information. Planning against either end of that spread without accounting for scenario probability distributions introduces material financial risk.
The next major ASX story will hit our subscribers first
The Refined Products Market: The Overlooked Crisis Within the Crisis
While crude oil flows recovered to approximately three-quarters of pre-war rates by June, the refined products market presents a structurally different picture — and one with more immediate consequences for consumers and industrial users globally.
Gulf exports of refined products and LPG remained below 50% of pre-war levels in June, as key regional export refineries had not yet resumed operations. Global refinery runs rose 1.5 million bpd in June but remained 6 million bpd below year-ago levels, with Middle East export refineries still offline and Asian refiners operating at reduced throughput rates.
The consequence was predictable and acute: refined product crack spreads and refinery margins climbed to four-year highs in early July 2026, driven by the structural disconnect between a relatively well-supplied crude market and a persistently tight product market. Consequently, the European gas price impact was compounded by downstream product shortfalls extending well beyond the Gulf region itself.
The Russian Refinery Compounding Effect
An additional variable amplified the product tightness beyond what the Hormuz closure alone would have generated. Intensifying Ukrainian strikes on Russian refining and export infrastructure tightened global diesel, jet fuel, and distillate markets further during this period. This dual-source product shortfall — Middle East refinery outages combined with Russian infrastructure damage — created a refinery margin environment not seen since at least 2022.
The layering of two geographically distinct refinery disruption events into the same market window is a relatively rare phenomenon in modern oil market history. Furthermore, when multiple product supply chains are simultaneously constrained by unrelated geopolitical events, the recovery timelines for each chain become interdependent in ways that make straightforward linear forecasting unreliable.
The July Escalation and What It Means for the Surplus Forecast
The IEA's July 2026 Oil Market Report directly flagged the 7-8 July escalation as a material risk capable of fundamentally disrupting its baseline forecast of a market surplus by late 2026 or into 2027. The agency's surplus projection for 2027, built on 7.5 million bpd of supply growth, requires not just a ceasefire but an uninterrupted sequence of operational improvements across transit, production, and refining simultaneously. The IEA's detailed analysis of how global oil supplies have readjusted to fill the gap left by the Hormuz shock provides essential context for understanding the scale of the challenge ahead.
Three Scenarios and Their Price Implications
| Scenario | Key Condition | Price Implication | Surplus Timing |
|---|---|---|---|
| Base Case (IEA) | Swift de-escalation, Hormuz normalises | $75-$80/barrel | Late 2026 / 2027 |
| Downside Risk | Prolonged hostilities, transit disrupted | $90-$105/barrel | Delayed to 2028+ |
| Upside Case | Rapid full reopening, field restarts accelerate | $65-$70/barrel | Mid-2026 possible |
The IEA's own assessment frames the geopolitical variable, rather than the operational recovery timeline, as the binding constraint on its surplus forecast. The agency noted that renewed exchanges of fire in the Gulf highlight the risks of failing to reach a lasting peace agreement, describing such an agreement as a prerequisite for oil market normalisation. This framing is significant: it positions the IEA oil forecast and Strait of Hormuz reopening trajectory not as a function of OPEC+ production decisions or non-OPEC supply growth, but as contingent on a diplomatic outcome that remains outside the agency's modelling control. In addition, the trade war oil impact of ongoing geopolitical tensions has further complicated the demand-side assumptions underpinning the 2027 surplus scenario.
Frequently Asked Questions: IEA Oil Forecast and Strait of Hormuz Reopening
What is the IEA's current oil supply forecast for 2026?
The IEA projects global oil supply to decline by an average of 3.7 million bpd in 2026, a slight improvement from its earlier estimate of a 3.9 million bpd decline, contingent on de-escalation of renewed US-Iran hostilities and continued recovery in Strait of Hormuz transit volumes.
How much oil flows through the Strait of Hormuz?
Under pre-war conditions, the Strait facilitated approximately 24 million bpd of Gulf oil exports. During the conflict, up to 14 million bpd of crude flows were disrupted. By June 2026, Gulf exports had recovered to 16.1 million bpd, representing approximately 67% of pre-war export volumes.
When will the Strait of Hormuz fully reopen?
Analysts estimate tanker traffic could reach 50% of pre-war levels within 30 days of a formal reopening agreement. The US Energy Information Administration does not anticipate a return to full pre-conflict production levels until early 2027, given the scale of infrastructure repair, mine clearance, and field restart operations required.
Why are refined product prices rising even as crude prices fall?
Gulf export refineries, which supply a significant share of global diesel, jet fuel, and LPG, had not resumed operations as of the June 2026 reporting period even as crude flows partially recovered. This structural lag pushed refinery crack spreads to four-year highs in early July 2026.
How has the Hormuz closure affected LNG markets?
The closure disrupted approximately 300 million cubic meters per day of LNG for more than 100 days, a volume disruption without modern precedent in global gas markets, creating downstream tightness across Asian and European import terminals that extended well beyond the crude oil disruption itself.
Key Takeaways for Market Participants
-
Supply recovery is real but structurally incomplete: June's 4.1 million bpd rebound is meaningful progress, yet the 9.4 million bpd gap to pre-war output confirms the market remains in a materially disrupted state with no near-term path to full normalisation.
-
The refined products crisis is the most underappreciated dimension of this event: With Gulf export refineries still offline and Russian infrastructure under attack, product markets are structurally tighter than crude markets, with direct implications for consumer fuel prices globally.
-
The 2027 surplus is a conditional forecast, not a guaranteed outcome: The IEA's projection of 7.5 million bpd supply growth in 2027 depends entirely on geopolitical stability, infrastructure repair, and uninterrupted Hormuz transit. These are variables outside any agency's control.
-
The $35/barrel institutional price spread reflects genuine market uncertainty: The range between the most bearish forecast (Citi at $70) and the most conservative near-term assumption (EIA at $105) is not analytical noise — it is an honest representation of the binary uncertainty embedded in Hormuz recovery scenarios.
-
Lasting peace is the irreducible precondition for normalisation: The IEA's own report identifies a durable political resolution between the United States and Iran as the structural prerequisite for oil market recovery — not merely a ceasefire, and not merely an operational restart.
Disclaimer: This article contains forward-looking statements, institutional forecasts, and scenario analysis sourced from publicly available reports including the IEA's July 2026 Oil Market Report. Forecasts are inherently uncertain and subject to revision. Nothing in this article constitutes financial or investment advice. Readers should conduct independent research and seek professional guidance before making decisions based on energy market projections.
Want to Stay Ahead of the Next Major Commodity Shift?
While oil markets navigate the structural aftermath of the Hormuz disruption, significant mineral discoveries on the ASX are creating their own market-moving opportunities — and Discovery Alert's proprietary Discovery IQ model delivers real-time alerts the moment they emerge, translating complex commodity data into clear, actionable insights for investors at every level. Explore how historic discoveries have generated substantial returns on Discovery Alert's dedicated discoveries page, and begin a 14-day free trial to position yourself ahead of the broader market.