July 10, 2026
The World's Most Vulnerable Shipping Lane and Why Every Economy Depends on It
Few geographic features carry the economic weight of a 6-kilometre-wide passage connecting two bodies of water in the Persian Gulf. Yet the Strait of Hormuz oil supply disruption has become the defining variable in global inflation trajectories, monetary policy decisions, and geopolitical realignment. Before the events of early 2026, it was already the most scrutinised chokepoint in commodity markets. Now, following the longest sustained closure in its recorded history, its consequences are being felt across every major economy.
Understanding what has unfolded requires more than tracking oil price volatility. It demands a structural examination of why this waterway exists as an irreplaceable node, what forces conspired to close it, and what the cascading consequences mean for economies far removed from the Persian Gulf itself.
When big ASX news breaks, our subscribers know first
Why the Strait of Hormuz Controls the Global Energy System
The Strait of Hormuz connects the Persian Gulf to the Gulf of Oman, forming the only viable maritime exit for the majority of crude oil exports originating in the Middle East. At its narrowest navigable point, each directional shipping lane measures roughly 3.2 kilometres wide — a geographic constraint with no functional equivalent anywhere in global trade infrastructure.
The nations whose export economics depend substantially or entirely on Hormuz transit include Iran, Iraq, Kuwait, the UAE, Qatar, and Saudi Arabia's eastern terminal operations. Under normal conditions, approximately 20% of total global daily oil and gas consumption passes through the strait, equating to an estimated 15 to 20 million barrels per day.
The waterway also handles a substantial share of global LNG supply exports, particularly from Qatar, which ranks among the world's largest LNG producers. This dual role in crude and LNG transit means that a Hormuz disruption does not merely affect oil markets — it simultaneously compresses petrochemical supply chains, fertilizer production, and power generation capacity across multiple continents.
No single land-based or maritime alternative can replicate this combined volume capacity, which is why energy security analysts have long described Hormuz as the arterial pressure point of the global hydrocarbon system. Any sustained closure triggers simultaneous cascading effects across energy markets, aviation, agriculture, and industrial manufacturing.
The Geopolitical Trigger: How the 2026 Conflict Closed the Strait
The current Strait of Hormuz oil supply disruption originated with a U.S.-Iran military conflict that escalated sharply in late February 2026. U.S. and Israeli strikes on Iranian territory triggered retaliatory attacks by Iranian armed forces on U.S. military infrastructure positioned across Gulf states, shattering a three-week ceasefire that had momentarily stabilised the region.
A critical turning point was the death of Iran's Supreme Leader, Ayatollah Ali Khamenei, who was killed on the opening day of the conflict on February 28, 2026. The removal of that central authority created a significant vacuum within Iran's command structure, deepening uncertainty around the country's military decision-making processes and complicating any pathway toward negotiated resolution.
Subsequent explosions reported across southern Iran, including near Bushehr — the site of one of the country's nuclear facilities — amplified risk perception across commodity markets. Tanker operators, reacting to ship-tracking data that confirmed movements through the strait had fallen to near standstill, suspended or rerouted transits while conducting risk assessments.
A particularly significant incident involved an attack by Iranian forces on a Qatari LNG vessel exiting the waterway near Oman. That strike signalled a deliberate willingness to target commercial energy shipping rather than limiting hostilities to military infrastructure, and it materially changed how vessel owners and insurers priced the transit risk.
Furthermore, reports indicated that a limited number of tankers were gaining passage through the strait only by paying tolls directly to the Islamic Revolutionary Guard Corps (IRGC), introducing an unprecedented dynamic to what had previously been treated as international open waters. The broader geopolitical risk landscape across the region has consequently shifted in ways that extend well beyond the immediate conflict.
The Scale of the Disruption: Numbers That Reframe the Crisis
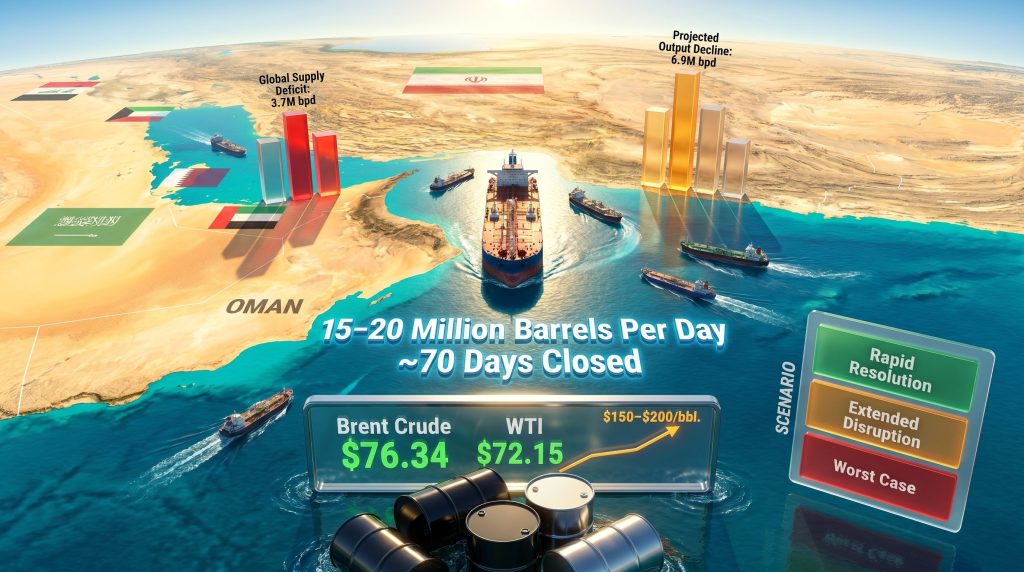
As of July 2026, the strait has been effectively closed or severely restricted for approximately 70 consecutive days — the longest such disruption in the waterway's recorded history. The figures below contextualise the supply shock against both the immediate market data and historical precedents.
| Metric | Figure |
|---|---|
| Daily oil volume normally transiting Hormuz | 15–20 million barrels per day |
| Estimated global supply deficit (Q2 2026) | 3.7 million barrels per day |
| Projected global output decline | 6.9 million barrels per day |
| Duration of closure (as of July 2026) | ~70 days |
| IEA emergency reserve release | 400 million barrels |
| Projected reserve depletion timeline | July–August 2026 |
For historical context, the 1973 Arab oil embargo removed approximately 4 to 5 million barrels per day from global supply and is widely regarded as the most economically damaging energy shock of the twentieth century. The current disruption has, however, effectively removed up to 20% of global daily supply from reliable transit — a proportional impact roughly 2.5 to 3 times larger than the 1973 crisis, and one that has now persisted far longer.
Unlike previous disruptions, which resolved within weeks, the structural closure of Hormuz for 70-plus days has allowed downstream inventory drawdowns to compound across multiple sectors simultaneously. The 1990 Gulf War disruption, the 2011 Libya crisis, and the 2019 Abqaiq drone attack — all previously treated as benchmark stress events — are materially smaller in both scale and duration by comparison. According to analysis from the Brookings Institution on the Strait of Hormuz and global oil markets, no previous chokepoint event has combined this magnitude of volume loss with this duration of closure.
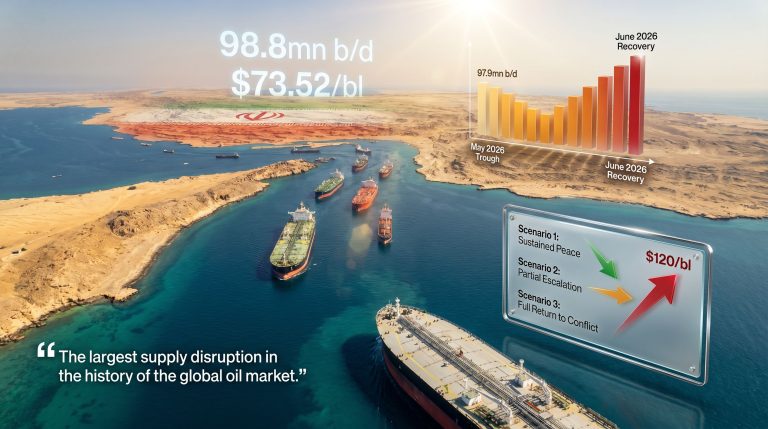
Energy analysts and institutional commentators have characterised the current situation as the largest supply disruption in the history of the global oil market, a designation that carries significant weight given the depth of historical precedents against which it is being measured.
Oil Price Movements: Brent, WTI, and the Risk Premium Architecture
Brent crude was trading at approximately $76.34 per barrel as of July 10, 2026, reflecting a weekly gain of approximately 6%. WTI crude was positioned at approximately $72.15 per barrel, tracking a weekly increase of roughly 5%. Both figures represent a pullback from mid-week highs recorded earlier in the week.
The moderate pullback from those highs reflects a specific market dynamic that commodity analysts have been tracking closely. Vandana Hari of Vanda Insights noted that while Hormuz transits remain at near-standstill with no clear timeline for normalisation, the market's confidence in a return to U.S.-Iran diplomacy is actively placing a ceiling on upside price momentum. This diplomatic expectation is consequently functioning as an implicit cap on the risk premium that would otherwise push prices toward their theoretical ceiling.
ANZ Bank Senior Commodity Strategist Daniel Hynes pointed to a specific market signal that reinforced this psychology: the Trump administration's decision to conduct strikes on Iranian military sites while deliberately avoiding Iranian energy infrastructure. Markets interpreted this targeting restraint as a deliberate effort to preserve negotiating space. Combined with presidential statements suggesting a full-scale conflict resumption was not anticipated, this dual signal provided partial reassurance to crude traders.
The trajectory from the initial shock to the current pricing environment is important context:
- Brent crude surged approximately 65% in March 2026 following the strait's initial closure, reaching record highs as markets priced in an extended disruption scenario
- Analyst projections from multiple institutional sources suggest prices could reach $150 to $200 per barrel if the closure persists without a negotiated resolution
- U.S. retail gasoline prices are projected to exceed $6 per gallon under an extended disruption scenario
- The current price level reflects the tension between a fundamental supply deficit and a diplomatic optimism premium that is suppressing what would otherwise be a more severe pricing reaction
Downstream Consequences: Who Else Pays the Price?
The Strait of Hormuz oil supply disruption extends well beyond crude benchmarks. The secondary and tertiary economic effects are now materialising across multiple sectors with varying degrees of severity.
Aviation and Jet Fuel Markets
A severe jet fuel shortage has emerged across European aviation markets, driven by the combined loss of Middle Eastern refinery output and disrupted LNG-linked petrochemical supply chains. Tens of thousands of flight cancellations have been recorded across European carriers, with cascading impacts on tourism, logistics, and business travel networks. Jet fuel has limited short-term substitution options, making aviation among the most immediately exposed sectors to any sustained disruption of Gulf energy flows.
Agriculture and Fertilizer Supply Chains
Natural gas is a primary feedstock for nitrogen-based fertilizers, and Gulf producers who depend on Hormuz for export have been unable to fulfil contracted volumes. The resulting fertilizer supply shortages are creating medium-term food security risks, particularly for import-dependent agricultural economies across South Asia and East Africa, where growing season timing amplifies the vulnerability.
U.S. Domestic Crude Inventory Drawdowns
U.S. domestic crude inventories have experienced significant accelerated drawdowns as refiners attempt to compensate for reduced import volumes. The rate of depletion raises concerns about whether domestic supply buffers are adequate if the disruption extends through Q3 2026 without relief from emergency reserve releases.
Industrial Manufacturing Sector
Energy-intensive industries including steel, cement, chemicals, and plastics face sharp input cost surges. Compressed margins are beginning to trigger production curtailments in price-sensitive markets, a dynamic that feeds broader economic slowdown risk across manufacturing-dependent economies.
The next major ASX story will hit our subscribers first
The Pipeline Bypass Reality: Why Alternatives Cannot Fill the Gap
Saudi Arabia and the UAE have both activated pipeline infrastructure designed to route crude exports around the strait. The data on what these alternatives can deliver, however, reveals a significant structural gap.
| Alternative Route | Operator | Capacity (bpd) | Limitation |
|---|---|---|---|
| Saudi East-West Pipeline (Petroline) | Saudi Aramco | ~7 million bpd | Cannot replace full Hormuz volume |
| UAE Habshan-Fujairah Pipeline | ADNOC | ~1.5 million bpd | Limited to UAE export volumes only |
| Iraq-Turkey Pipeline (Kirkuk-Ceyhan) | Various | ~0.4–0.6 million bpd | Chronic operational disruptions |
Even with Saudi Arabia's East-West Pipeline reportedly operating at or near its 7 million barrels per day capacity ceiling, and all other available bypass infrastructure running at maximum throughput, the combined volume still falls far short of the 14-plus million barrels per day of regional production that would normally transit Hormuz. No new pipeline infrastructure can be commissioned within any timeframe relevant to the current crisis, meaning this gap is structurally fixed.
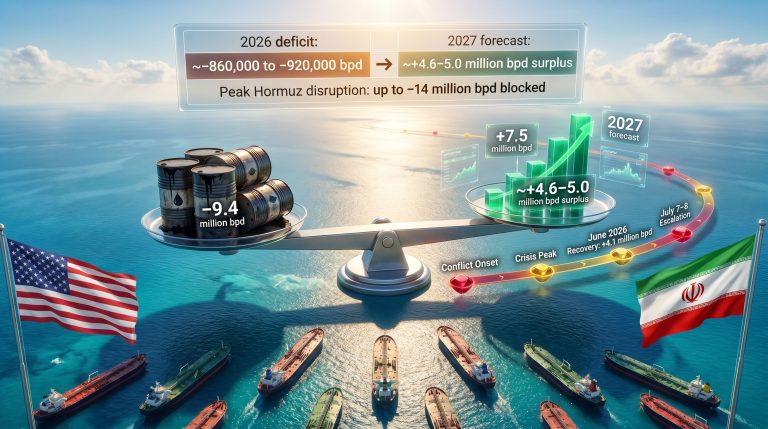
The arithmetic is unambiguous: even under a best-case pipeline utilisation scenario, the global market faces a near-term supply deficit in the range of 7 to 10 million barrels per day that cannot be bridged until the strait physically reopens.
The IEA's Unprecedented Emergency Response
The International Energy Agency has coordinated the largest emergency oil reserve release in its institutional history, deploying approximately 400 million barrels from member-nation strategic petroleum reserves. This mobilisation surpasses the scale of previous SPR interventions during the 2011 Libya crisis and the coordinated release that followed the 2022 post-Ukraine invasion supply shock. The IEA's detailed account of how global oil supplies have readjusted to fill the gap underscores just how unprecedented the logistical response has been.
However, strategic petroleum reserves are instruments of short-term buffering rather than structural supply replacement. At current drawdown rates, these emergency reserves are projected to be substantially depleted by July to August 2026, creating a dangerous vulnerability window if the strait remains closed beyond that point.
The implications of depletion without a corresponding reopening are severe. Replenishing SPR volumes after drawdown requires sustained market normalisation and is estimated to take 90 or more days under favourable conditions. A simultaneous expiry of emergency reserves and continued closure would expose markets to a second-wave price shock potentially exceeding the severity of the initial disruption.
Scenario-Based Price Outlook Through 2026 and Into 2027
| Scenario | Condition | Brent Price Projection |
|---|---|---|
| Rapid Resolution (Q3 2026) | Strait reopens, diplomacy succeeds | $80–$95/bbl normalisation path |
| Extended Disruption (Q4 2026) | Partial reopening, continued risk premium | $120–$150/bbl range |
| Worst Case (No Resolution) | Full closure persists into 2027 | $150–$200/bbl, gasoline >$6/gallon |
| 2027 Stabilisation Base Case | Conflict ends, supply recovers | ~$70/bbl by 2027 |
A critical and often underappreciated point is that reopening the strait does not instantly resolve the supply crisis. Energy analysts project a multi-month normalisation period even after physical transit resumes, as supply chains, inventory levels, and refinery throughput require sustained above-normal production and uninterrupted delivery before market balances stabilise. Global inventory replenishment is estimated to require over 90 days under those conditions.
The structural damage to shipping operator confidence, insurance market pricing, and tanker routing infrastructure will also persist well beyond any formal ceasefire or diplomatic resolution, adding friction to the recovery timeline that is separate from the physical logistics of oil flow.
Broader Strategic and Macroeconomic Implications
The Energy Diversification Acceleration
The crisis has dramatically intensified policy conversations around strategic energy supply diversification. Governments that previously treated Gulf dependency as a manageable structural risk are now confronting it as an active vulnerability. In addition, investment appetite for non-Middle Eastern oil production, expanded pipeline infrastructure, and accelerated renewable energy capacity is expected to grow materially as the systemic fragility exposed by this disruption is absorbed into national energy planning frameworks.
Stagflation Risk and the Central Bank Dilemma
Sustained oil prices above $100 per barrel historically feed broad-based inflationary pressure through transportation costs, manufacturing inputs, food production, and services pricing. Central banks in major economies face a genuinely difficult policy environment: tightening monetary conditions to combat energy-driven inflation risks compressing economic activity that is already stressed by supply disruptions. This configuration creates a stagflationary risk scenario — rising prices combined with decelerating growth — that interest rate policy is structurally poorly equipped to address.
The Geopolitical Reordering of Energy Alliances
Major energy-importing economies including India, China, Japan, and South Korea have accelerated bilateral supply agreements with non-Gulf producers, including the United States, Canada, and West African exporters. This oil market disruption has consequently elevated the role of U.S. shale supply as a swing supplier, reinforcing American geopolitical influence across energy-dependent economies at a moment when Gulf reliability is being fundamentally reassessed.
Frequently Asked Questions
What percentage of global oil passes through the Strait of Hormuz?
Approximately 20% of total global daily oil and gas consumption, equivalent to 15 to 20 million barrels per day, transits the strait under normal operating conditions.
Why can't oil shipments be permanently rerouted away from Hormuz?
Pipeline bypass infrastructure can handle a maximum of roughly 8 to 9 million barrels per day across all available routes combined, against a regional production base of over 14 million barrels per day. No viable maritime alternative exists for the remaining volume deficit.
How long has Hormuz been closed in 2026?
As of July 2026, the strait has been effectively closed or severely restricted for approximately 70 days, beginning with the outbreak of U.S.-Iran military conflict in late February 2026.
When could oil prices normalise?
A base case stabilisation toward approximately $70 per barrel is forecast for 2027, contingent on conflict resolution and supply chain normalisation through Q4 2026. Even after reopening, full market normalisation is expected to require 90 or more days.
Could oil reach $200 per barrel?
Under a worst-case scenario involving no diplomatic resolution and depletion of emergency reserves, institutional price projections suggest Brent crude could reach $150 to $200 per barrel. Current market pricing is being restrained by diplomatic optimism, a ceiling that dissolves if negotiations fail and reserves are simultaneously exhausted.
Readers seeking additional context on Middle Eastern energy geopolitics and ongoing oil market developments may find value in exploring reporting from ET EnergyWorld at energy.economictimes.indiatimes.com.
This article contains forward-looking statements, scenario projections, and price forecasts. These reflect analytical frameworks and publicly available institutional commentary as of the time of writing and should not be interpreted as investment advice. All financial decisions should be made in consultation with a qualified financial adviser.
Want To Position Ahead of the Next Major Commodity Market Shift?
The Strait of Hormuz crisis is reshaping global energy markets in real time, creating cascading effects across commodities, mining supply chains, and resource equities — and Discovery Alert's proprietary Discovery IQ model scans ASX announcements daily to identify significant mineral discoveries the moment they emerge, delivering actionable alerts to subscribers before the broader market reacts. Explore historic discoveries and their extraordinary returns on Discovery Alert's dedicated discoveries page, and begin your 14-day free trial today to ensure you're positioned ahead of the next major market opportunity.