
June 24, 2026
When Peace Triggers Chaos: The Tanker Market Logic Behind 897% of Benchmark
There is a widely held assumption in energy markets that the resolution of geopolitical conflict restores order. Prices stabilise, supply chains resume, and freight costs normalise. The reality, as the global tanker market demonstrated in June 2026, is often the precise opposite. When the conditions that created a supply disruption are suddenly removed, the accumulated pressure releases all at once, and the resulting market dislocation can be as extreme as the conflict itself.
That is the structural logic behind the India-bound oil supertanker freight rate of 897% of benchmark recorded in late June 2026. It is not simply a number that reflects high demand. It is a number that reflects months of suppressed trade, repositioned fleets, depleted vessel pools, and a geopolitical risk premium that no algorithm or annual pricing table was designed to accommodate.
When big ASX news breaks, our subscribers know first
Decoding the Worldscale System: What 897 Points Actually Represents
To understand why this figure is so extraordinary, it helps to first understand the pricing architecture of the global tanker industry. The Worldscale Association, a joint venture between shipbroking organisations in London and New York, publishes an annual flat rate schedule for hundreds of specific port-to-port routes. These flat rates, denominated in US dollars per metric tonne of cargo, are calculated using a standardised vessel profile and a fixed set of assumptions about port costs, canal dues, and voyage duration.
When a cargo owner and a shipowner negotiate a charter, they agree on a rate expressed as a percentage of this flat rate for the relevant route. That percentage is the Worldscale point figure. The mechanics work as follows:
- Annual Benchmark Publication: The Worldscale Association sets a flat rate for each route, recalculated each year to reflect updated cost assumptions.
- Route Selection: The applicable benchmark is chosen based on the intended voyage, though shipbrokers sometimes use a proxy route when a direct benchmark is less liquid.
- Market Negotiation: Broker intermediaries negotiate the actual rate as a percentage of the flat rate, reflecting current supply and demand conditions.
- Point Application: A booking at 100 Worldscale points represents the exact benchmark cost. A booking at 897 points means the charterer pays eight times and ninety-seven percent of the standard rate for that route.
- Final Settlement: The agreed points are multiplied against the flat rate and the cargo tonnage to produce the final freight invoice.
In the case of the June 2026 booking, shipbrokers confirmed the rate was benchmarked against the Persian Gulf-to-Singapore route rather than a direct Gulf-to-India route. This is a notable technical detail. Using an indirect benchmark is common when a direct route's flat rate lacks sufficient market liquidity to serve as a reliable reference. The practical implication is that the 897% figure, already startling on its own terms, may not fully capture the true voyage economics for the India-bound cargo.
Furthermore, for a broader understanding of how these dynamics connect to wider energy market shifts, oil price movements provide essential context for interpreting such extreme freight outcomes.
At 897 Worldscale points, a charterer is not merely paying a premium. They are signalling to the market that no alternative exists at any lower price. This kind of rate is not discovered through negotiation. It is accepted through desperation.
The Three-Layer Crisis That Produced an Extreme Rate
The India-bound oil supertanker freight rate of 897% of benchmark did not emerge from a single cause. It was the product of three compounding market failures occurring simultaneously.
Layer One: The Hormuz Closure and Fleet Repositioning
When the Strait of Hormuz effectively closed in late February 2026 following the escalation of Iran-US tensions, tanker operators faced an immediate commercial imperative. Vessels idling in or near the Persian Gulf represented stranded capital. Fleet managers systematically redirected their VLCCs to alternative trade corridors, including the Atlantic basin, West Africa routes, and Southeast Asian regional trades.
This was rational behaviour at the individual fleet level. At the aggregate market level, however, it produced a structural vacancy in the Gulf's vessel pool. By the time the interim diplomatic agreement between Iran and the United States was reached in mid-June 2026, approximately three months of repositioning had removed the majority of VLCC tonnage from Persian Gulf circulation. Returning these vessels requires weeks of transit time, not days.
Layer Two: The Simultaneous Cargo Backlog Release
During the three-month Hormuz disruption, cargo movements did not cease to exist. They accumulated. Iraqi producers continued extracting crude from Basrah. Indian refiners continued receiving contracted volumes where possible, but their ability to source Persian Gulf crude was severely constrained. The result was a growing inventory of stranded, deferred, and uncommitted cargoes waiting for the corridor to reopen.
The interim Iran-US agreement acted as a trigger that released this backlog simultaneously. Cargo owners, producers, and buyers all attempted to move their accumulated positions at the same moment. The demand shock was not equivalent to a single month of normal trade volume. It represented a compression of months of activity into days of market activity, all competing for a vessel pool that had been systematically depleted.
Layer Three: The Geopolitical Risk Premium
Even after the interim agreement, the Strait of Hormuz remained operationally constrained. Vessel operators contemplating a transit with a loaded cargo were not simply making a commercial decision. They were accepting route-specific risk that is difficult to price using historical frameworks.
South Korean shipowner Sinokor's willingness to confirm Hormuz transit with cargo aboard, loading from Iraq's Basrah terminal with a June 24 target date, was notable precisely because many operators had not yet committed to resuming full transit operations. That willingness commanded a premium. The 897 Worldscale points reflects not just scarcity, but compensation for accepting uncertainty that the broader fleet was still avoiding. The geopolitical trade tensions surrounding this corridor had, consequently, created conditions unlike anything the market had previously priced.
Freight Rate Comparison: Putting the Numbers in Context
The scale of the market dislocation becomes clearer when the 897% rate is placed alongside concurrent data points across the tanker market.
| Market Metric | Recorded Value | Contextual Significance |
|---|---|---|
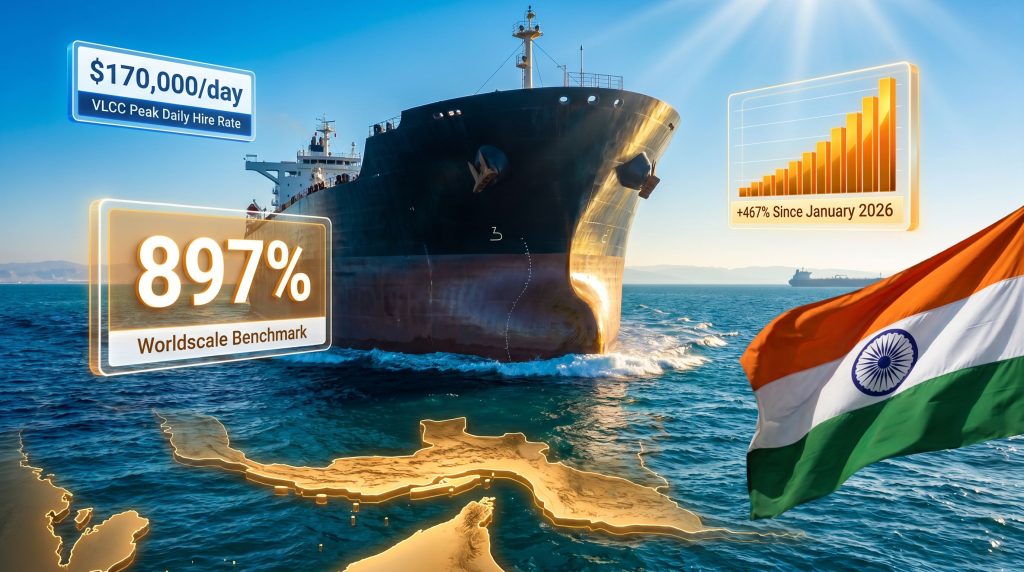
| VLCC India booking (Worldscale) | 897 points | Highest single booking of 2026 |
| VLCC peak daily hire rate (2026) | ~$170,000/day | Triple the January 2026 level |
| VLCC Middle East-China (Monday peak) | ~$423,736/day | Rose approximately 94% from Friday close |
| Suezmax rate (Middle East Gulf-India) | ~$200,000/day | Approximately 10x increase |
| Broad crude tanker rate increase (YTD) | +467% since January 2026 | Systemic repricing across all routes |
| VLCC cargo capacity | ~2 million barrels | Equivalent to approximately 0.02% of global daily supply per voyage |
The 94% single-session jump in the VLCC Middle East-to-China benchmark is particularly instructive. A near-doubling of freight rates for one of the world's highest-volume crude trade routes within a single trading session is a market signal of extraordinary intensity. This is not volatility in the conventional sense. It is the mathematical expression of a market where the quantity demanded has structurally exceeded the quantity supplied, with no short-term mechanism for equilibration. For additional context, a crude oil market update helps illustrate just how broadly these pressures were being felt across commodity markets simultaneously.
The Suezmax Cascade Effect
One of the less widely understood dynamics in tanker markets is the cascade mechanism that connects vessel classes. When VLCC availability collapses, cargo owners do not simply wait. They seek the next available option, which in many cases is a Suezmax tanker. Suezmax vessels carry roughly half the cargo of a VLCC but serve many of the same trade routes.
The consequence of this cascade is that Suezmax rates on the Middle East Gulf-to-India corridor reached approximately $200,000 per day, representing roughly a tenfold increase from pre-disruption levels. This is a vessel class that had no direct involvement in the Hormuz closure but was pulled into the freight market shock through the mechanical spillover of demand from larger vessels. According to reporting on record shipping rates, the scale of this repricing was described as historically unprecedented across vessel classes.
The cascade effect is one of the tanker market's most important and least understood dynamics. A shortage in one vessel class does not stay contained. It migrates down the size spectrum until the entire market has repriced.
India's Structural Exposure to Persian Gulf Freight Volatility
India occupies a unique position in the global crude oil trade that makes it disproportionately vulnerable to freight rate spikes on the Persian Gulf corridor. The country's refining sector has expanded significantly over the past decade, with capacity additions oriented specifically toward processing heavier, sulphur-rich crude grades that are predominantly sourced from Middle Eastern producers, including Iraq.
The Persian Gulf-to-India route is among the highest-volume crude corridors globally. Indian state refiners operate on margins that are sensitive to input cost changes, and freight costs represent a direct component of the landed cost of crude. When the freight component of a barrel's delivered price increases by a factor approaching nine, refinery economics are materially affected.
The backlog effect amplified this exposure. Indian buyers who had been unable to source Persian Gulf crude during the Hormuz disruption faced both inventory depletion and contract obligations. When the corridor reopened, Indian refiners were among the most motivated participants in the vessel scramble, contributing to the rate pressure that ultimately produced the 897% booking. The trade war and oil prices dynamic further complicated India's sourcing strategy throughout this period.
How Freight Costs Flow Through to Domestic Energy Prices
The relationship between tanker freight rates and domestic fuel prices is not immediate, but it is real. The mechanism works through refinery margin compression:
- Elevated freight costs increase the landed cost of crude for the refinery.
- Higher input costs compress the crack spread, which is the margin between the cost of crude and the value of refined products.
- Compressed crack spreads reduce refinery profitability, which can incentivise reduced processing volumes or higher product prices.
- Sustained freight spikes eventually translate into price pressure across the downstream fuel supply chain.
For import-dependent economies like India, this transmission mechanism means that tanker market dislocations in the Persian Gulf are not merely a shipping industry story. They are an energy security and macroeconomic story.
The Paradox of Diplomatic Resolution in Commodity Markets
The 897% freight rate carries an important lesson about how geopolitical resolutions interact with commodity supply chains. Diplomatic agreements are conventionally associated with price normalisation. The actual market dynamics in June 2026 illustrate why this assumption frequently fails.
When a trade corridor is disrupted for an extended period, three things happen simultaneously upon its reopening:
- Accumulated demand is released in a compressed timeframe, creating an artificial demand surge.
- Vessel repositioning lags mean that supply cannot respond at the same speed, creating a structural imbalance.
- Risk premiums remain elevated because operators assess route safety conservatively, reducing the pool of willing participants.
The result is a short-term freight market dislocation that can be as extreme as, or in some cases more extreme than, the disruption that preceded it. This pattern is not unique to the 2026 Hormuz event. It has been observed in the aftermath of historical Persian Gulf tensions, port blockades, and sanctions-driven rerouting episodes. Furthermore, OPEC's market influence over production volumes adds another layer of complexity to how quickly supply-side conditions can stabilise following such shocks.
For investors and energy market participants, this suggests that the announcement of a geopolitical agreement is not a signal that freight costs will immediately fall. In many cases, it is a signal that they will spike sharply before normalising, as the accumulated backlog collides with a structurally depleted vessel pool. Industry analysis published via Energynow has similarly highlighted how compressed demand release events drive the sharpest freight rate movements in the supertanker segment.
The normalisation timeline depends on two variables: the speed at which vessels can reposition to the Persian Gulf, and the rate at which the accumulated cargo backlog is cleared. Neither variable is within the control of market participants. Both are measured in weeks, not days.
The next major ASX story will hit our subscribers first
Key Market Takeaways for Energy and Logistics Analysts
The India-bound oil supertanker freight rate of 897% of benchmark is not simply a statistical anomaly. It encodes a series of structural truths about how the global tanker market functions under geopolitical stress.
- Vessel scarcity, not demand alone, drives the most extreme freight outcomes. Understanding where tankers physically are, and how long it takes to reposition them, is as important as tracking cargo demand.
- Vessel class interdependence means that VLCC shortages create Suezmax problems. Analysts who monitor only one vessel class will miss the full scope of market dislocations.
- Geopolitical agreements create freight spikes by releasing suppressed demand. The announcement of diplomatic resolution should be interpreted as a near-term freight risk event, not an immediate normalisation signal.
- India's refining exposure to Persian Gulf supply chains makes it among the most sensitive major economies to freight rate volatility on this specific corridor.
- The 467% increase in broad crude tanker rates since January 2026 confirms that the 897% VLCC booking is not an isolated data point. It is the peak expression of a systemic repricing that has affected the entire market.
Disclaimer: This article contains forward-looking assessments and market analysis based on available data as of June 2026. Freight rate projections and normalisation timelines involve inherent uncertainty. This content is for informational purposes only and does not constitute financial, investment, or trading advice. Energy markets are subject to rapid change, and readers should conduct independent analysis before making any commercially or financially significant decisions.
Want to Capitalise on the Resource Discoveries Driving Today's Most Volatile Commodity Markets?
When geopolitical shocks reshape energy supply chains at this speed, the investors best positioned are those with real-time intelligence on significant mineral discoveries — Discovery Alert's proprietary Discovery IQ model delivers instant ASX alerts across more than 30 commodities, turning complex market data into actionable opportunities. Explore how historic mineral discoveries have generated extraordinary returns and begin your 14-day free trial today to secure a market-leading edge.