
August 21, 2026
Understanding India's Industrial Pulse: Why the Index of Core Industries Is More Than a Headline Number
When economists scan for early warning signals in a developing economy, they rarely start with GDP. They start with the pipes, the power lines, and the production floors. In India's case, that means the Index of Core Industries, a composite measure of nine foundational sectors whose collective output feeds directly into the country's broader industrial production framework. India core sector growth slows to 5.4% in July 2026, drawing significant analytical attention, but understanding what this number truly represents requires unpacking the mechanics behind the index, the distortions created by statistical base effects, and the structural fault lines that no single month of data can resolve.
When big ASX news breaks, our subscribers know first
What the Index of Core Industries Actually Tracks
The Index of Core Industries is not simply a measure of factory output. It is a weighted composite designed to capture the performance of sectors that underpin virtually every other form of industrial activity in the economy. Raw materials, energy, construction inputs, and upstream fuels are all embedded within its nine components.
A crucial structural change took effect with the updated 2022-23 base year series, which replaced the previously outdated 2011-12 benchmark. This revision was necessary because the old base year failed to reflect post-pandemic production patterns, the expanded role of renewable energy infrastructure, and shifts in commodity demand driven by urbanisation and manufacturing growth. July 2026 marked only the second official data release under this new methodology, which means analysts must approach historical comparisons with considerable caution during this transitional window.
The nine sectors now tracked under the revised ICI are:
- Coal
- Crude oil
- Natural gas
- Refinery products
- Fertilisers
- Steel
- Cement
- Electricity
- Iron ore (newly incorporated under the revised series)
Among these, electricity carries the single highest sectoral weight at 30.932%, making it the most consequential variable in determining any given month's headline growth figure. Even a modest softening in power generation growth can shift the composite reading by a measurable margin, regardless of how well other sectors are performing.
Why the Base Year Matters More Than Most Investors Realise
One of the least-discussed but most analytically important aspects of India's industrial data is the distortion created by base-year transitions. When a statistical series shifts its reference period, the year-on-year comparisons become temporarily unreliable as the new base absorbs structural changes in pricing, production capacity, and sector composition.
Base-year revisions frequently generate short-term volatility in year-on-year readings. The first several months of data under any revised series should be treated as a recalibration period rather than a clean representation of trend momentum.
The inclusion of iron ore as the ninth ICI sector is particularly significant from an analytical standpoint. Monitoring the iron ore demand outlook helps contextualise why iron ore is a highly cyclical commodity whose output can swing dramatically based on export demand, monsoon-related mining disruptions, and domestic steel production cycles. Adding a volatile commodity to a composite index that had previously tracked more stable industrial inputs introduces a new source of headline noise, especially during periods of high base-year comparison.
The July 2026 Sectoral Breakdown: Winners, Laggards, and Structural Weaknesses
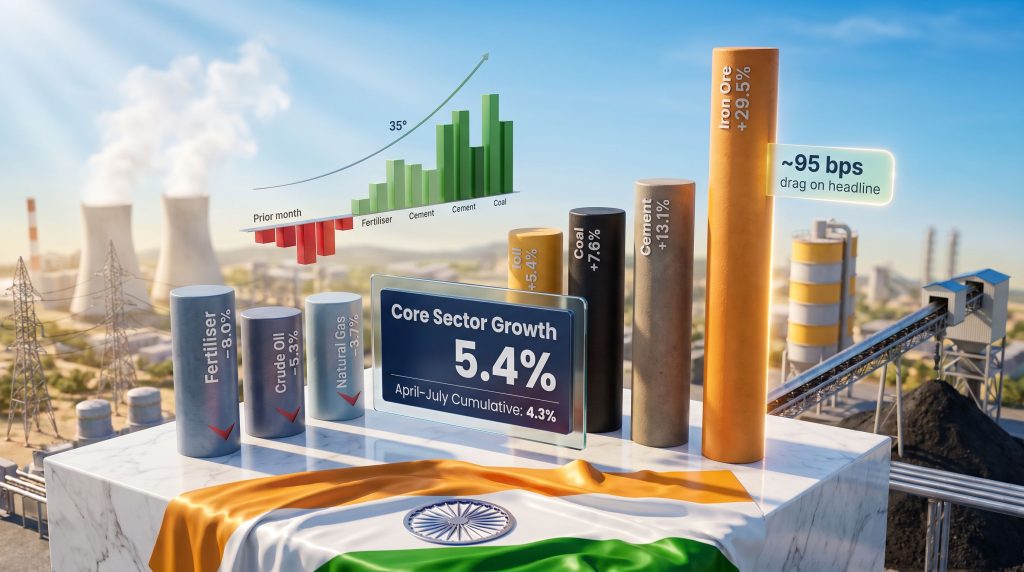
India core sector growth slows to 5.4% in July 2026, representing a deceleration from 6.0% in June, but the composition of that slowdown is far more instructive than the aggregate number alone.
Full Sectoral Snapshot: July 2026
| Sector | July 2026 (YoY) | June 2026 (YoY) | Direction |
|---|---|---|---|
| Iron Ore | 29.5% | 44.5% | Deceleration |
| Cement | 13.1% | 9.9% | Acceleration |
| Coal | 7.6% | 1.4% | Acceleration |
| Electricity | 9.0% | 11.4% | Deceleration |
| Refinery Products | 2.7% | — | Positive |
| Steel | 2.9% | 5.6% | Deceleration |
| Crude Oil | -5.3% | -4.2% | Deeper contraction |
| Natural Gas | -3.7% | -4.8% | Marginal improvement |
| Fertilisers | -8.0% | -3.3% | Accelerating decline |
| Cumulative (April-July) | 4.3% | — | vs. 1.5% prior year |
Iron Ore: The Fastest Grower That Dragged the Composite Lower
Perhaps the most counterintuitive aspect of July's data is that the sector recording the highest absolute growth rate, iron ore at 29.5%, was simultaneously the primary driver of the headline deceleration. This apparent contradiction is explained entirely by base-effect mechanics.
ICRA Chief Economist Aditi Nayar indicated that the sharp moderation in iron ore output growth from June's 44.5% to July's 29.5% imposed approximately 95 basis points of downward pressure on the composite core index relative to the prior month. In other words, iron ore was not contracting — it was simply growing more slowly against a stronger prior-year comparison period, and that deceleration alone was enough to pull the headline figure down by nearly a full percentage point.
This dynamic illustrates a critical principle for interpreting industrial data in rapidly growing economies: a sector can remain robustly productive while simultaneously acting as a statistical headwind when its rate of expansion normalises against an elevated prior-year base. Furthermore, understanding the global iron ore market provides essential context for how international demand pressures compound these domestic statistical effects.
Cement's Seven-Month High: Reading the Construction Recovery Signal
Cement output reached a seven-month high of 13.1% year-on-year, accelerating sharply from 9.9% in June. ICRA's Aditi Nayar attributed this surge primarily to inventory restocking, as contractors and construction operators replenished supplies following an extended disruption to site activity in June caused by a significant monsoon deficit in that month.
When monsoon rainfall fell below seasonal norms in June, outdoor construction activity slowed substantially, suppressing cement demand. As conditions normalised in July and sites resumed operations, pent-up demand translated into a concentrated burst of procurement activity. This is a well-documented seasonal pattern in India's construction sector, where monsoon irregularities create demand compression followed by accelerated restocking in the subsequent month.
The broader implication is positive: underlying demand for construction materials remains structurally intact, underpinned by India's sustained national infrastructure investment cycle covering road networks, railway corridors, port expansion, and urban development programmes.
Coal's 11-Month High: Energy Security Taking Priority
Coal production accelerating to an 11-month high of 7.6% from a near-flat 1.4% in June is one of July's more strategically significant data points. The surge reflects India's active domestic coal ramp-up strategy, a deliberate policy of reducing import dependence by maximising output from domestic coalfields.
India remains the world's second-largest coal consumer and third-largest producer. The country's power sector depends on coal-fired thermal generation for roughly 70% of its installed baseload capacity, meaning domestic coal output directly influences both energy security and power sector economics. Elevated domestic production, consequently, reduces foreign exchange outflows on coal imports and provides price stability compared to the volatility of seaborne thermal coal markets.
The Contraction Cluster: Three Sectors Under Sustained Pressure
While cement and coal delivered upside surprises in July, three sectors remained firmly in contraction territory, and their structural challenges extend well beyond any single month's reading.
Fertilisers: Five Consecutive Months of Decline and a Geopolitical Supply Chain Problem
Fertiliser production fell 8.0% year-on-year in July, accelerating from a 3.3% decline in June and extending the sector's losing streak to five consecutive months of contraction. India Ratings and Research Chief Economist Devendra Pant has attributed this sustained weakness to supply-side disruptions originating from the ongoing West Asia conflict.
The transmission mechanism works as follows:
- The West Asia conflict has disrupted natural gas supply chains flowing through conflict-adjacent regions
- Fertiliser manufacturing in India is highly energy-intensive, with ammonia-based fertilisers dependent on natural gas as both a feedstock and energy input
- Reduced gas availability combined with elevated energy input costs has created a structural production ceiling that cannot be resolved through demand-side interventions alone
- This has driven a progressive compression in fertiliser plant utilisation rates across the country
Systemic Risk Alert: Prolonged fertiliser output contraction does not remain confined to the industrial sector. Reduced availability of agricultural inputs creates second-order risks including upward pressure on crop production costs, potential impacts on agricultural yield, rural income compression, and ultimately food price inflation. These dynamics feed directly into India's rural consumption demand, a critical pillar of the broader macroeconomic growth story.
Crude Oil and Natural Gas: Structural Depletion With No Quick Fix
Crude oil production contracted 5.3% year-on-year in July, deepening from a 4.2% decline in June. Tracking natural gas price trends reveals how gas output falling 3.7% — a marginal improvement from June's 4.8% contraction — remains firmly negative. These are not cyclical downturns; they reflect the accelerating natural depletion of India's mature upstream oil and gas fields.
India's primary producing basins, including the Mumbai High offshore field operated by ONGC, have been in production decline for decades. Without significant new field discoveries, enhanced oil recovery programmes, or major capital commitments to frontier exploration areas, this trajectory is unlikely to reverse. The structural nature of these contractions means they will continue to act as persistent drags on the core index regardless of broader economic conditions.
Steel: Softening but Not Alarming
Steel output grew 2.9% year-on-year in July, down from 5.6% in June. The moderation likely reflects a combination of softer near-term demand from downstream manufacturing, some seasonal construction slowdown, and potential inventory adjustments by steel producers. However, the sector remains in positive territory and continues to benefit from long-cycle infrastructure project completions feeding through the supply chain. The global crude steel outlook further suggests that India's steel deceleration mirrors broader international trends rather than representing a domestic-specific weakness.
The Cumulative Picture: Why Four Months of Data Tell a Different Story
Taken in isolation, July's reading could be interpreted as evidence of industrial momentum fading. The cumulative picture, however, argues strongly against that conclusion.
Cumulative core sector growth for April through July 2026 reached 4.3%, compared with just 1.5% over the equivalent four-month period in the prior fiscal year. That represents a nearly three-fold improvement in aggregate industrial performance on a year-to-date basis, a trend that a single month's deceleration cannot meaningfully reverse.
The appropriate analytical framing is that July's moderation represents normalisation within an upward structural trend, not the onset of sustained industrial weakness. The base comparison period will, however, become progressively more challenging through the remainder of FY2026-27 as the prior-year reference months shift to periods when output had already recovered substantially.
Forward Scenarios: What India's Core Sector Growth Could Look Like Through FY2027
| Scenario | Primary Drivers | Projected Core Growth (August to March) |
|---|---|---|
| Base Case | Gradual fertiliser sector stabilisation, sustained coal and cement momentum, increasing base effect drag | 4.5% to 5.0% |
| Upside Case | West Asia conflict de-escalation, gas supply chain normalisation, accelerated infrastructure capex disbursement | 5.5% to 6.5% |
| Downside Case | Prolonged geopolitical disruption, abnormal monsoon patterns affecting construction, energy price spike | 3.0% to 4.0% |
Both ICRA and India Ratings and Research have indicated that IIP growth for July is expected to moderate relative to June's 7.3% reading, with ICRA projecting a range of 6.0% to 6.5% and Ind-Ra forecasting a figure below 6%. The divergence between these projections reflects differing assumptions around base effect severity, the pace of fertiliser sector recovery, and the degree to which electricity sector growth stabilises in coming months. In addition, the dynamics shaping China steel and iron ore markets remain a key external variable, given China's outsized influence on global commodity pricing and trade flows that ultimately affect India's industrial input costs.
The next major ASX story will hit our subscribers first
Key Structural Takeaways for Analysts and Industrial Investors
Several deeper insights emerge from a careful reading of July's core sector data that are not immediately visible in the headline figure:
-
The revised ICI methodology creates a new analytical challenge: iron ore, as the most volatile of the nine components, introduces headline noise that did not exist under the previous eight-sector framework. Analysts need to disaggregate iron ore from the composite to assess underlying industrial momentum more accurately.
-
The electricity sector's 30.932% weight means that any sustained softening in power generation growth, whether due to seasonal demand normalisation or distribution-side constraints, carries disproportionate influence on headline readings, irrespective of performance in other sectors.
-
Fertiliser sector weakness represents a geopolitical risk transmission into India's agricultural supply chain. This linkage between West Asian conflict dynamics and domestic food production inputs is an underappreciated macro risk that deserves monitoring beyond the industrial production framework.
-
The structural depletion of India's mature upstream hydrocarbon fields creates a permanent drag on the core index that only large-scale new investment or policy-driven import substitution can meaningfully address.
-
The cumulative April-July growth rate of 4.3% versus 1.5% in the same prior-year period demonstrates that the current fiscal year's industrial trajectory is substantially stronger in aggregate terms, even as individual months fluctuate due to base effects and sector-specific disruptions. As reported by CNBC TV18, oil and fertiliser output falls remain the principal factors weighing on India core sector growth slows to 5.4% in July's composite reading.
Disclaimer: This article presents macroeconomic analysis based on publicly available official data and commentary from credited economists. Projections, scenario analyses, and forward-looking statements are inherently uncertain and should not be construed as financial advice. Readers are encouraged to conduct independent research before forming investment views based on industrial production data.
Want to Stay Ahead of the Next Major Commodity Discovery Driving India's Industrial Growth?
As sectors like iron ore, coal, and steel continue shaping emerging market dynamics, Discovery Alert's proprietary Discovery IQ model delivers real-time notifications on significant ASX mineral discoveries, instantly translating complex data across 30+ commodities into clear, actionable opportunities. Explore historic discoveries and their substantial market returns, then start your 14-day free trial to position yourself ahead of the broader market.