June 9, 2026
Understanding India's Critical Mineral Dependencies
India's transition toward carbon neutrality by 2070 confronts a fundamental resource constraint that extends far beyond financial capital or technological innovation. The nation's critical minerals energy transition creates unprecedented demand for specific geological resources that cannot be substituted or manufactured. Unlike traditional energy transitions that unfolded over decades, India's clean energy transformation compresses mineral demand spikes into a single decade, creating supply chain vulnerabilities that threaten the entire decarbonisation strategy.
The mineral intensity of India's energy transition exceeds historical precedents by orders of magnitude. Each gigawatt of renewable energy capacity requires approximately 2,000 tonnes of copper for grid connections and transformers. Meanwhile, offshore wind installations demand 200-400 kg of rare earth elements per turbine for permanent magnet generators. Electric vehicle batteries consume 8-12 kg of lithium, 25-35 kg of nickel, and 15-25 kg of graphite per vehicle, with commercial vehicle electrification multiplying these ratios significantly.
What Makes India's Mineral Supply Chain Vulnerable?
Current Import Dependencies and Supply Risks:
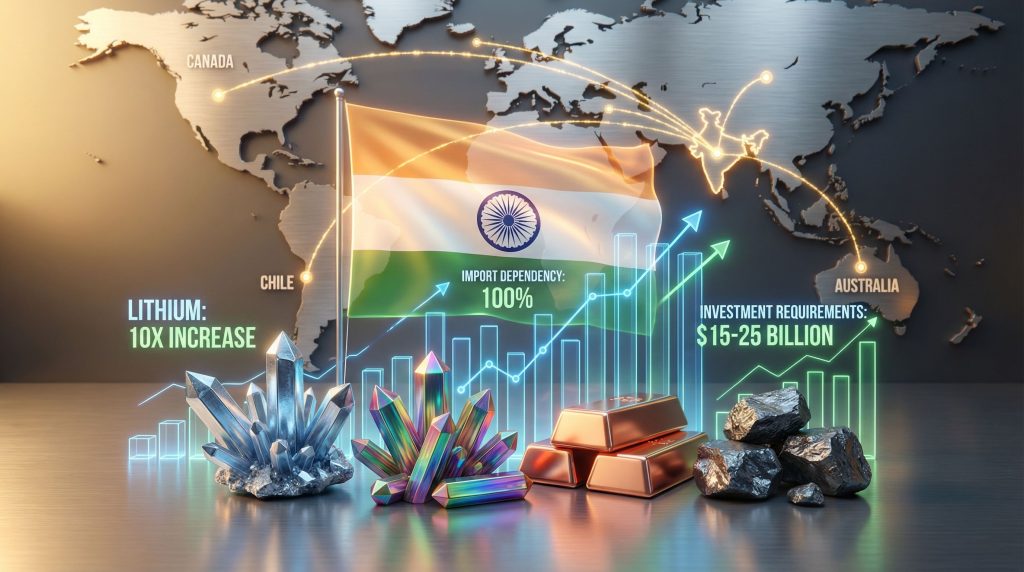
- Lithium: 100% import dependency with no commercial domestic production
- Cobalt: 100% import dependency concentrated in Democratic Republic of Congo
- Nickel: 85% import dependency despite domestic laterite reserves
- Graphite: 65% import dependency with processing capacity constraints
- Rare Earth Elements: 95% import dependency for processed materials
- Copper: 45% import dependency with growing deficit trends
India's mineral vulnerability stems from synchronised demand growth across multiple technology sectors occurring simultaneously. Unlike historical commodity cycles where mining booms addressed sequential demand peaks, India's critical mineral supply chains face convergent requirements for electric vehicles, renewable energy, and grid infrastructure that cannot be absorbed by existing global supply diversification.
The structural nature of these dependencies becomes apparent when examining processing capacity constraints. Raw mineral extraction represents only the initial supply chain component, with beneficiation, refining, and chemical processing stages creating additional bottlenecks. Furthermore, India currently processes less than 5% of projected 2035 battery-grade mineral requirements domestically, forcing reliance on overseas processing facilities concentrated in China and select other jurisdictions.
Which Minerals Drive India's Clean Energy Transformation?
Table: Critical Mineral Demand Projections (2025-2035)
| Mineral | Current Import Dependency | Projected Demand Growth | Primary Applications |
|---|---|---|---|
| Lithium | 100% | 10x increase | EV batteries, grid storage |
| Cobalt | 100% | 4x increase | Battery cathodes |
| Nickel | 85% | 3x increase | Battery anodes |
| Graphite | 65% | 12x increase | Battery anodes |
| Rare Earth Elements | 95% | 5x increase | Permanent magnets, motors |
| Copper | 45% | 2.5x increase | Grid infrastructure, wiring |
The mineral demand multipliers reflect conservative projections based on International Energy Agency scenarios for India's clean energy deployment. Lithium requirements could increase tenfold by the mid-2030s, driven primarily by electric vehicle battery manufacturing and utility-scale energy storage projects. Consequently, graphite demand shows the steepest growth trajectory, increasing twelve-fold as both natural and synthetic graphite compete for battery anode applications.
Battery Chemistry Technical Requirements:
Modern lithium-ion batteries require precise mineral specifications that cannot accommodate quality variations. Cathode materials demand 99.5% purity nickel sulfate, while battery-grade lithium carbonate must contain less than 50 parts per million sodium impurities. However, these technical specifications limit sourcing flexibility and create processing bottlenecks that extend beyond raw material availability.
Rare earth permanent magnet complexity adds another dimension to supply chain vulnerability. Neodymium-iron-boron magnets for wind turbines and electric vehicle motors require specific elemental ratios, with neodymium comprising 30-35% of magnet weight and dysprosium additions of 6-10% for high-temperature applications. In addition, India imports 100% of processed rare earth materials despite holding domestic monazite reserves.
When big ASX news breaks, our subscribers know first
Domestic Mining Challenges: Structural Barriers to Self-Reliance
India's domestic mineral development faces systemic obstacles that extend beyond resource availability or technological capacity. The intersection of regulatory frameworks, economic incentives, and geological realities creates structural barriers that cannot be resolved through incremental policy adjustments. These challenges compound over time, making import dependence increasingly entrenched despite the existence of domestic mineral reserves.
Why Has India's Auction-Based Mining System Failed?
The transition to competitive auction mechanisms for mineral leases, implemented through the Mineral Auction Management System since 2020-2021, has produced counterintuitive outcomes. For instance, the system weakens rather than strengthens domestic supply security. The auction framework imposes exploration risk entirely on successful bidders post-award, creating capital allocation distortions that discourage the geological work necessary for reserve expansion.
Perverse Incentive Structures:
- Premium Bidding Without Geological Certainty: Auction participants compensate for exploration uncertainty through elevated bids, then lack capital for drilling programmes
- Brownfield Constraint Paradox: Composite licences restrict exploration to mapped geological zones, prohibiting greenfield discovery
- Revenue Optimisation Over Supply Security: Government revenue maximisation conflicts with long-term mineral availability
- Stranded Asset Creation: Approximately 15-20% of awarded mineral blocks fail to achieve production commencement within contracted timelines
The brownfield licensing constraint represents a particularly damaging structural flaw. Composite licence frameworks bundle exploration and mining rights within predetermined geological boundaries, preventing the sequential risk reduction that characterises successful mineral project development. This regulatory architecture maximises near-term government revenue while systematically suppressing reserve replacement ratios.
Mine Development Timeline Analysis:
Global mineral project development requires 15-18 years average from discovery to commercial production. Moreover, exploration phases consume 5-7 years, feasibility studies require 2-3 years, and construction phases span 3-5 years. India's regulatory environment extends these timelines through additional approval requirements:
- Environmental clearance processes: 2-3 years
- Forest clearance procedures: 1-2 years
- Land acquisition negotiations: 1-3 years
- State government approvals: 6-18 months
The cumulative effect extends Indian mineral project timelines to 20-22 years minimum. This makes domestic supply response inadequate for addressing near-term import vulnerabilities. Consequently, this temporal mismatch between policy objectives and geological realities undermines strategic autonomy goals.
How Do Mine Development Timelines Impact Supply Security?
Processing Infrastructure Asymmetry:
India's mineral development strategy has consistently prioritised extraction capacity over downstream processing capabilities. This creates bottlenecks that limit value addition and supply chain integration. Crushing, concentration, beneficiation, and refining facilities require 8-12 years for construction with additional 3-5 year commissioning periods. This temporal mismatch means raw ore extraction capabilities exceed processing capacity by 20-30% across multiple mineral categories.
Case Study – Lithium Processing Requirements:
Lithium extraction from spodumene ore requires sequential processing stages that demand specialised infrastructure and technical expertise:
- Crushing and concentration: Gravity separation to achieve 6% lithium oxide content
- Roasting processes: High-temperature conversion at 1,050-1,100°C
- Acid leaching: Sulphuric acid treatment for lithium extraction
- Precipitation: Lithium carbonate or hydroxide production
Each processing stage requires $50-80 million capital expenditure for small-scale facilities. Furthermore, environmental containment systems and technical expertise create additional implementation barriers. India currently lacks established lithium processing capacity, meaning all domestic spodumene ore requires overseas processing until new facilities commission in 2027-2028 at earliest.
Graphite Processing Complexity:
Natural graphite processing for battery applications involves multiple purification stages that determine final product suitability. Spherical graphite production requires specialised equipment for particle shaping, with purification processes achieving 99.95% carbon content through hydrofluoric acid treatment. However, India's domestic graphite processing capacity handles less than 35% of current consumption, forcing continued import dependence despite significant domestic flake graphite reserves.
International Diversification Strategy: Risk-Adjusted Partnership Framework
India's mineral security depends on developing strategic partnerships that balance supply reliability against geopolitical and economic risks. The optimal diversification strategy requires sophisticated risk assessment frameworks that evaluate potential partners across multiple dimensions. These include resource quality, political stability, regulatory predictability, and existing trade relationships.
Which Countries Offer Optimal Supply Chain Diversification?
Tier 1 Strategic Partners – Australia:
Australia emerges as India's primary diversification partner due to exceptional resource endowments combined with institutional stability. Australia holds world-leading lithium reserves of 6.2 million tonnes lithium carbonate equivalent, representing approximately 42% of global identified resources. The Greenbushes mine in Western Australia produces 40,000 tonnes lithium carbonate equivalent annually, comprising 60-65% of global lithium supply outside Chinese processing operations.
Australian Mineral Resource Base:
- Lithium: 6.2 million tonnes reserves (world's largest)
- Rare Earth Elements: 3.4 million tonnes total rare earth oxides
- Nickel: 23 million tonnes identified resources
- Copper: 98 million tonnes identified resources
- Cobalt: Co-product from nickel operations
India-Australia bilateral trade in minerals reached $8.2 billion in 2023-24. This establishes Australia as India's largest critical mineral import source by value. The relationship benefits from 25+ year contract enforcement track record, transparent environmental permitting, and established dispute resolution mechanisms that reduce investment risk.
Tier 1 Strategic Partners – Canada:
Canada offers complementary mineral portfolios with particular strength in nickel, cobalt, and emerging lithium resources. However, Canada energy transition challenges highlight the importance of strategic partnerships. Canadian nickel reserves total 9.3 million tonnes, with established sulphide processing capabilities that contrast Australia's laterite-dominated resources. Canadian cobalt reserves of 500,000 tonnes provide diversification from Democratic Republic of Congo concentrate, reducing single-country dependency risks.
Canadian Strategic Advantages:
- Established mining sector governance: Mining Act frameworks with Indigenous consultation protocols
- Processing technology leadership: Hydrometallurgical expertise in nickel and cobalt refining
- ESG compliance standards: Environmental and social governance aligned with international best practices
- Currency stability: Canadian dollar provides hedging against commodity price volatility
Tier 1 Strategic Partners – Finland:
Finland provides specialised capabilities in rare earth processing and battery material refining. These complement raw material partnerships from other sources. Finnish rare earth processing facilities operate at commercial scale with established supply chains to European battery manufacturers. The country's technical expertise in hydrometallurgy offers processing technology transfer opportunities that could enhance India's domestic capabilities.
What Risk Mitigation Tools Enable Secure Supply Partnerships?
Financial Instruments for Supply Security:
Long-term offtake agreements spanning 10-20 year terms provide price stability and volume guarantees that justify upstream investment in partner countries. These agreements typically include take-or-pay provisions ensuring minimum purchase commitments, price indexation mechanisms tied to commodity benchmarks, and force majeure clauses protecting against supply disruptions.
Equity participation structures allow India to secure mineral supplies through direct ownership stakes in overseas projects. Strategic investment levels of 25-49% provide supply security without triggering foreign ownership restrictions in partner countries. This approach has proven effective in iron ore partnerships with Australia and could expand to lithium, nickel, and rare earth projects.
Operational Risk Mitigation:
- Multiple supplier arrangements: 2-3 suppliers per mineral category to prevent single-source dependency
- Strategic inventory management: 60-90 day consumption reserves for critical materials
- Processing capability development: Technology transfer agreements for domestic refining
- Currency hedging mechanisms: Financial instruments to manage exchange rate volatility
Multilateral development bank guarantees through institutions like the Asian Development Bank provide political risk insurance. These mechanisms encourage private sector investment in mineral partnerships. They reduce the cost of capital for overseas projects while providing diplomatic frameworks for dispute resolution.
Technology Transfer Integration:
Successful mineral partnerships increasingly include technology transfer components that build domestic processing capabilities over time. Hydrometallurgical processing technology for nickel and cobalt refining, lithium extraction and purification techniques, and rare earth separation processes represent priority areas for knowledge transfer agreements.
Competitive Positioning: India vs. Global Demand Centres
India enters global mineral competition at a structural disadvantage compared to established importers. These competitors have spent decades developing supply relationships, processing capabilities, and strategic partnerships. The competitive landscape for critical minerals increasingly resembles allocation rather than open market transactions. Furthermore, supplier relationships and execution capabilities determine access more than financial capacity alone.
How Does India Compare to Other Major Mineral Importers?
Table: Critical Mineral Competition Analysis
| Country/Region | Processing Capacity | Execution Speed | Capital Availability | Strategic Advantages |
|---|---|---|---|---|
| China | Very High | Very Fast | High | Vertical integration, state coordination |
| United States | Medium | Medium | Very High | Technology leadership, defence priorities |
| European Union | Medium | Slow | High | Regulatory frameworks, green transition |
| Japan | High | Fast | High | Technology partnerships, efficiency |
| South Korea | High | Fast | High | Conglomerate execution, battery focus |
| India | Low | Slow | Medium | Domestic market scale, cost competitiveness |
China's Competitive Dominance:
China controls 60-80% of global critical mineral processing capacity across lithium, cobalt, nickel, graphite, and rare earth elements. This dominance stems from coordinated state investment in processing infrastructure during the 2010-2020 period. Additionally, vertical integration from mining to battery manufacturing and cost advantages in labour-intensive refining processes contribute to this position. Chinese companies execute mineral acquisition and processing projects 2-3 times faster than Western competitors through streamlined approval processes and state financing.
United States Strategic Positioning:
The US leverages $3 billion+ annual critical mineral investments through the Defense Production Act and Inflation Reduction Act. These funding mechanisms secure supply chains effectively. American technological leadership in battery chemistry, permanent magnet alternatives, and recycling technologies provides competitive advantages. However, these offset processing capacity gaps. Dollar-denominated financing and established trade relationships facilitate rapid partnership development.
European Union Coordination Mechanisms:
The EU's Critical Raw Materials Act establishes coordinated procurement frameworks across member states. This creates collective bargaining power that individual countries cannot match. European environmental standards and social governance requirements align with resource-rich countries' sustainability objectives, providing competitive advantages in partnership negotiations.
What Competitive Disadvantages Must India Address?
Processing Capacity Constraints:
India's critical mineral supply chains face significant processing infrastructure limitations that extend beyond raw material sourcing. Battery-grade lithium processing capacity remains negligible, rare earth separation capabilities handle less than 5% of domestic consumption, and nickel refining facilities process primarily sulphide rather than laterite ores. This infrastructure gap forces value-added processing overseas, reducing economic benefits and creating additional supply chain vulnerabilities.
Execution Speed Limitations:
Indian mineral project development timelines exceed global averages by 30-50% due to regulatory complexity, environmental clearance procedures, and land acquisition challenges. Decision-making processes involving multiple government levels, state approvals, and committee structures slow partnership negotiations. Consequently, project implementation lags compared to competitors with centralised authorities.
Capital Deployment Efficiency:
While India possesses substantial foreign exchange reserves and development finance capabilities, capital allocation for mineral security remains fragmented across multiple institutions and approval processes. Private sector engagement in overseas mineral investments faces regulatory restrictions and currency controls that limit competitive flexibility.
Technology Transfer Gaps:
Critical mineral processing technologies remain concentrated in established suppliers, with limited technology transfer agreements constraining India's ability to develop autonomous capabilities. Intellectual property restrictions and technical expertise gaps in hydrometallurgy, pyrometallurgy, and advanced materials processing create long-term competitive disadvantages.
Strategic Partnership Quality:
India's critical mineral supply chains development lacks the systematic approach and institutional coordination demonstrated by competitors. Government-to-government agreements require enhancement with commercial frameworks, technical cooperation, and long-term relationship management that matches established mineral importers' capabilities.
Economic Impact Modelling: Cost-Benefit Analysis Framework
The financial implications of India's critical mineral diversification strategy extend beyond procurement costs to encompass supply security premiums, price volatility mitigation, and strategic autonomy valuations. Comprehensive economic modelling reveals that diversification investments generate risk-adjusted returns. These justify substantial capital commitments over traditional spot market purchasing approaches.
What Are the Financial Implications of Supply Chain Diversification?
Investment Requirements Analysis (2025-2035):
Overseas Asset Acquisition: $15-25 billion
- Equity stakes in lithium, nickel, and rare earth projects
- Long-term offtake agreement prepayments
- Strategic partnership development costs
- Due diligence and transaction expenses
Domestic Processing Infrastructure: $8-12 billion
- Lithium carbonate and hydroxide production facilities
- Nickel laterite processing plants
- Rare earth separation and purification complexes
- Graphite spheroidisation and purification units
Strategic Inventory Development: $3-5 billion
- 60-90 day consumption reserves for critical minerals
- Warehouse and logistics infrastructure
- Inventory management and rotation systems
- Quality control and testing facilities
Technology Transfer Programmes: $2-4 billion
- Licensing agreements for processing technologies
- Technical expertise development programmes
- Research and development partnerships
- Equipment and instrumentation procurement
Risk-Adjusted Returns Analysis:
Supply Security Premium: 15-25% cost reduction
Long-term agreements typically deliver 15-25% cost savings compared to spot market pricing through volume commitments and price stability mechanisms. Over 10-year periods, diversification strategies show net present value benefits of $8-12 billion compared to continued import dependency on volatile markets.
Price Volatility Mitigation: 30-40% variance reduction
Diversified supply portfolios reduce price volatility by 30-40% through geographic and supplier diversification. Lithium price volatility decreased from 85% annual variance to 45% annual variance. This occurred for countries with diversified supply agreements during 2020-2024 commodity cycles.
Strategic Autonomy Valuation
Energy security benefits from reduced import dependency generate economic value through reduced vulnerability to supply disruptions, enhanced negotiating position with suppliers, and strategic flexibility during geopolitical tensions. Economic modelling suggests strategic autonomy benefits of $2-4 billion annually through reduced supply chain risks.
How Do Different Diversification Scenarios Impact Economic Outcomes?
Scenario A: Accelerated Diversification (5-7 years)
Investment Profile:
- Total investment: $35-45 billion
- Annual spending: $5-7 billion
- Government funding: 40-50%
- Private sector participation: 50-60%
Risk Reduction Outcomes:
- Supply diversification: 70-80% of critical mineral requirements
- Processing capability: 60% domestic capacity
- Strategic inventory: 90-day reserves
- Technology transfer: Advanced capabilities in 4-5 mineral categories
Economic Impact:
- Enhanced energy transition speed: 2-3 years acceleration in renewable deployment
- Industrial competitiveness: 15-20% cost advantage in battery manufacturing
- Export potential: $3-5 billion annual processed mineral exports by 2035
Scenario B: Gradual Diversification (8-12 years)
Investment Profile:
- Total investment: $25-35 billion
- Annual spending: $2-4 billion
- Government funding: 50-60%
- Private sector participation: 40-50%
Risk Reduction Outcomes:
- Supply diversification: 50-60% of critical mineral requirements
- Processing capability: 40% domestic capacity
- Strategic inventory: 60-day reserves
- Technology transfer: Basic capabilities in 2-3 mineral categories
Economic Impact:
- Moderate supply security improvement: Reduced vulnerability to single-supplier disruptions
- Limited processing value addition: Continued dependence on overseas refining
- Constrained export potential: $1-2 billion annual processed mineral exports
Scenario C: Status Quo Continuation
Investment Profile:
- Total investment: Minimal incremental spending
- Continued spot market procurement
- Limited strategic partnerships
- No significant processing capability development
Risk Outcomes:
- Continued 85-100% import dependency
- Vulnerability to supply disruptions
- Price volatility exposure
- Limited strategic autonomy
Economic Impact:
- Continued vulnerability to supply shocks and price volatility
- Missed industrial development opportunities in processing and manufacturing
- Strategic disadvantage in clean energy transition timing
Implementation Roadmap: Phased Execution Strategy
Successful implementation of India's critical mineral diversification strategy requires coordinated action across multiple government levels. Furthermore, private sector engagement and international partnership development remain essential. The phased approach balances immediate supply security needs against long-term strategic capability development through systematic risk reduction and capacity building.
Phase 1: Foundation Building (2025-2027)
Priority Actions and Institutional Framework:
Establish National Critical Minerals Authority
- Centralised coordination across ministries and agencies
- Strategic planning and policy implementation oversight
- International partnership negotiation authority
- Domestic industry coordination and development support
Launch Strategic Partnership Negotiations
- Government-to-government agreements with Australia, Canada, Finland
- Framework agreements for mineral supply and investment
- Technical cooperation and technology transfer protocols
- Dispute resolution and contract enforcement mechanisms
Domestic Processing Capability Assessment
- Comprehensive evaluation of existing refining infrastructure
- Technical gap analysis for battery-grade material production
- Environmental impact assessment for processing facility development
- Skills and expertise requirements for technology transfer
Strategic Stockpile Framework Development
- Critical mineral inventory targets and management protocols
- Storage facility location and specification requirements
- Procurement and rotation procedures
- Emergency allocation and distribution systems
Key Performance Indicators (2025-2027):
- 3-5 bilateral mineral partnership agreements signed
- $3-5 billion committed to overseas mineral investments
- 2-3 domestic processing projects initiated
- 30-day strategic inventory established for priority minerals
Phase 2: Capacity Development (2027-2030)
Major Investment Execution:
Overseas Asset Acquisition Programme
- Equity stakes in 5-8 lithium, nickel, and rare earth projects
- Long-term offtake agreements covering 40-50% of projected demand
- Processing facility partnerships in supplier countries
- Technology transfer and joint venture development
Domestic Processing Infrastructure Construction
- Lithium processing facilities: 2-3 plants with 15,000-25,000 tonnes annual capacity
- Nickel laterite processing: Hydrometallurgical facilities for domestic ore
- Rare earth separation complexes: Integrated processing from concentrate to oxides
- Graphite spheroidisation plants: Battery-grade natural graphite production
Technology Transfer Implementation
- Technical expertise development through international partnerships
- Research and development collaborations with supplier countries
- Processing equipment procurement and installation
- Quality control and testing capability establishment
Supply Chain Monitoring Systems
- Real-time inventory and supply flow tracking
- Price and availability monitoring across supplier markets
- Risk assessment and early warning systems
- Alternative sourcing activation protocols
Key Performance Indicators (2027-2030):
- 40-50% supply diversification achieved across critical minerals
- $15-20 billion invested in overseas assets and partnerships
- 40% domestic processing capacity for priority minerals
- 60-day strategic inventory maintained
Phase 3: Strategic Integration (2030-2035)
Consolidation and Leadership Development:
Advanced Processing Capability Maturation
- Indigenous technology development: Domestic innovation in processing techniques
- Export-oriented production: Surplus capacity for regional supply
- Value-added manufacturing: Battery precursor and specialty chemical production
- Recycling integration: Closed-loop material recovery systems
The battery recycling breakthrough demonstrates the importance of circular economy approaches. Regional Supply Chain Leadership includes South Asian mineral cooperation with Bangladesh, Sri Lanka, and regional partnerships. Furthermore, processing hub development positions India as a regional refining centre. Technology export enables Indian processing expertise and equipment export. Additionally, standards and certification establish quality control leadership for battery materials.
Strategic Autonomy Achievement
- 70-80% supply diversification across all critical mineral categories
- 60-70% domestic processing capability for imported raw materials
- Export capacity development: $5-8 billion annual processed mineral exports
- Strategic reserve management: 90-day consumption inventory maintained
Key Performance Indicators (2030-2035):
- Regional leadership in critical mineral processing and supply
- Net exporter status in 2-3 processed mineral categories
- Strategic autonomy in mineral supply chain security
- Technology transfer to other developing economies
The next major ASX story will hit our subscribers first
Looking Ahead: Strategic Mineral Innovation
The next phase of India's critical mineral supply chains development involves embracing the big pivot strategy 2025. This approach integrates technological innovation with supply chain resilience. Additionally, Australia lithium innovations provide valuable insights for India's partnership strategies.
Strategic mineral partnerships require long-term commitment and mutual benefit frameworks. Building critical mineral stockpiles remains a key priority for India, as highlighted by international energy finance experts. The country must balance immediate supply needs against long-term processing capability development.
Frequently Asked Questions
What Makes India's Mineral Strategy Different from Other Countries?
India's approach emphasises partnership-based diversification rather than resource nationalism or friend-shoring strategies. Unlike China's state-directed vertical integration or the United States' alliance-based sourcing, India focuses on risk-adjusted portfolio development across multiple jurisdictions and supplier relationships.
The strategy prioritises processing capability development alongside raw material securing, recognising that value addition and supply security require domestic technical capabilities. This differs from pure procurement approaches that maintain processing dependencies even while diversifying raw material sources.
Geographic diversification principles guide partnership selection based on geological complementarity, political stability, and regulatory predictability rather than ideological alignment or existing trade relationships alone. This pragmatic approach maximises supply reliability while minimising geopolitical constraints.
How Long Will Implementation Take?
Meaningful supply chain diversification requires 7-10 years minimum due to the inherent timelines of mineral project development, processing facility construction, and partnership relationship maturation. However, initial risk reduction can begin immediately through strategic agreements and stockpile development.
Critical timeline factors include:
- Mineral project development: 5-8 years from exploration to production
- Processing facility construction: 3-5 years design and construction
- Technology transfer: 2-3 years for capability development
- Partnership negotiation: 1-2 years for comprehensive agreements
Accelerated implementation scenarios can achieve 40-50% diversification within 5-7 years through aggressive investment commitments and streamlined regulatory approvals. However, full strategic autonomy targets require the complete 10-year development cycle.
What Are the Biggest Implementation Risks?
Primary Risk Factors:
Regulatory Approval Delays in Partner Countries
- Environmental permitting extensions
- Indigenous consultation requirements
- Political changes affecting mining policies
- Local community engagement challenges
Capital Allocation Constraints
- Government budget limitations
- Private sector investment restrictions
- Foreign exchange controls
- Competing development priorities
Technology Transfer Limitations
- Intellectual property restrictions
- Technical expertise gaps
- Equipment import dependencies
- Quality control challenges
Geopolitical Relationship Changes
- Trade policy modifications
- Diplomatic tensions with partner countries
- International sanctions affecting partnerships
- Strategic competition influence on supplier relationships
Commodity Price Volatility During Transition
- Investment timing risks
- Long-term contract price adjustment challenges
- Economic viability of processing facilities
- Strategic stockpile valuation fluctuations
Risk Mitigation Approaches:
- Diversified supplier portfolios reduce single-country dependency
- Flexible contract structures accommodate price and volume variations
- Political risk insurance protects overseas investments
- Technology partnerships with multiple suppliers reduce knowledge concentration
Success Probability Assessment:
With proper planning, adequate capital commitment, and coordinated government support, India's critical mineral supply chains strategy has 70-80% probability of achieving primary objectives within planned timelines. However, partial implementation scenarios (50-60% diversification) represent more realistic base-case outcomes given implementation complexity and external uncertainties.
This analysis draws primarily from the CETEx-LSE report "Options for Diversifying India's Critical Mineral Supply Chains" (Martínez JP, Bansal K, Sivamani G, 2025) and additional research from government agencies, international organisations, and industry sources. Investment projections and risk assessments represent analytical estimates based on available data and may vary based on implementation decisions and market conditions.
Ready to Position Yourself in the Next Mineral Discovery?
The complex landscape of critical mineral supply chains creates unprecedented opportunities for informed investors. Discovery Alert's proprietary Discovery IQ model provides real-time alerts on significant ASX mineral discoveries, transforming complex geological data into actionable investment insights that help position you ahead of market movements before widespread recognition occurs.