
July 17, 2026
India's Energy Storage Capacity Expansion: A Grid Transformation Decades in the Making
Electricity grids are fundamentally physical systems governed by one unforgiving constraint: generation and consumption must balance in real time, every second of every day. For most of the twentieth century, this balance was maintained through controllable thermal generation that could ramp up or down on demand. The widespread addition of solar and wind power has disrupted that model at its core, because renewable output follows nature's schedule rather than human demand patterns.
The faster renewables grow within a national grid, the more urgent the need becomes for technologies that can bridge the gap between when electricity is produced and when it is actually needed. This growing urgency is being felt across markets globally, driven in large part by battery storage expansion and the increasing role of critical minerals demand in shaping long-term grid strategy.
India is experiencing this tension at a scale matched by very few countries globally. Its renewable capacity additions are accelerating, its peak demand is rising, and its evening hours present a growing structural mismatch between supply and load. India energy storage capacity expansion is no longer a policy aspiration on a planning document. It is a system-design imperative backed by official projections with timelines stretching to 2035-36.
When big ASX news breaks, our subscribers know first
What the Numbers Actually Tell Us About India's Storage Trajectory
The Ministry of Statistics and Programme Implementation (MoSPI) released a quarterly update through its PAIMANA (Project Assessment, Infrastructure Monitoring and Analytics for Nation-building) Performance Monitoring Dashboard that places the scale of the coming storage buildout in clear numerical terms.
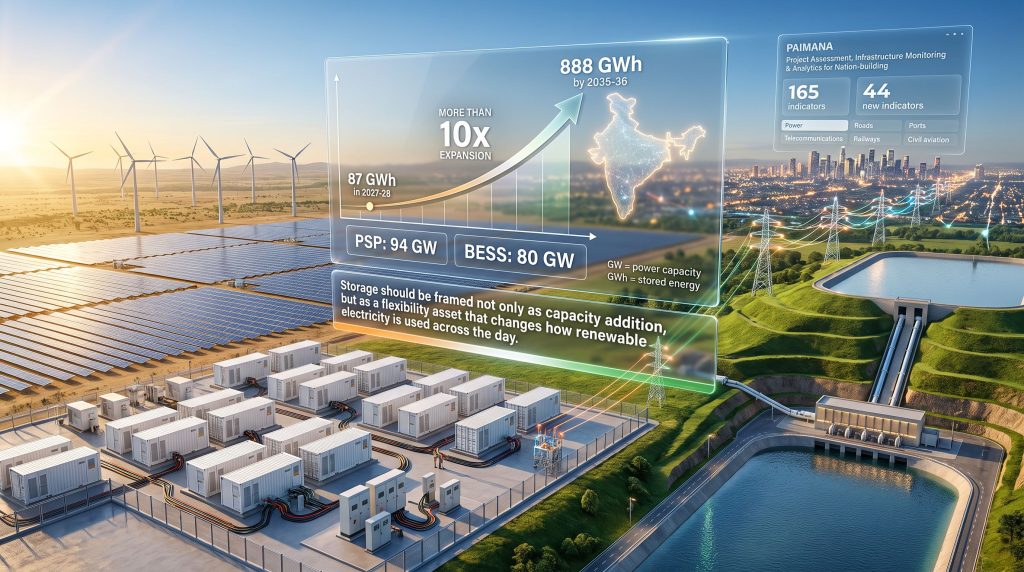
India's energy storage requirement is projected to climb from 87 GWh in 2027-28 to 888 GWh by 2035-36, representing a growth of more than tenfold within a single decade. On the installed capacity side, Pumped Storage Plants (PSPs) are expected to reach 94 GW while Battery Energy Storage Systems (BESS) are projected to reach 80 GW by the same endpoint.
| Metric | Base Period | 2035-36 Projection | Net Increase | Strategic Implication |
|---|---|---|---|---|
| Energy storage requirement | 87 GWh (2027-28) | 888 GWh | +801 GWh | Grid-scale flexibility becomes essential infrastructure |
| PSP installed capacity | Current trajectory | 94 GW | Significant scale-up | Long-duration balancing across renewable corridors |
| BESS installed capacity | Current trajectory | 80 GW | Significant scale-up | Fast-response firming and frequency regulation |
These are not aspirational targets announced in isolation. They emerge from a monitoring framework that now covers 165 indicators across six key infrastructure sectors, including civil aviation, roads, power, ports, telecommunications, and railways. The dashboard recently expanded by 44 new indicators, signalling a deepening of analytical granularity rather than a broadening of ambition.
Furthermore, according to IEEFA, India's energy storage push is gathering meaningful momentum, even as tariff viability and financing hurdles remain significant challenges to be resolved across the sector.
Storage should be understood not simply as capacity addition, but as a flexibility asset that fundamentally changes how renewable electricity flows across the day and across seasons.
Understanding the Difference Between GW and GWh in Storage Planning
One of the most persistent sources of confusion in energy storage reporting is the interchangeable use of gigawatts (GW) and gigawatt-hours (GWh), two related but distinct measurements.
- GW (gigawatts) measures power capacity, which is the rate at which electricity can be delivered at any given instant. It tells you how fast a storage system can discharge.
- GWh (gigawatt-hours) measures stored energy, which is how much total electricity is held in reserve. It tells you how long a storage system can sustain that output.
A practical illustration: two storage facilities both rated at 1 GW of power capacity could be vastly different in value if one holds 2 GWh of energy (two hours of discharge) while the other holds 8 GWh (eight hours). The second provides far greater system benefit during extended demand peaks or prolonged periods of low renewable generation.
This is why India's trajectory must be evaluated on both metrics simultaneously. The jump from 87 GWh to 888 GWh in storage requirements captures the duration dimension, while the 94 GW and 80 GW figures capture the instantaneous delivery scale. In addition, the broader role of battery raw materials in determining project economics cannot be overlooked at this scale.
Why BESS and Pumped Storage Are Serving Different Grid Roles
Despite competing for the same overarching grid function, Battery Energy Storage Systems and Pumped Storage Plants operate in quite different technical and economic niches within India's grid architecture.
Where BESS Has a Structural Advantage
Battery storage is most competitive in applications where speed, modularity, and siting flexibility matter most. Key areas where BESS is likely to dominate include:
- Fast-response frequency regulation and ancillary services
- Solar firming in states with high photovoltaic penetration
- Co-location with renewable generation facilities to reduce curtailment at the project level
- Urban industrial load centres where land scarcity makes large hydro-linked infrastructure impractical
- Short to medium-duration balancing across the morning and evening transition hours
Where Pumped Storage Retains a Competitive Edge
Pumped Storage Plants (PSPs) involve moving water between two reservoirs at different elevations, using surplus electricity to pump water uphill and recovering it as hydroelectric generation during high-demand periods. Their advantages are concentrated in different use cases:
- Long-duration energy storage measured in hours or across time blocks rather than minutes
- Seasonal shifting of renewable generation where wind or solar patterns create extended surplus periods
- Bulk balancing across high-renewable transmission corridors
- Lower per-MWh lifecycle costs in geographically suitable locations, where topography and water availability align
Technology Comparison at a Glance
| Attribute | BESS | PSP | Best-Fit Use Case in India |
|---|---|---|---|
| Construction speed | Fast (months) | Slow (years) | BESS for rapid response capacity |
| Storage duration | Typically 2-6 hours | 6-24+ hours | PSP for overnight and multi-block shifting |
| Site dependence | Low | High (topography, water) | BESS for urban and flat-terrain states |
| CAPEX profile | Higher per MWh currently | Lower per MWh at scale | PSP where geography favours it |
| Operational flexibility | Very high | Moderate | BESS for frequency and balancing markets |
| Grid services capability | Broad (frequency, voltage) | Primarily energy arbitrage | Both serve complementary roles |
| Environmental complexity | Moderate | High (hydrology, ecology) | BESS in sensitive ecosystems |
It is worth noting that technology suitability in any specific project depends on round-trip efficiency assumptions, duration requirements, local water and land constraints, grid congestion profiles, and the design of state-level tenders. These variables can shift the economics considerably from one location to another.
The Balancing Problem Storage Is Built to Solve
India's emerging grid challenge is structural rather than exceptional. Solar generation peaks during midday hours, typically between 10am and 2pm, while electricity demand peaks in the evening between 6pm and 10pm. Without storage, this misalignment creates a series of cascading problems.
Without storage integration:
- Midday solar surplus cannot be absorbed, leading to curtailment
- Grid operators must rely on thermal peakers to cover the evening ramp
- Thermal units cycled aggressively for short evening periods face efficiency and maintenance penalties
- Transmission congestion intensifies in renewable-heavy corridors during peak solar hours
- Balancing costs rise as the renewable share grows
With storage integration:
- Midday surplus is captured and shifted to evening peak demand periods
- Thermal cycling is reduced, improving heat rate and asset longevity
- Curtailment falls, improving the economics of renewable project developers
- Grid frequency stability improves through faster response capability
- Transmission assets are used more efficiently by smoothing generation profiles
This is the economic and operational rationale behind India's projected storage requirement growing from 87 GWh to 888 GWh. The number is not arbitrary. It reflects modelled scenarios in which renewable penetration rises substantially, demand grows with electrification and economic expansion, and the system requires sufficient flexibility to remain reliable across all hours of the day. Consequently, energy transition mining and the supply chains it supports will play an increasingly central role in enabling this transformation.
What the PAIMANA Dashboard Reveals About Infrastructure Monitoring Maturity
The PAIMANA framework, maintained by MoSPI, functions as a unified digital interface enabling policymakers, researchers, and sector stakeholders to access time-series infrastructure data with interactive visualisation tools. Its expansion to 165 indicators with 44 newly added metrics in the latest quarterly update reflects a qualitative upgrade in how India tracks infrastructure performance.
Cross-sector data within the same quarterly release reveals a broader pattern of infrastructure scaling:
- Mobile tower count reached 8.55 lakh, representing 3.7% year-on-year growth
- Base Transceiver Stations (BTS) rose to 32.25 lakh, up 7.4% year-on-year
- Tele-density improved to 93.26% in FY2025-26, indicating deeper rural and urban connectivity penetration
- Electronic toll collection transactions reached Rs 88 crore, growing 39.7% year-on-year in FY2026-27 up to May
These figures are not directly linked to storage deployment outcomes, but they illustrate a consistent pattern. India's infrastructure monitoring and digital adoption capacity is strengthening across sectors simultaneously, which has indirect value for grid management. Smart grid operations, demand-side management, and distributed energy resource coordination all depend on telecommunications infrastructure of the kind reflected in these metrics.
The next major ASX story will hit our subscribers first
The Bottlenecks That Could Determine Whether Projections Become Reality
Projections of this scale deserve scrutiny across three distinct axes. The difference between a storage project appearing on a planning chart and delivering grid services commercially is considerable.
Can It Be Built?
- Land acquisition processes can add years to project development, particularly for PSPs in ecologically sensitive terrain
- Transmission connectivity for storage facilities requires coordination with grid operators and often faces independent queuing delays
- Environmental clearances for pumped storage involve hydrological assessments, biodiversity impact reviews, and water rights allocations that are not straightforward in contested river basins
- Battery supply chains remain partially import-dependent, creating cost and availability exposure particularly for cell chemistries and power electronics
Can It Be Financed?
- Standalone storage projects without long-term offtake agreements face higher perceived revenue risk from lenders
- Ancillary service markets in India remain at an early stage, limiting the monetisation pathways available for fast-response storage
- Tender structures that award capacity without adequately pricing duration can disadvantage longer-duration projects, distorting technology selection
- Distribution company payment reliability has historically been a concern for infrastructure investors, and storage assets inherit that counterparty risk profile
Can It Be Dispatched Profitably?
- Duration mismatch between project design and actual grid needs can suppress utilisation rates
- BESS assets face cell degradation that must be planned into revenue models over a fifteen to twenty year asset life
- Dispatch optimisation requires energy management software, accurate generation and demand forecasting, and operational protocols that many grid operators are still developing
- Fire safety standards for large-scale battery installations are still evolving, creating regulatory and insurance uncertainties
However, developments are encouraging. India added 4.6 GWh of energy storage capacity in the first quarter of 2026 alone, suggesting that execution momentum is beginning to translate ambition into deployed capacity at a meaningful scale.
Decision-Useful Metrics Beyond Nameplate Capacity
For analysts and policymakers evaluating the progress of India energy storage capacity expansion, raw installed capacity figures in GW provide an incomplete picture. A more rigorous assessment requires tracking a broader set of operational metrics.
| Commonly Cited Metric | What It Tells You | What It Misses | Better Companion Metric |
|---|---|---|---|
| Installed GW | Maximum power delivery rate | Duration, utilisation, degradation | GWh capacity and cycling intensity |
| Total GWh | Maximum stored energy | Actual dispatch patterns | Usable energy throughput per year |
| CAPEX per MW | Upfront cost | Operating cost, replacement cycles | Levelised cost of storage (LCOS) |
| Project count | Pipeline activity | Completion rates, commercial operation dates | Operating capacity as share of total awarded |
| Tariff won at auction | Price competitiveness at point of award | Revenue adequacy over full asset life | Revenue per MWh over contract term |
Tracking these deeper metrics over time provides a far more reliable signal of whether India's storage ambitions are converting into functional grid assets or accumulating as awarded-but-unbuilt pipeline. Furthermore, advances in direct lithium extraction technology could meaningfully reduce input costs for BESS deployment over the medium term, improving the economics of projects currently on the margins of financial viability.
Economic Implications Across Two Possible Pathways
The economic stakes of India's storage buildout differ substantially depending on execution speed.
| Scenario | Renewable Integration | Grid Stability | Curtailment Rates | Peak Power Costs | Thermal Dependence |
|---|---|---|---|---|---|
| High-storage pathway | Rapid, efficient | Strong | Low | Moderate and declining | Falls materially |
| Delayed-storage pathway | Constrained by balancing limits | Fragile during transitions | Elevated | Volatile, structurally high | Persists longer than planned |
The high-storage pathway involves substantial upfront capital spending on both BESS and PSP assets, grid upgrade requirements to connect storage facilities, and investments in market design reform and operational training. These costs are real and front-loaded.
The benefits, including lower curtailment losses, reduced reliance on expensive short-run peaking plant, and improved transmission utilisation, accumulate over the medium to long term. The delayed pathway avoids near-term capital deployment but sustains higher system operating costs and constrains the pace at which renewable capacity can be usefully absorbed.
Key Takeaways: India's Storage Buildout in Summary
- India's energy storage requirement is projected to grow from 87 GWh in 2027-28 to 888 GWh by 2035-36, a more than tenfold increase
- Installed capacity is expected to reach 94 GW for Pumped Storage Plants and 80 GW for Battery Energy Storage Systems by 2035-36
- BESS and PSP serve complementary rather than competing roles, with BESS suited to fast-response and short-duration applications and PSP suited to bulk long-duration balancing
- The MoSPI PAIMANA dashboard now tracks 165 indicators across six infrastructure sectors, providing time-series visibility into delivery performance
- Projections assume continued renewable capacity growth, demand expansion through electrification, and sustained policy focus on grid reliability
- Execution quality across land, finance, and dispatch dimensions will ultimately determine how much of the planned capacity delivers measurable grid value
Readers seeking additional context on India energy storage capacity expansion and the broader infrastructure performance monitoring framework may find value in reviewing publicly available documents from the Ministry of Power, the Central Electricity Authority (CEA), the Ministry of New and Renewable Energy (MNRE), and MoSPI's quarterly PAIMANA updates. All projections referenced above reflect modelled scenarios and should be interpreted alongside the assumptions on demand growth, renewable mix, and storage duration that underpin them.
Want to Know Which ASX Discoveries Are Powering the Energy Storage Revolution?
Discovery Alert's proprietary Discovery IQ model scans ASX announcements in real time, instantly identifying significant mineral discoveries tied to the battery materials and critical minerals driving India's tenfold storage expansion — from lithium to the commodities underpinning both BESS and pumped hydro infrastructure. Explore how historic discoveries have generated substantial returns for early investors, and begin your 14-day free trial today to position yourself ahead of the next major find.