
August 8, 2026
When Recovery Masks Vulnerability: Reading India's Gas Market Reset
The global liquefied natural gas market has long operated on a paradox: the moments when demand appears healthiest are often the moments when structural fragilities become most exposed. When consumption rebounds sharply after a period of compression, the instinct among analysts is to celebrate the recovery. But a more disciplined reading asks a harder question: what is the quality of that recovery, and how durable is the foundation beneath it?
India's natural gas sector in mid-2026 offers precisely this kind of diagnostic challenge. India gas demand returns to pre-disruption levels on the surface with encouraging numbers. Dig deeper, however, and the picture becomes considerably more complex, layered with import dependency, supplier concentration risk, and global competition dynamics that complicate any straightforward optimistic narrative.
When big ASX news breaks, our subscribers know first
Understanding the Recovery Baseline: What June 2026 Actually Tells Us
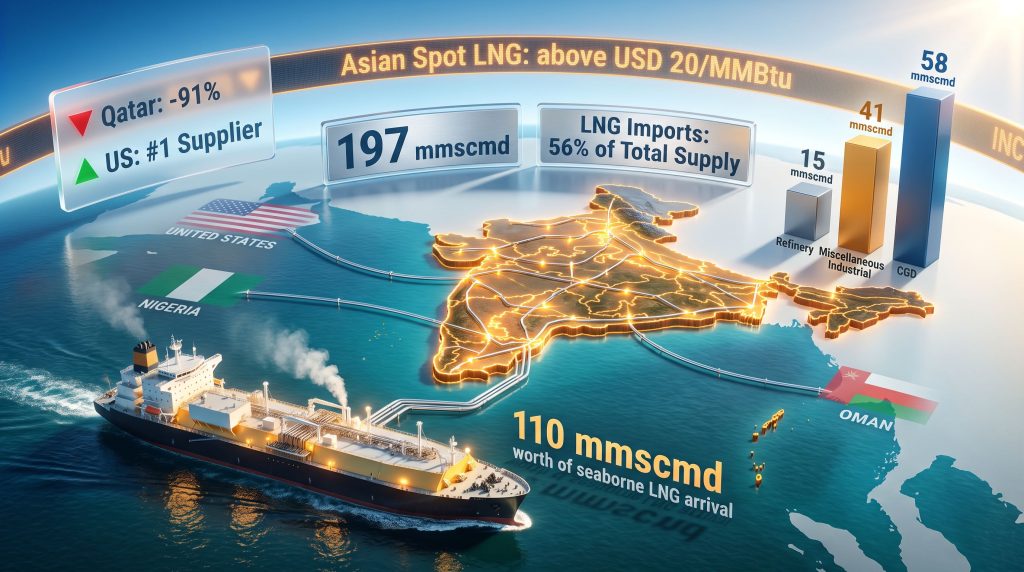
Before examining where India's gas market is heading, it is worth establishing what the recovery data actually represents. February 2026 serves as the pre-disruption consumption benchmark, the reference level against which the subsequent demand compression and eventual recovery are measured. India gas demand returns to pre-disruption levels when June 2026 consumption reaches 197 mmscmd (million metric standard cubic metres per day), sitting approximately 1.4% above that February baseline.
This is not merely a rebound. The distinction between demand resilience and demand growth matters enormously here. A resilient market recovers what was lost. A growing market builds structurally above prior peaks. June's data contains elements of both, but the composition of that growth reveals where the real story lies.
Total gas consumption climbed 7% month-on-month and 2% year-on-year to 197 mmscmd. Excluding power sector demand, the non-power consumption figure of 176 mmscmd grew at a faster pace, rising 4% year-on-year versus the 2% rate for total consumption. This divergence is analytically significant. Furthermore, when non-power demand grows faster than headline consumption, it indicates that industrial users, city gas networks, and commercial consumers are pulling more gas independently of weather-sensitive power generation cycles.
Non-power gas consumption rising at twice the year-on-year rate of total consumption points to a broadening of India's gas demand base across industrial and commercial end-users. This is the kind of diversification that underpins long-duration demand growth rather than cyclical spikes.
Critically, the May 2026 data revisions reframe this entire recovery timeline. Initial estimates placed May consumption at 169 mmscmd. Revised figures moved that figure to 184 mmscmd, a substantial upward adjustment. Similarly, LNG import volumes for May were revised from 83 mmscmd to 97 mmscmd. The implication is that the recovery was stronger and earlier than market participants initially understood, meaning forecasting models built on preliminary May data were systematically underestimating India's demand trajectory.
Sector-by-Sector Breakdown: Where Gas Demand Is Actually Growing
The aggregate recovery number conceals as much as it reveals. Decomposing the 197 mmscmd total by end-use sector exposes the structural architecture of the demand recovery and highlights where growth is durable versus where it remains fragile. For a broader view of natural gas price trends and how they intersect with demand signals, sector-level analysis remains indispensable.
City Gas Distribution: The Long-Duration Demand Engine
City gas distribution, commonly referred to as CGD, contributed 58 mmscmd in June 2026, rising 2.3 mmscmd month-on-month. CGD is widely regarded among energy analysts as the most structurally durable component of India's gas demand system for several reasons:
- Urban expansion is steadily increasing the number of households connected to piped natural gas networks
- Vehicle conversion programmes, particularly compressed natural gas adoption in transport, add sticky baseload demand that does not easily reverse
- Household piped gas penetration deepens with each infrastructure extension, creating installed demand that grows incrementally over years
- CGD tariffs are typically regulated, insulating distribution companies from short-term LNG price volatility in ways that industrial buyers are not
This combination of factors makes CGD consumption a reliable long-horizon anchor for India's gas demand, even as other sectors cycle through periods of softness.
Industrial and Refinery Consumption: Broad-Based Momentum
Miscellaneous industrial demand climbed 3.9 mmscmd to reach 41 mmscmd, representing the largest absolute month-on-month increase among individual demand categories. Refinery gas consumption added 2.6 mmscmd to reach 15 mmscmd, supported by a 25% rise in refinery-linked LNG imports. Fertiliser and power sector demand also improved on a month-on-month basis.
The breadth of this industrial recovery matters. When demand growth is concentrated in a single sector, it raises questions about sustainability. Consequently, when it spreads across manufacturing, refining, fertiliser production, and power generation simultaneously, the recovery carries more structural credibility. The India LNG import structure plays a meaningful role in shaping how cost-effectively these industrial sectors can access global supply.
Petrochemical Sector: The Notable Laggard
Against this broadly positive picture, petrochemical gas consumption stands out as the sector that has not kept pace. Recovery to 7 mmscmd still leaves petrochemical demand meaningfully below year-ago levels. This matters not only as a measure of current consumption but as a forward indicator of potential upside. A full petrochemical recovery, if and when it materialises, would add incremental volume to an already-recovering total, creating additional LNG import demand at a time when global cargo availability is already under pressure.
| Sector | June 2026 Consumption (mmscmd) | MoM Change | YoY Trend |
|---|---|---|---|
| City Gas Distribution (CGD) | 58 | +2.3 mmscmd | Positive |
| Miscellaneous Industrial | 41 | +3.9 mmscmd | Positive |
| Refinery | 15 | +2.6 mmscmd | Positive |
| Petrochemical | 7 | Recovery | Below year-ago |
| Fertiliser | Improved | Positive | Positive |
| Power | Improved | Positive | Positive |
| Total Gas Consumption | 197 | +7% MoM | +2% YoY |
The Import Dependence Threshold: When Structural Reliance Becomes Strategic Risk
The single most consequential finding within India's June 2026 gas data is not the headline consumption figure. It is the 56% import dependence ratio, a level reached because domestic gas production held flat at 87 mmscmd month-on-month while contracting 8% year-on-year. According to the IEA, India's natural gas demand is set for a 60% rise by 2030, supported by an upcoming global LNG supply wave — making this import exposure trend even more consequential over the medium term.
LNG imports surged to 110 mmscmd, rising 13% month-on-month and 10% year-on-year, absorbing every incremental unit of demand recovery. The domestic production side of the equation contributed nothing to June's growth. Every additional cubic metre of gas consumed by India in June came from an international market that is simultaneously tightening.
With domestic supply declining at 8% annually while LNG imports now represent 56% of total gas consumption, India has crossed a threshold where its energy security is materially exposed to global LNG price cycles, geopolitical supply shifts, and shipping infrastructure constraints. A demand recovery built entirely on import growth is a fundamentally different proposition than one supported by domestic production gains.
The upstream production constraint in India reflects a combination of factors: mature field depletion at legacy production sites, challenges in attracting sufficient exploration investment into deepwater and frontier acreage, and the long lead times required to convert discovered reserves into producing output. These are not problems that respond quickly to policy changes, which is why the domestic supply trajectory over the medium term will remain a structural drag on India's energy security equation even as demand grows.
India's LNG Supplier Mix Has Fundamentally Shifted
Perhaps the most geopolitically striking aspect of India's mid-2026 gas market data is the transformation of its LNG supplier hierarchy. During the May–July 2026 window, Qatar's LNG volumes to India collapsed by 91%. This is an extraordinary contraction by any measure, and its causes — whether pricing disputes, contractual renegotiations, logistical factors, or geopolitical dynamics — remain subject to analysis. What is clear is that the gap was filled, and the entities that filled it represent a materially different supplier landscape.
| LNG Supplier to India (May–July 2026) | Position | Volume Context |
|---|---|---|
| United States | #1 Largest Supplier | Significant volume increase |
| Nigeria | #2 | Stepped in to offset Qatar shortfall |
| Oman | #3 | Regional proximity advantage |
| Qatar | Sharply reduced | -91% year-on-year collapse |
Total LNG imports during the May–July period reached approximately 7 million tonnes, rising 15% year-on-year despite the Qatar supply collapse. This is a remarkable outcome: India absorbed a near-total loss of its historically significant Qatar supply relationship and still grew total LNG import volumes by double digits.
The US as India's Primary LNG Source: Strategic Dimensions
The emergence of the United States as India's largest LNG supplier during this period carries implications that extend well beyond energy commodity flows. US LNG supply to Asia is typically structured through long-term sales and purchase agreements or portfolio supply arrangements, often priced on a Henry Hub-linked basis with liquefaction and shipping costs added separately. This pricing structure means Indian buyers face different cost exposure dynamics compared to oil-indexed Qatari contracts.
The geopolitical dimension is equally notable. Deepening US–India energy trade relationships strengthen bilateral economic ties and create commercial interdependencies that extend across the broader strategic partnership framework. However, the US-China trade impacts on global LNG cargo routing and pricing also indirectly influence how efficiently US volumes reach Asian buyers, including India.
Global Competition Is Intensifying: China, Europe, and the Spot Price Ceiling
India's demand recovery is unfolding against an increasingly competitive global LNG backdrop. Two concurrent forces are compressing the availability of flexible spot cargoes precisely when India's need for discretionary LNG supply is growing. Understanding the global LNG supply outlook is therefore essential context for any forward-looking assessment of India's procurement environment.
China's Buying Surge and Asian Price Pressure
Stronger Chinese LNG procurement is reducing the pool of flexible spot cargoes available to other Asian buyers. China's LNG demand cycles have a well-documented historical relationship with Asian spot price movements: when Chinese state-linked buyers enter the spot market aggressively, benchmark prices respond swiftly. Asian spot LNG prices crossed USD 19 per MMBtu in July 2026 and have since risen above USD 20 per MMBtu, a level that begins to test the price tolerance of India's more price-sensitive buyer segments.
Price sensitivity varies significantly across India's demand sectors:
- Fertiliser producers operate with government-regulated end-product prices, limiting their ability to absorb input cost increases without either subsidy support or demand destruction
- Power generators face competition from renewables and coal at higher gas prices, making gas-fired power economically marginal above certain LNG price thresholds
- CGD operators have greater ability to pass costs through to end consumers, though regulatory lag in tariff adjustments can create short-term margin compression
- Industrial users have variable tolerance depending on the gas intensity of their processes and availability of alternative fuel substitutes
The European Storage Deficit: An Underappreciated Global Pressure Variable
European gas price pressures and storage levels remaining below historical seasonal averages create a secondary competitive pull on global LNG supply that is sometimes underweighted in India-focused demand analyses. When European storage operators need to accelerate restocking, they redirect flexible LNG cargoes that might otherwise have moved to Asian markets. The compounding effect of simultaneous Chinese demand strength and European storage restocking creates a particularly challenging environment for price-sensitive Asian spot buyers.
If both European storage restocking and elevated Chinese LNG procurement persist through the fourth quarter of 2026, Asian spot prices could remain sustained above USD 20 per MMBtu, creating conditions where India's spot market procurement becomes progressively more expensive at precisely the moment when its domestic supply base is contracting.
The next major ASX story will hit our subscribers first
Near-Term Outlook: What the Second Half of 2026 Holds
July and August: Momentum Softens but Structural Recovery Holds
Analysis of forward demand indicators suggests July 2026 volumes will remain robust but marginally softer than June, with the primary moderating factor being reduced gas-fired power generation as seasonal cooling demand eases. Non-power demand is expected to sustain its recovery trajectory, providing a floor under total consumption.
August presents a more nuanced outlook. Seasonal softness is anticipated across multiple demand segments, and reduced consumption from Morbi-linked industrial users represents a specific identifiable downside risk. Whether this August softening constitutes a temporary seasonal pause or an early indicator of broader demand fragility will be an important signal for market participants to monitor. IEEFA's analysis of drivers and barriers in Asia's gas and LNG demand provides additional context for understanding how these near-term fluctuations fit within wider regional demand patterns.
The New Supply Wave: Structural Relief or Logistical Obstacle Course?
New LNG liquefaction capacity coming online globally over the medium term theoretically improves cargo availability. However, three structural constraints limit how much of this supply increment will reach Indian buyers at competitive economics:
- Shipping bottlenecks: Extended vessel delivery timelines and elevated freight costs erode the cost advantage of new supply capacity, particularly from distant export terminals
- Sanctions exposure: Certain supplier nations with significant new liquefaction capacity face trade restrictions that limit cargo routing flexibility and create commercial risk for buyers
- Payment and settlement complexity: Non-traditional supplier relationships introduce settlement currency risks and banking intermediation challenges that increase transaction costs and procurement complexity
The timeline gap between new capacity commissioning and Indian buyers actually accessing improved supply at competitive prices is likely measured in multiple quarters, not weeks.
Frequently Asked Questions: India Gas Demand and LNG Market Dynamics
What does India gas demand returns to pre-disruption levels actually mean?
The February 2026 consumption level serves as the pre-disruption benchmark. June 2026's total gas consumption of 197 mmscmd represents a return to and slight exceeding of that reference point, sitting approximately 1.4% above the February baseline. The recovery is notable because it is broad-based across sectors rather than concentrated in a single demand category.
Why did LNG imports surge even though domestic supply stayed flat?
Domestic gas production at 87 mmscmd could not meet the recovering demand. The 8% year-on-year decline in domestic output means that every unit of new demand must be sourced externally. LNG imports at 110 mmscmd filled this gap, pushing import dependence to 56% of total consumption. Upstream production constraints in India, including mature field depletion and long exploration-to-production lead times, prevent domestic supply from responding quickly to demand signals.
How does Chinese LNG buying affect Indian procurement costs?
Chinese purchasing of flexible spot cargoes reduces the pool available to other Asian buyers, including India. With less supply competing for the same demand, Asian benchmark spot prices rise. India is a significant spot market participant for discretionary LNG volumes above its contracted supply, meaning elevated spot prices directly increase procurement costs for Indian buyers sourcing beyond their long-term agreements.
Which sectors are most vulnerable to elevated spot LNG prices?
Fertiliser producers and gas-fired power generators carry the highest price sensitivity, as both operate in markets where end-product pricing limits input cost pass-through capacity. CGD operators have relatively more ability to adjust tariffs, though regulatory timing creates short-term exposure. Industrial users vary widely based on gas intensity and fuel-switching alternatives available to their specific processes.
Key Takeaways for Energy Market Observers
The data architecture surrounding India's mid-2026 gas consumption tells a story that simultaneously confirms recovery and exposes vulnerability. Consider the core structural realities:
- India's total gas consumption at 197 mmscmd has recovered to and slightly exceeded pre-disruption February 2026 levels, with non-power demand growth of +4% year-on-year outpacing the headline +2% YoY total
- LNG now represents 56% of total gas supply, a structural dependence level that exposes India to global price cycles and geopolitical supply disruptions with limited domestic production buffer
- The 91% collapse in Qatari LNG volumes during May–July 2026 was absorbed through diversification, with the US, Nigeria, and Oman collectively filling the gap while total imports still rose 15% year-on-year
- Asian spot LNG prices above USD 20 per MMBtu combined with Chinese demand strength and European storage deficits create a compressed global cargo availability environment that threatens India's ability to source affordable discretionary volumes
- August 2026 demand is expected to moderate due to seasonal factors, with Morbi-related industrial consumption and power sector seasonality identified as specific downside contributors
- Medium-term supply relief from new global LNG capacity faces meaningful delivery constraints through shipping, sanctions exposure, and payment complexity that extend the timeline before Indian buyers benefit at competitive prices
Disclaimer: This article contains forward-looking analysis, demand projections, and scenario modelling based on publicly available market data and analyst assessments. These projections involve assumptions and uncertainties that may cause actual outcomes to differ materially. Nothing in this article constitutes financial, investment, or trading advice. Readers should conduct their own due diligence before making any investment or procurement decisions.
Want To Stay Ahead of the Next Major Resource Discovery Before the Market Reacts?
While India's shifting LNG dynamics underscore how quickly energy supply chains can reshape commodity demand, Discovery Alert's proprietary Discovery IQ model scans ASX announcements in real time, instantly alerting subscribers to significant mineral discoveries across 30+ commodities before the broader market catches on — explore historic discovery returns to see what early positioning can mean, or begin your 14-day free trial today to secure a market-leading edge.