
June 14, 2026
Understanding the IIP: India's Industrial Health Check and Why March Matters
Few economic instruments cut through the noise of short-term market volatility quite like a nation's industrial production index. For emerging economies navigating the competing pressures of domestic consumption, global trade headwinds, and infrastructure ambition, monthly industrial output data provides a uniquely candid snapshot of where real economic activity stands, stripped of sentiment and narrative.
India's Index of Industrial Production, compiled and released by the National Statistics Office under the Ministry of Statistics and Programme Implementation, is precisely this kind of instrument. It tracks output across three foundational pillars of the industrial economy: manufacturing, which carries the dominant weight of approximately 77.6% in the index basket; mining, contributing around 14.4%; and electricity generation, accounting for roughly 8%.
The March reading carries particular analytical weight because it closes the Indian financial year, which runs from April through March. This makes it both a final chapter in the year's industrial story and an opening clue about the trajectory heading into the new fiscal cycle. Official data is typically released with a lag of approximately six weeks following the reference month, meaning the March 2026 figures, published in late April 2026, carry the additional significance of informing early assessments of how the full fiscal year performed.
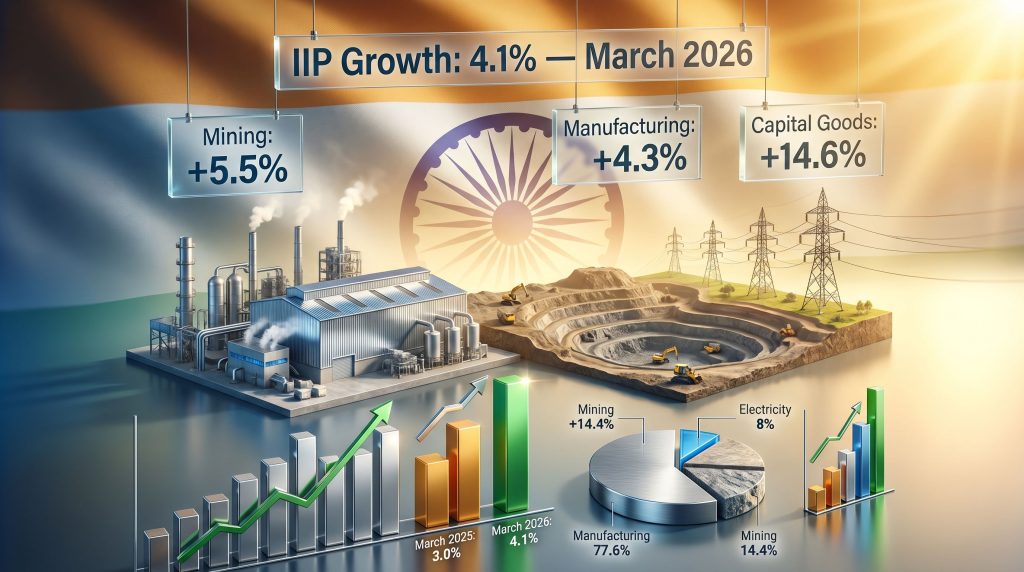
India industrial production growth of 4.1% in March 2026 tells a nuanced story, one that rewards careful sectoral reading rather than headline acceptance.
When big ASX news breaks, our subscribers know first
How the 4.1% March 2026 Reading Fits Into a Longer Industrial Cycle
Context transforms data points into insights. Viewed in isolation, a 4.1% expansion in industrial output sounds unremarkable. Positioned within the four-year trajectory of India's IIP performance, however, the picture becomes considerably more instructive.
The preceding fiscal year, FY2024-25, closed with cumulative IIP growth of 4.0%, widely regarded as the softest full-year performance in four years. March 2025 itself delivered a relatively subdued 3.0% monthly reading, reflecting a period of manufacturing softness and constrained mining activity. The contrast with March 2026's 4.1% is therefore meaningful, representing a year-on-year improvement of 110 basis points in the headline growth rate.
The month immediately preceding, February 2026, had recorded a stronger 5.2% expansion, powered in part by a manufacturing surge of approximately 6%. The step-down from 5.2% in February to 4.1% in March 2026 points to some moderation in momentum at the fiscal year-end, though the directional trend from a year earlier remains constructive.
| Reference Period | IIP Growth Rate | Key Driver |
|---|---|---|
| March 2024 | 4.9% | Manufacturing (+5.2%), Electricity (+8.6%) |
| FY2023-24 Full Year | 5.8% | Broad-based industrial recovery |
| March 2025 | 3.0% | Manufacturing slowdown, mining contraction |
| FY2024-25 Full Year | 4.0% | Weakest four-year annual performance |
| February 2026 | 5.2% | Manufacturing surge (~6%) |
| March 2026 | 4.1% | Manufacturing + Mining leadership |
The broader pattern visible in this table suggests India's industrial economy experienced its most difficult period in FY2024-25 and is now recovering incrementally rather than sharply. That distinction matters: a gradual recovery is typically more durable than a sharp rebound that risks reverting on cyclical pressure.
Sectoral Breakdown: What Actually Drove the March 2026 Numbers
Manufacturing: Breadth Over Concentration
Manufacturing's 4.3% expansion in March 2026 was not simply a function of one or two dominant sub-sectors pulling the average upward. Official data confirms that 14 of 23 manufacturing industry sub-groups recorded positive output growth during the month. This breadth indicator is arguably more significant than the headline rate itself.
When more than 60% of manufacturing sub-groups expand simultaneously, the growth is structurally healthier than a single-sector uplift. It suggests demand diversification rather than a concentration risk that could unwind quickly.
Key sub-sectors contributing to the month's performance included:
- Basic metals, benefiting from sustained infrastructure and construction activity pipelines that have been a consistent feature of India's capital expenditure cycle in recent years
- Motor vehicles, reflecting resilience in domestic automotive demand despite broader consumer spending caution in some segments
- Machinery and equipment, an investment-linked category whose growth is particularly telling, since producers only commission and purchase capital equipment when they have reasonable confidence in forward demand
It is worth noting that HSBC's Manufacturing PMI for India fell to approximately 53.9 in the early months of 2026, its weakest reading in nearly four years whilst still remaining above the 50-point expansion threshold. This divergence between a still-growing PMI and a softening pace signals that whilst Indian manufacturing was clearly expanding, rising input costs and uncertain external conditions were beginning to temper the rate of growth. Furthermore, the Indian steel prices environment in this period added additional complexity to basic metals output costs.
Mining: The Standout Performer
Mining recorded the strongest sectoral expansion of the three IIP pillars in March 2026, registering 5.5% growth. To appreciate the significance of this, consider that mining grew just 0.4% in March 2025 and 1.2% in March 2024. The acceleration to 5.5% in March 2026 represents a genuine multi-year step change in sector performance.
Several structural factors likely underpinned this improvement:
- Elevated coal extraction volumes supporting domestic energy security needs, with Indian coal production having been a policy priority given the country's power generation mix
- Iron ore production aligned with the steel sector's demand, itself connected to the ongoing infrastructure build-out, and closely tied to shifts in the broader steel and iron ore market across Asia
- Increased mineral auction activity in preceding years beginning to translate into higher operational capacity at mine sites across the country
The mining sector's outperformance is noteworthy from an analytical standpoint because mining output is less susceptible to the short-term sentiment-driven fluctuations that affect manufacturing order books. Strong mining growth tends to reflect genuine demand from downstream processing industries.
Electricity Generation: The Drag on the Headline
Electricity output growth of just 0.8% in March 2026 stands in sharp contrast to the 6.3% expansion recorded in electricity generation in March 2025. This deceleration is the single most significant softening factor in the March 2026 IIP reading.
Sustained weakness in electricity generation output is a forward-looking risk indicator that analysts should monitor carefully. Industrial production growth that is not supported by commensurate energy availability may encounter capacity ceilings in subsequent months.
Several explanatory factors present themselves. March falls in the transition period between winter and pre-summer months in India, when residential and commercial cooling demand has not yet reached its peak, potentially moderating total power consumption. Additionally, base effects from the strong electricity generation figure in March 2025 mathematically compress the growth rate.
Use-Based Categories: Reading the Demand Architecture Behind the Numbers
The IIP's use-based classification framework offers a different and complementary analytical lens, shifting the focus from what is being produced to why it is being produced. This distinction carries significant implications for interpreting the durability of industrial expansion.
Capital Goods: The Investment Confidence Signal
Capital goods output surging 14.6% in March 2026 is the single most analytically significant data point in the entire release. Capital goods represent machinery, industrial tools, and equipment purchased by businesses and governments to expand productive capacity. When this category accelerates sharply, it communicates confidence in future demand.
This reading aligns with India's multi-year commitment to infrastructure-led growth, with capital expenditure in road construction, railway expansion, port development, and urban infrastructure maintaining elevated levels heading into the fiscal year-end. In addition, the broader critical minerals demand narrative is reinforcing upstream investment decisions across India's industrial base.
Infrastructure and Construction Goods
Infrastructure and construction goods growing 6.7% is consistent with the pattern of government capital expenditure accelerating during the January-to-March quarter, when budget disbursements typically pick up pace. This category tracks closely with central and state government spending patterns, making its sustained expansion a direct reflection of fiscal policy execution.
Consumer Goods: An Uneven Recovery Story
The consumer goods segment reveals the most important internal tension within the March 2026 data.
| Consumer Category | March 2026 Growth | Interpretation |
|---|---|---|
| Consumer Durables | +5.3% | Urban and middle-income household demand holding firm |
| Consumer Non-Durables | +1.1% | FMCG and essential goods demand remains constrained |
The gap between durable goods growth of 5.3% and non-durable growth of just 1.1% reflects a segmented consumption landscape. Consumer durables, which include appliances, electronics, and passenger vehicles, are disproportionately purchased by urban and middle-income households. Their relative strength suggests this demographic remains economically active and confident.
Non-durable goods, spanning fast-moving consumer goods and everyday essentials, cater to a much broader and more economically diverse consumer base. Their near-stagnant growth of 1.1% points to persistent demand weakness among lower-income and rural consumers, potentially reflecting the compressive effects of elevated food inflation on discretionary spending capacity.
Industrial Trajectory: Is FY2026-27 Starting on Stable Ground?
Reading the Fiscal Year Transition
With FY2024-25 having delivered the weakest full-year industrial growth in four years at 4.0%, the March 2026 reading provides the first directional indication of whether FY2025-26 managed to improve on that baseline. A full-year figure marginally above 4.0% would represent genuine, if modest, progress in India's industrial recovery trajectory.
The February-to-March deceleration from 5.2% to 4.1% introduces some caution. Momentum was clearly softening at the fiscal year-end. Whether that reflects temporary headwinds or a more persistent moderation is a key analytical question for the opening months of FY2026-27.
External Risk Factors That Could Constrain Forward Growth
Several external variables present credible downside scenarios for industrial output performance in FY2026-27:
- West Asia geopolitical instability: Rating agency ICRA has flagged that sustained disruption linked to West Asian tensions could push IIP growth toward the 3-4% range, primarily through supply chain disruption and energy cost volatility affecting manufacturing input costs
- Global trade uncertainty: Weakening export demand from key trading partners and elevated input commodity costs could compress manufacturing margins and reduce incentive for capacity expansion, a concern further amplified by ongoing trade wars and supply chains disruptions globally
- PMI momentum softening: The HSBC Manufacturing PMI reading of 53.9, whilst technically expansionary, marked the weakest pace of expansion in nearly four years and may be signalling a period of adjustment ahead
Scenario Analysis: If external headwinds intensify through H1 FY2026-27, IIP growth could moderate toward the 3.5-4.0% range. If domestic capital expenditure remains elevated and consumer demand begins to broaden beyond urban segments, growth could push toward 5.0-5.5%, approaching the FY2023-24 benchmark of 5.8%.
Domestic Policy Levers With Potential to Support Momentum
On the positive side of the ledger, several domestic policy mechanisms could sustain industrial momentum into the new fiscal year:
- Continued disbursements under Production-Linked Incentive schemes across electronics, pharmaceuticals, and specialty chemicals
- Any easing in RBI monetary policy stance that reduces borrowing costs for industrial capital expenditure
- Government infrastructure spending maintaining construction pipeline activity and basic metals demand
- Investment in power generation capacity that could resolve the electricity output lag and remove a potential bottleneck for industrial expansion
How India's 4.1% Compares Against Emerging Market Industrial Peers
Placing India's March 2026 IIP reading within an international context adds a further dimension to the analysis. Emerging market industrial performance varies significantly depending on whether growth is driven by domestic demand, export manufacturing, or commodity extraction.
| Economy | Recent Industrial Growth Rate | Primary Driver |
|---|---|---|
| India | 4.1% (March 2026) | Manufacturing, mining, capital goods investment |
| China | ~5-6% (2025 average) | Export-led manufacturing, state-directed investment |
| Vietnam | ~8-9% (2025 estimate) | Electronics and garment export manufacturing |
| Indonesia | ~4-5% (2025 estimate) | Commodity processing, domestic demand |
| Brazil | ~2-3% (2025 estimate) | Agricultural processing, energy sector |
Note: International comparisons are indicative estimates based on published economic reports. Methodologies vary across national statistics authorities.
India's 4.1% positions it competitively within the emerging market cohort, though below the output growth rates of Southeast Asian manufacturing hubs like Vietnam, which benefit from concentrated export manufacturing investment in electronics supply chains. Critically, India's growth breadth across capital goods, basic metals, and motor vehicles reflects a more domestically anchored expansion than export-dependent peers, a characteristic that provides greater insulation from global trade cycle swings. However, commodity price impacts remain a variable that could influence India's mining and manufacturing cost structures in the months ahead.
The next major ASX story will hit our subscribers first
Frequently Asked Questions: India IIP March 2026
What does India industrial production growth of 4.1% in March actually mean?
A 4.1% expansion in the Index of Industrial Production means that the combined output of India's factories, mines, and power plants was 4.1% higher in March 2026 compared to the same month in 2025. It signals continued industrial momentum at the fiscal year-end, though the pace of expansion remains moderate rather than exceptional.
Which sector grew fastest within the March 2026 IIP?
Mining recorded the strongest sectoral performance at 5.5%, outpacing manufacturing at 4.3% and electricity generation at 0.8%. Mining's outperformance represents a significant multi-year acceleration from the sector's near-stagnant readings in 2024 and 2025.
Why is the capital goods surge of 14.6% considered the most significant data point?
Capital goods production is a leading indicator of investment confidence. When businesses and governments are purchasing more machinery and industrial equipment, it reflects an expectation that productive capacity will be needed to meet future demand. A 14.6% surge in this category signals that investment-driven growth dynamics remain firmly intact.
Why did electricity generation only grow 0.8%?
The electricity generation underperformance likely reflects a combination of seasonal demand moderation in March, strong base effects from the prior year's 6.3% electricity growth, and potential supply-side constraints at thermal power stations. Analysts will watch whether this weakness persists into Q1 FY2026-27 as a potential industrial capacity constraint.
What does the consumer non-durables growth of 1.1% indicate?
Near-stagnant growth in consumer non-durables suggests that mass-market consumption, particularly among rural and lower-income segments, remains constrained. This may reflect persistent food inflation compressing household purchasing power or manufacturer inventory management responses to cautious demand signals.
Key Takeaways: March 2026 IIP and India's Near-Term Industrial Outlook
- India industrial production growth of 4.1% in March 2026 marks a year-on-year improvement of 110 basis points over March 2025's 3.0% reading
- Manufacturing (4.3%) and mining (5.5%) drove the expansion; electricity generation (0.8%) was the primary drag
- Growth was broad-based, with 14 of 23 manufacturing sub-groups recording positive output, a structurally healthier signal than concentrated sector gains
- Capital goods output surging 14.6% is the standout use-based signal, indicating strong investment demand and forward capacity confidence
- The consumer durables vs non-durables divergence (5.3% vs 1.1%) exposes an uneven consumption recovery skewed toward urban middle-income segments
- External risks including West Asian instability and global trade uncertainty present credible downside scenarios, with ICRA forecasting potential growth moderation toward 3-4% under adverse conditions
- The IIP trajectory entering FY2026-27 is cautiously optimistic, with sustainability contingent on capital expenditure continuity, electricity capacity resolution, and broader consumer demand recovery. Analysts tracking India's factory output trends will find the coming quarters particularly instructive for assessing the durability of this recovery
Disclaimer: This article contains forward-looking analysis and scenario projections that involve assumptions and uncertainties. Economic forecasts referenced, including ICRA's IIP growth projections, represent published estimates subject to revision. Historical IIP data referenced is sourced from official National Statistics Office publications. Readers should not interpret any content herein as financial or investment advice.
Want To Capitalise On The Mining Sector's Surging Industrial Momentum?
India's mining sector recorded its strongest growth in years, and opportunities like this reward investors who act on real-time intelligence — Discovery Alert's proprietary Discovery IQ model instantly identifies significant ASX mineral discoveries, turning complex data into actionable insights the moment they're announced. Explore historic mineral discoveries and their extraordinary returns, then start your 14-day free trial to ensure you're positioned ahead of the market.