
July 23, 2026
Investment portfolios worldwide face turbulent conditions when global energy supply chains encounter disruption. Historical analysis reveals that geopolitical tensions in oil-producing regions create cascading effects across multiple asset classes, with energy sector equities demonstrating distinct performance patterns based on their position within the value chain. Understanding these dynamics becomes crucial for investors seeking to navigate periods of heightened uncertainty, particularly when examining India oil stocks and Gulf conflict scenarios that create both opportunities and risks across the energy sector.
What Makes India's Oil Market Vulnerable to Middle East Disruptions?
India's Critical Energy Import Dependencies
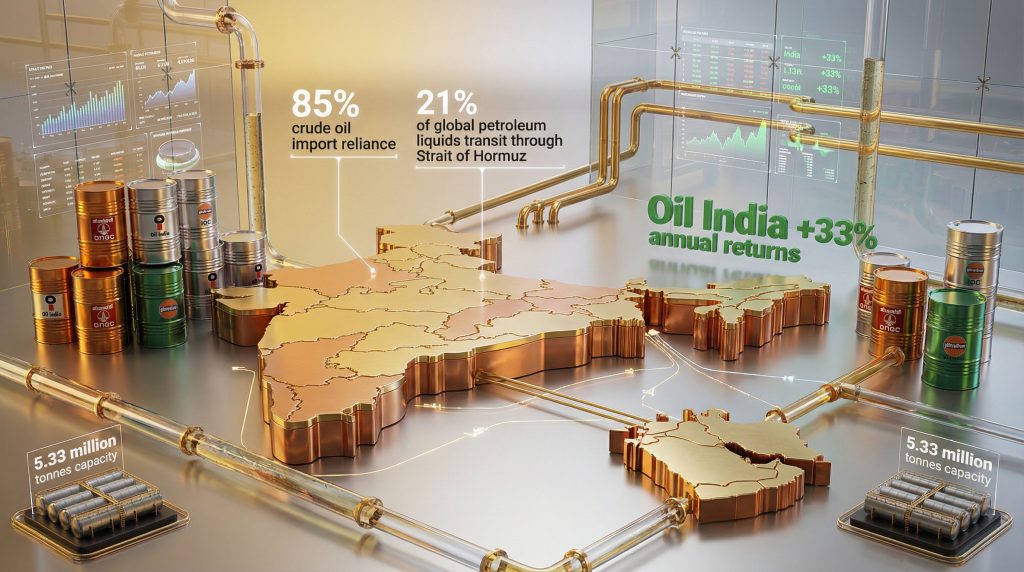
India's energy security architecture demonstrates profound structural vulnerabilities that amplify the impact of any Middle East supply disruptions. The nation's dependence on imported crude oil reaches approximately 85% of total consumption, with domestic production from ONGC and Oil India Limited contributing merely 15-18% of requirements. This stark imbalance creates immediate transmission risk when global supply chains face interference.
The liquefied natural gas sector presents equally concerning dependencies. Qatar accounts for approximately 48% of India's LNG import portfolio, making any disruption to Qatari facilities an immediate constraint on industrial and power generation operations. Furthermore, the Strait of Hormuz serves as a critical chokepoint, with roughly 21% of global petroleum liquids transiting through this narrow waterway daily, highlighting the connection between oil price movements and regional stability.
Key vulnerability metrics include:
- Annual crude oil imports: 215-220 million tonnes representing 82-85% of consumption
- Domestic production capacity: 41-44 million tonnes annually from major fields
- Qatar LNG dependency: 45-50% of total natural gas import requirements
- Strait of Hormuz transit: One-fifth of world petroleum liquids flow
The concentration of supply routes amplifies risk transmission mechanisms. LNG carriers from Qatar to Indian terminals at Dahej, Hazira, Kochi, and Mundra must traverse the Strait of Hormuz, with alternative routing adding 2-3 weeks transit time and prohibitive cost increases. This just-in-time supply model leaves minimal buffer for disruption absorption.
Supply chain mechanics reveal additional complexity layers. India receives LNG through long-term contracts with entities like RasGas and QatarEnergy, creating contractual obligations that cannot be easily substituted during shortages. Physical congestion scenarios can strand tankers on either side of chokepoints, as recent experiences have demonstrated with vessels unable to complete scheduled deliveries.
Strategic Reserve Infrastructure Assessment
India's Strategic Petroleum Reserves maintain 5.33 million tonnes capacity across four underground facilities at Visakhapatnam, Mangaluru, Padur, and Udupi. These salt rock caverns provide cost-efficient storage but limited rapid expansion capability without substantial capital investment estimated at $2-3 billion for additional 50 million tonnes capacity.
Current reserve calculations:
- SPR capacity provides 8.4 days of import cover at full utilisation
- Commercial inventory adds 8-12 days of consumption buffer
- Combined strategic and working stock extends resilience to 16-20 days
- Target expansion aims for 87 days of import cover over coming years
Emergency withdrawal mechanics face infrastructure constraints. Strategic reserves can be released through existing pipeline systems, but drawdown rates remain limited by current pipeline infrastructure capacity. Rapid depletion impacts refinery feedstock optimisation and may require temporary operational inefficiencies across the distribution network.
The government maintains phased response protocols including SPR release authorisation, demand reduction mandates, accelerated import tenders, and domestic production enhancement measures. However, no major SPR deployment has occurred since programme inception in 2004, leaving actual response effectiveness largely theoretical rather than operationally proven.
When big ASX news breaks, our subscribers know first
Which Indian Oil Stocks Benefit Most from Geopolitical Price Volatility?
Upstream Exploration Companies: The Clear Winners
Upstream exploration companies demonstrate positive correlation with crude price movements due to their revenue structure being directly denominated in barrel production at global prices whilst primary cost structures remain largely fixed in rupees. This creates immediate operating leverage when commodity prices appreciate during supply disruption scenarios.
Performance dynamics by company:
| Company | Production Volume | Cost Structure | Price Sensitivity | Key Risk Factors |
|---|---|---|---|---|
| ONGC | 27.6 million tonnes annually | $5-7 per barrel | High positive correlation | Reserve replacement challenges |
| Oil India | 3.8 million tonnes annually | $6-8 per barrel | Maximum volatility exposure | Brahmaputra field decline rates |
| Vedanta Oil | 0.9 million tonnes annually | Variable by field | Moderate correlation | Rajasthan field maturity |
ONGC's margin mechanics illustrate upstream leverage principles. With average production costs of $5-7 per barrel, crude trading at $84 generates gross margins of $77-79 per barrel. Doubling crude prices from $42 to $84 doesn't proportionally double production costs, which typically inflate 30-40%, whilst revenue doubles, creating substantial operating leverage for earnings per share expansion.
Oil India Limited operates primarily in Assam's Brahmaputra basin with production costs ranging $6-8 per barrel. The company faces natural production decline curves requiring continuous exploration success and reserve additions for long-term sustainability. Price spikes create immediate EPS accretion but cannot resolve fundamental reserve replacement challenges affecting future production capacity.
Vedanta's oil division operates mature Rajasthan fields including Mangala, Aishwariya, and Saraswati blocks. These assets face natural decline rates of 10-15% annually, meaning price appreciation helps current profitability but structural reserve depletion remains a headwind for sustained value creation.
Reserve replacement ratios reveal long-term sustainability challenges. ONGC's FY 2023 reserve replacement ratio reached approximately 45%, indicating production reserves decline faster than new discoveries offset depletion. This structural challenge limits long-term price upside leverage despite immediate profit benefits from commodity appreciation.
Downstream Refiners: The Margin Squeeze Reality
Indian refineries experience margin compression during crude price spikes due to regulatory price controls preventing immediate pass-through of input cost increases to consumers. Gross Refining Margins typically compress 30-50% as refined product pricing fails to track crude proportionally, creating working capital pressure and inventory write-down risks.
GRM compression mechanics:
- Average Indian refinery GRM: $4.50-5.50 per barrel under normal conditions
- Volatility range during disruptions: $2-8 per barrel depending on crude basket composition
- Product yield constraints: Diesel 45%, petrol 25%, fuel oil 15%, limiting optimisation flexibility
- Working capital cycle stress: 20-30% increase in required capital during price spikes
Regulatory price review mechanisms prevent refiners from immediately passing crude cost increases to domestic consumers. Petroleum product prices remain subject to government oversight despite partial deregulation, creating lag effects between input cost inflation and revenue recognition. This timing mismatch strains cash flow during volatile periods.
Secondary margin pressure emerges from natural gas supply constraints affecting refining operations. Recent supply cuts reaching 60% force refineries to switch from natural gas to costlier alternatives like fuel oil or LPG for hydrocracking and reforming units. This compounds the primary crude cost inflation with additional operational cost increases.
Inventory management becomes critical during price volatility. Refiners holding finished goods inventory face potential losses if product prices lag input cost increases. The working capital cycle intensifies as crude purchases occur on 30-day payment terms, refining requires 5-7 days, and product sales involve 15-30 day collection periods.
Refinery-specific impact factors:
- IOC: Largest domestic market share but highest regulatory pricing exposure
- BPCL: Privatisation potential offset by operational disruption risks
- HPCL: Marketing network expansion provides some pricing power
- Reliance: Integrated model and export orientation reduce domestic regulatory impact
How Do Energy Supply Disruptions Cascade Through India's Industrial Economy?
Priority Allocation Framework During Shortages
India implements a structured priority allocation system when natural gas supplies face constraints. Domestic gas allocation follows a clear hierarchy: fertiliser production receives highest priority, followed by power generation, industrial applications, and finally transport sector consumption. This framework determines which sectors face curtailment first during supply shortages, directly affecting India oil stocks and Gulf conflict scenarios.
Recent operational examples demonstrate this prioritisation in action. Gas marketing companies have implemented supply cuts reaching 60% for industrial customers whilst maintaining allocations for fertiliser plants and small-scale consumers. This selective curtailment approach protects essential economic functions but forces industrial adaptation through fuel switching or production reduction.
Force majeure protocols include:
- Immediate notification to affected industrial consumers
- Graduated reduction schedules based on contractual terms
- Alternative fuel sourcing assistance for critical operations
- Production scheduling adjustments to optimise available supply
Industrial customers maintain varying degrees of fuel switching capability. Steel and cement plants can often transition to coal or fuel oil alternatives, though at higher operational costs. Ceramic and glass manufacturers face more limited options due to specific temperature and combustion requirements for their production processes.
Sectoral Impact Analysis
Supply disruption effects follow predictable cascading patterns across India's industrial landscape. Initial impacts appear within days through direct gas supply curtailment, expanding to broader economic effects over weeks as secondary shortages and cost inflation propagate through supply chains.
Disruption timeline progression:
Days 1-3: Immediate Industrial Curtailment
- Ceramic and glass manufacturing face first production cuts
- Steel and cement plants begin fuel switching to alternatives
- Petrochemical facilities reduce throughput on gas-dependent units
- City gas distributors prioritise residential over commercial supply
Week 1: Power Sector Adjustments
- Coal-fired power plants increase utilisation to offset gas generation
- Industrial power costs rise as utilities switch to expensive alternatives
- Grid stability measures implemented to manage fuel supply changes
- Renewable energy dispatch prioritisation increases
Week 2-4: Fertiliser Production Constraints
- Urea manufacturing faces potential output reductions despite priority status
- Agricultural input costs begin reflecting supply chain pressures
- Import substitution efforts accelerate for critical industrial inputs
- Export-oriented industries evaluate production allocation strategies
Chemical and petrochemical sectors demonstrate particular vulnerability due to natural gas serving as both fuel and feedstock. Production curtailment cannot be easily offset through alternative inputs, creating potential shortages in downstream industries relying on these chemical intermediates for manufacturing processes.
The automotive sector faces dual exposure through both direct industrial gas consumption and indirect effects via steel and component supplier disruptions. Original equipment manufacturers may need to adjust production schedules based on supplier capability during extended disruption periods.
What Economic Scenarios Could Unfold from Prolonged Gulf Conflicts?
Inflation Transmission Mechanisms
Energy price shocks transmit through India's economy via multiple channels, with historical analysis indicating every $10 per barrel crude oil increase correlates with 0.3-0.4% Consumer Price Index inflation over 6-12 month periods. This relationship reflects both direct energy cost impacts and indirect effects through transportation and manufacturing input cost increases.
Primary transmission channels include transport fuel pricing affecting goods movement costs across the economy. Diesel price increases directly impact logistics and freight costs, which eventually appear in retail prices for consumer goods. Secondary effects emerge through petrochemical input price increases affecting packaging, synthetic materials, and chemical intermediates used across manufacturing sectors.
Inflation propagation pathways:
- Direct energy costs: Household fuel, electricity, and cooking gas expenses
- Transportation impact: Freight costs increasing retail goods pricing
- Industrial inputs: Petrochemical and chemical intermediate cost inflation
- Wage pressure effects: Workers demanding compensation for higher living costs
The Reserve Bank of India maintains inflation targeting frameworks that may trigger monetary policy responses if energy-driven price increases threaten broader economic stability. Interest rate adjustments could amplify economic impacts beyond direct energy cost effects, affecting investment and consumption patterns across sectors.
Food price inflation represents a secondary channel as agricultural input costs rise through fertiliser and diesel price increases. Rural economies face particular pressure from higher farming costs, potentially affecting agricultural production and rural consumption patterns over medium-term horizons.
Currency and Trade Balance Implications
Sustained crude oil price increases create immediate pressure on India's current account deficit through higher import costs. Analysis indicates every $1 per barrel sustained price increase widens the current account deficit by approximately $1 billion annually, assuming constant consumption levels and no demand destruction effects.
Trade balance mechanics:
- Current annual crude imports: 215-220 million tonnes valued at $150-180 billion
- Price elasticity effects: Limited short-term demand response to cost increases
- Export competitiveness: Energy-intensive manufacturing faces margin pressure
- Services sector impact: IT and business services maintain competitive positioning
Rupee depreciation feedback loops can amplify import cost inflation. As crude oil prices rise, increased dollar demand for energy imports pressures the rupee, making all imports costlier in domestic currency terms. This secondary effect compounds the original commodity price increase impact on domestic inflation and economic competitiveness.
Export-oriented industries face mixed effects depending on their energy intensity and competitive positioning. Information technology services maintain advantages due to minimal direct energy input requirements, whilst manufacturing sectors face margin compression that may affect export pricing competitiveness in global markets.
Foreign exchange reserve utilisation may accelerate during sustained high energy import costs. India's foreign exchange reserves provide buffer capacity, but prolonged periods of elevated energy import bills could affect the central bank's ability to manage currency stability without intervention in domestic monetary conditions.
How Should Investors Position for Different Conflict Scenarios?
Bullish Oil Price Scenario (Sustained $80-90/barrel)
Investment positioning for sustained higher oil prices requires differentiated sector allocation based on direct versus indirect exposure to energy cost inflation. Upstream oil exploration companies demonstrate immediate positive correlation, whilst downstream refiners and energy-intensive industries face margin compression pressures requiring careful selection criteria. Understanding tariffs global impact becomes essential when evaluating these scenarios.
Strategic positioning framework:
| Scenario Duration | Winning Sectors | Risk Factors | Portfolio Weight |
|---|---|---|---|
| 3-6 months | Upstream oil, coal mining, logistics | Inventory holding costs | 40% energy plays |
| 6-12 months | Alternative energy, defence, IT services | Policy intervention risks | 30% defensive sectors |
| 12+ months | Renewable acceleration, efficiency tech | Economic slowdown effects | 30% structural themes |
Defence and IT services sectors offer indirect benefits during prolonged energy crises. Defence companies benefit from increased government spending on energy security infrastructure, whilst IT services maintain export competitiveness due to minimal direct energy input costs and foreign currency revenue streams providing natural hedging against rupee depreciation.
Coal mining companies present attractive positioning during natural gas supply constraints as industrial users switch to alternative fuels. Companies with domestic coal reserves benefit from both increased demand and potential pricing power as gas becomes unavailable or prohibitively expensive for industrial applications.
Alternative energy sectors, including solar and wind power equipment manufacturers, may experience accelerated adoption as energy security concerns drive policy support for domestic renewable capacity additions. However, near-term impacts may be limited by project development timelines and financing availability during economic uncertainty periods.
Mean Reversion Scenario (Return to $60-70/barrel)
Portfolio repositioning for energy price normalisation requires anticipating margin recovery timing in downstream sectors whilst managing potential correction risks in upstream companies that benefited from temporary price spikes. Refinery margin expansion typically occurs 3-6 months after crude price stabilisation as inventory effects normalise.
Normalisation phase opportunities:
- Refiner margin recovery: IOC, BPCL, HPCL rerating potential following GRM expansion
- Transportation sector revival: Airlines and logistics companies benefiting from fuel cost reduction
- Consumer discretionary rebound: FMCG and automotive sectors recovering from input cost pressures
- Industrial demand normalisation: Chemicals and metals sectors resuming normal operations
Timing considerations become critical for sector rotation strategies. Early positioning in refiners may capture margin recovery before broader market recognition, whilst extended upstream positions face potential correction risks as commodity prices normalise and operational leverage reverses.
Government policy responses may affect normalisation patterns. Fuel tax adjustments, strategic reserve refilling programmes, or subsidy modifications could alter the pace and extent of economic adjustment to lower energy prices, requiring ongoing monitoring of policy announcements and implementation timelines.
Which Specific Stocks Offer the Best Risk-Adjusted Returns?
Top Tier Opportunities
Oil India Limited presents compelling upstream exposure with production growth trajectory potential and dividend yield sustainability during elevated price environments. The company's Assam operations provide stable production base whilst exploration activities in the KG basin offer upside potential for reserve additions and future production capacity expansion.
Oil India investment merits:
- Production costs: $6-8 per barrel providing substantial margin expansion
- Dividend policy: Historically consistent payouts with special dividends during price spikes
- Exploration upside: KG basin and Northeast frontier opportunities for reserve growth
- Government ownership: Strategic asset designation providing operational stability
ONGC represents the largest domestic upstream opportunity with comprehensive asset portfolio and asset monetisation potential. The company's integrated operations across exploration, production, and downstream activities provide some natural hedging whilst maintaining maximum exposure to crude price appreciation benefits.
Recent ONGC developments include plans for asset monetisation through stake sales in subsidiary companies and exploration licensing expansion in frontier basins. These corporate actions could unlock additional value beyond commodity price appreciation, though execution risk remains a consideration for investment timing decisions.
Indian Oil Corporation offers refining capacity expansion benefits during post-normalisation recovery periods. The company's dominant domestic marketing position provides some pricing power whilst planned capacity additions position for future demand growth and margin capture opportunities.
Contrarian Value Plays
Bharat Petroleum presents interesting contrarian positioning due to privatisation overhang effects creating valuation discounts despite operational efficiency potential. The company's refining and marketing assets demonstrate competitive operational metrics whilst privatisation uncertainty has depressed market valuations below fundamental value estimates.
BPCL investment considerations:
- Privatisation timeline: Uncertainty creates opportunity for patient capital
- Operational efficiency: Strong refining margins and marketing network positioning
- Asset quality: Modern refineries and strategic location advantages
- Valuation discount: Market price reflects policy uncertainty rather than operational performance
Hindustan Petroleum offers marketing network expansion opportunities in tier-2 and tier-3 cities where urbanisation drives increasing energy demand. The company's retail expansion strategy could capture market share growth during economic development whilst providing some pricing power in less competitive regional markets.
Reliance Industries demonstrates integrated model resilience through petrochemicals, refining, and telecommunications diversification. The company's export-oriented refining operations reduce exposure to domestic regulatory pricing whilst petrochemical integration provides downstream value capture opportunities during various market conditions.
Risk management considerations for these contrarian plays include position sizing based on specific company risk factors, diversification across the energy value chain, and monitoring of regulatory developments that could affect privatisation timelines or operational flexibility for state-owned enterprises.
The next major ASX story will hit our subscribers first
What Are the Long-term Strategic Implications for India's Energy Security?
Accelerated Diversification Initiatives
Energy security concerns drive accelerated supplier diversification efforts beyond traditional Middle Eastern partnerships. Russia, UAE, and US shale producers represent alternative sourcing opportunities, though each carries distinct geopolitical and logistical considerations requiring careful evaluation of long-term supply security versus pricing competitiveness. This strategy becomes increasingly important given Saudi exploration licenses and their potential impact on regional supply dynamics.
Diversification strategy components:
- Geographic supplier spread: Reducing concentration risk through multiple source countries
- Contract term optimisation: Balancing long-term security with pricing flexibility
- Infrastructure development: LNG terminals and pipeline capacity for alternative suppliers
- Strategic partnership formation: Government-to-government agreements securing supply commitments
Renewable energy capacity expansion targets include 500 GW installations by 2030, representing massive infrastructure investment requirements and industrial transformation opportunities. Solar and wind power development could reduce fossil fuel import dependencies whilst creating domestic manufacturing and employment opportunities in emerging technology sectors.
Green hydrogen ecosystem development focuses on industrial applications where hydrogen can substitute for imported natural gas in steel, cement, and chemical manufacturing processes. Technology development and scaling require substantial capital investment but offer potential for reduced import dependence and industrial competitiveness improvements.
Domestic exploration licensing reforms aim to increase indigenous production through private sector participation and advanced extraction technologies. Success in these initiatives could gradually reduce import dependence ratios, though geological constraints and investment requirements limit near-term impact potential.
Infrastructure Resilience Building
Strategic reserve expansion plans target 87 days of import cover through additional underground storage facility construction and commercial inventory requirements for oil marketing companies. This infrastructure development requires estimated investment of $15-20 billion but would substantially improve India's ability to manage supply disruptions.
Resilience infrastructure priorities:
- Underground storage capacity: Salt cavern development for cost-effective long-term storage
- Pipeline connectivity: Linking reserves with refining and distribution networks
- Port infrastructure: Expanded crude oil and LNG receiving capacity
- Emergency response systems: Rapid deployment capabilities for supply crisis management
LNG terminal capacity additions focus on supplier diversification and increased import flexibility. New terminals designed for multiple supplier capability reduce dependence on single-source contracts whilst providing operational flexibility for spot market purchases during supply or pricing advantages.
Distribution network hardening includes pipeline security measures, redundant routing options, and emergency response capabilities. Physical infrastructure protection becomes increasingly important as energy security gains strategic priority in national security planning frameworks.
Technology integration opportunities include smart grid development, demand response capabilities, and efficiency improvements across the energy system. These investments provide multiple benefits including reduced import requirements, improved system reliability, and enhanced ability to manage supply disruptions through demand-side interventions.
How Can Retail Investors Navigate This Volatility?
Risk Management Framework
Position sizing during geopolitical uncertainty periods requires careful consideration of volatility levels and correlation effects across energy sector holdings. Concentration risk becomes particularly important when multiple positions benefit from similar underlying drivers, creating potential for synchronised drawdowns during price normalisation periods.
Risk management principles:
- Maximum sector allocation: 15-20% of portfolio in direct energy plays
- Diversification within sector: Mix of upstream, downstream, and alternative energy exposure
- Volatility adjustment: Smaller positions in higher beta names during uncertain periods
- Liquidity maintenance: Adequate cash reserves for opportunistic positioning during dislocations
Sector rotation timing requires monitoring geopolitical risk indicators including shipping data through critical chokepoints, inventory levels at strategic facilities, and policy announcements from major producing countries. Early warning systems help identify inflection points for tactical allocation adjustments.
Hedging strategies using energy ETFs and commodity futures can provide portfolio protection during extreme volatility periods. These instruments offer pure-play commodity exposure without individual company risk whilst providing liquidity for tactical adjustments based on evolving market conditions.
Stop-loss disciplines become essential during volatile periods when individual stock movements can be extreme. However, energy sector volatility may require wider stop levels to avoid premature exits during temporary price fluctuations that reverse quickly based on changing geopolitical developments.
Fundamental Analysis Checklist
Debt-to-equity ratios gain critical importance during working capital stress periods when energy companies face increased financing needs for inventory and operational requirements. Companies with strong balance sheets demonstrate better ability to navigate volatile periods without compromising growth investments or dividend policies, especially during scenarios that could lead to an oil price crash analysis.
Financial health indicators:
- Balance sheet strength: Low debt levels and available credit facilities
- Cash flow generation: Consistent operating cash flows across commodity price cycles
- Working capital management: Efficient inventory turnover and receivables collection
- Capital allocation discipline: Dividend sustainability and selective growth investment
Cash flow generation sustainability analysis requires evaluation at different oil price levels to understand company resilience during various scenarios. Companies demonstrating positive free cash flow generation even at $50-60 per barrel crude prices offer better downside protection during price normalisation periods.
Management guidance reliability becomes crucial during crisis periods when communication quality affects investor confidence. Companies with transparent communication policies and consistent guidance achievement records provide better foundation for investment decision-making during uncertain periods.
Operational flexibility assessment includes fuel switching capabilities, production curtailment options, and geographic diversification benefits. Companies with multiple operational levers demonstrate better ability to adapt to changing conditions whilst maintaining profitability across various scenarios.
Building a Resilient Energy Portfolio Strategy
Key Investment Principles
Diversification across the energy value chain captures different volatility benefits whilst reducing concentration risk in any single business model or commodity exposure. Upstream companies provide direct commodity price leverage, downstream players offer margin recovery opportunities, and alternative energy positions participate in long-term structural transformation themes.
Portfolio construction guidelines:
- Upstream allocation: 40-50% for direct commodity exposure and dividend yields
- Downstream positioning: 30-40% for margin recovery and operational leverage opportunities
- Alternative energy: 10-20% for long-term transformation and growth potential
- Support services: 5-10% for specialised equipment and technology providers
Balance sheet strength prioritisation ensures portfolio companies can navigate volatile periods without financial distress that could compromise operational performance or shareholder returns. Companies with strong credit profiles demonstrate better ability to invest counter-cyclically during downturns whilst maintaining dividend payments.
Regular rebalancing based on geopolitical risk assessment updates helps maintain appropriate sector weightings as conditions evolve. Monthly portfolio reviews during high-volatility periods enable tactical adjustments whilst maintaining strategic allocation discipline over longer time horizons.
Monitoring Framework
Early warning indicators include Strait of Hormuz shipping traffic data, crude oil and petroleum product inventory levels at major storage facilities, and forward curve positioning in commodity futures markets. These metrics provide advance indication of developing supply constraints before they appear in spot market pricing. According to Reuters analysis, "Indian shares are set to open lower as Middle East conflict drives oil surge," highlighting how geopolitical tensions immediately impact market sentiment.
Monitoring checklist:
- Geopolitical developments: Conflict escalation or resolution indicators
- Supply chain metrics: Shipping delays, port congestion, pipeline utilisation rates
- Policy responses: Government intervention announcements and implementation timelines
- Market technical indicators: Volatility levels, correlation patterns, and sentiment measures
Government intervention threshold tracking helps anticipate policy responses that could affect energy market dynamics and individual company performance. Strategic petroleum reserve release criteria, fuel tax adjustment mechanisms, and regulatory pricing oversight represent key policy tools requiring ongoing monitoring. Furthermore, Bloomberg's reporting notes that "oil shock from Iran war raises risks for India's stock market," demonstrating the interconnected nature of geopolitical events and financial markets.
Global supply-demand balance evolution extends beyond Middle East dependencies to include North American shale production, renewable energy adoption rates, and demand destruction effects from high prices. These broader trends affect long-term energy investment attractiveness and individual company growth prospects. The evolution of US-China trade strategy continues to influence global energy markets and investment flows.
Investment success during volatile energy markets requires combining fundamental company analysis with macro-economic scenario planning and risk management discipline. Companies with strong operational performance, financial flexibility, and strategic positioning demonstrate better ability to navigate uncertainty whilst delivering attractive risk-adjusted returns for patient investors willing to accept short-term volatility in exchange for long-term value creation potential. The complex interplay between India oil stocks and Gulf conflict scenarios demands sophisticated analysis and careful portfolio construction to capture opportunities whilst managing downside risks effectively.
Disclaimer: This analysis is for educational purposes only and does not constitute investment advice. Energy sector investments carry significant volatility and commodity price risks. Historical performance does not guarantee future results. Investors should conduct thorough due diligence and consider their risk tolerance before making investment decisions in volatile sectors such as oil and gas.
Ready to Capitalise on the Next Energy Market Opportunity?
Discovery Alert's proprietary Discovery IQ model delivers instant notifications on significant ASX mineral and energy discoveries, including those in commodities directly affected by geopolitical tensions. Don't let market-moving announcements pass you by – our AI-powered system ensures you're positioned ahead of major opportunities in the energy and resources sector. Begin your 14-day free trial today and transform complex market dynamics into actionable investment insights.