
July 23, 2026
Understanding India's Strategic Position in Global Solar Manufacturing
The transformation of global energy supply chains reflects deeper shifts in international trade patterns and manufacturing strategies. Traditional dependencies on single-source suppliers have given way to diversified procurement approaches, fundamentally altering how nations approach renewable energy infrastructure development. This evolution creates unprecedented opportunities for emerging manufacturing hubs to establish themselves as credible alternatives in the Indian solar exports market.
Manufacturing cost structures across different regions have reached inflection points where economic incentives align with geopolitical preferences. The convergence of technological advancement, policy support, and market demand creates conditions where export-oriented production becomes not just viable, but strategically essential for sustained growth in the renewable energy sector.
When big ASX news breaks, our subscribers know first
Geopolitical Forces Reshaping Solar Supply Chain Architecture
Western procurement policies have undergone systematic restructuring to reduce single-source dependencies in critical infrastructure sectors. European procurement frameworks increasingly incorporate provisions that explicitly exclude Chinese products from tender processes, creating market access opportunities for alternative suppliers. This policy evolution reflects broader security considerations regarding supply chain resilience in strategic industries, particularly as trade war impacts continue to influence global manufacturing decisions.
The implementation of these procurement changes varies significantly across jurisdictions. European Union member states have adopted different approaches to supplier diversification, with some implementing hard exclusions while others create scoring advantages for non-Chinese suppliers. These regulatory frameworks directly influence bidding processes and contract awards, fundamentally altering competitive dynamics in solar equipment procurement.
Trade agreement structures between India and major consuming markets have created favourable conditions for export expansion. Furthermore, tariff impact analysis reveals that tariff reduction mechanisms scheduled for implementation provide significant cost advantages compared to Chinese suppliers facing higher import duties. The reduction of tariffs from 50% to 18% on Indian solar products entering the US market represents a substantial competitive shift that enhances price competitiveness.
Investment flows into export-oriented manufacturing capacity reflect confidence in sustained demand from diversified supply chain strategies. Capital allocation patterns demonstrate that manufacturers are making long-term commitments to serve international markets rather than purely domestic demand, indicating structural shifts in business strategy across the Indian solar exports sector.
Market Absorption Patterns and Regional Demand Dynamics
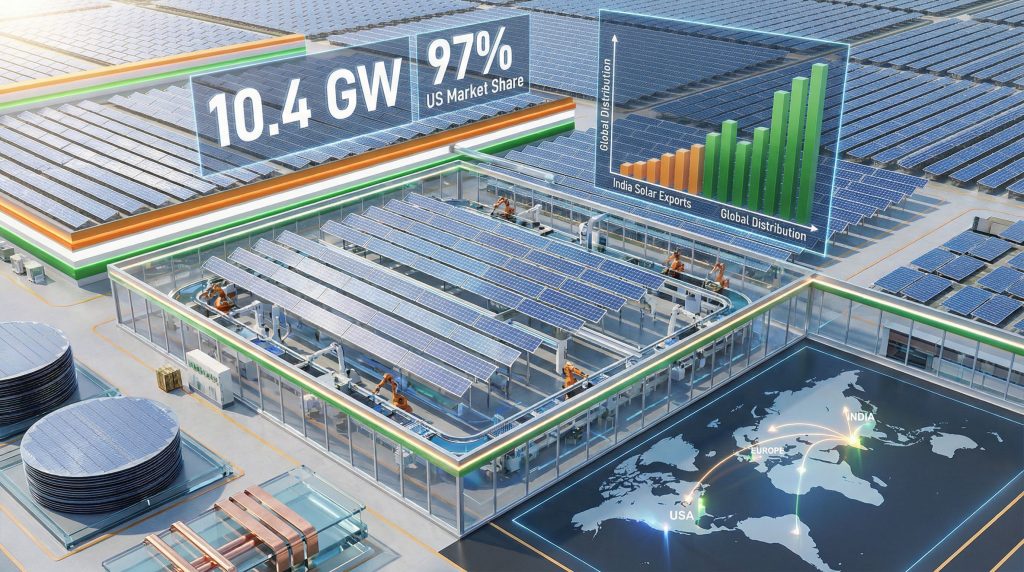
United States market dominance in absorbing Indian solar exports reflects both scale and policy preferences. The concentration of 97-99.5% of Indian exports flowing to the US market demonstrates the effectiveness of trade agreements and procurement policies in channelling supply toward preferred suppliers. However, this market concentration, while beneficial for revenue generation, also creates dependency risks that manufacturers must carefully manage.
Key Export Markets for Indian Solar Products:
• United States: Primary destination with 10.4 GW shipped in first nine months of 2025
• Europe: Growing market with 1.6 GW absorption as procurement rules evolve
• Africa: Emerging opportunity with 0.3 GW in secondary markets
• Asia-Pacific: Regional partnerships driving demand in neighbouring countries
European market penetration strategies must account for complex regulatory environments across multiple jurisdictions. Each European Union member state maintains distinct procurement processes, technical standards, and market entry requirements. Success in European markets requires understanding local certification processes, building relationships with regional distributors, and adapting products to specific technical specifications.
What Are the Key European Market Requirements?
Tender specification evolution in European markets increasingly favours non-Chinese suppliers through explicit exclusion criteria or scoring mechanisms that advantage alternative suppliers. These specifications often include requirements for manufacturing location disclosure, supply chain transparency, and sometimes direct exclusions based on country of origin. Understanding and navigating these requirements becomes critical for market access.
Secondary market development in African countries represents longer-term growth opportunities with different competitive dynamics. Markets such as South Africa, Somalia, and Kenya present distinct challenges including currency stability, financing availability, and infrastructure development requirements. These markets often prioritise price competitiveness over advanced technology features, requiring different product positioning strategies.
Regional partnerships with neighbouring countries like Nepal, Bangladesh, and Afghanistan leverage geographic proximity and existing trade relationships. These markets provide opportunities for building export experience, establishing supply chain logistics, and developing market understanding before expanding to more demanding developed markets.
Manufacturing Capacity Scaling and Production Allocation Strategies
Current manufacturing capacity across India's solar sector has reached substantial scale with 52 GW of cell production capacity and 55 GW of module assembly capacity as of Q3 2025. This capacity expansion represents significant capital investment and demonstrates the industry's commitment to serving both domestic and international demand. The slight advantage of module capacity over cell capacity indicates continued reliance on imported cells for some production.
Cumulative capacity projections exceeding 200 GW by December 2025 reflect aggressive expansion plans across multiple manufacturers. This capacity scale positions India as a major global production centre capable of serving significant portions of international demand. The speed of capacity addition indicates both strong capital availability and confidence in sustained market demand.
Manufacturing Capacity Distribution Analysis:
| Capacity Type | Current (Q3 2025) | Projected (Dec 2025) | Export Allocation |
|---|---|---|---|
| Solar Cells | 52 GW | >80 GW | 45-60% |
| Solar Modules | 55 GW | >85 GW | 50-65% |
| Total Capacity | 107 GW | >165 GW | 47-62% |
Market concentration among leading manufacturers shows that six major players control 58-71% of total production capacity. This concentration enables coordinated export strategies and provides sufficient scale for meaningful international market penetration. Large manufacturers can offer volume commitments and quality consistency that international buyers require for major procurement programmes.
Production allocation between domestic and export markets has become a strategic decision point for manufacturers. Companies must balance fulfilling domestic market commitments against higher-margin export opportunities. The typical premium of 40-60% higher returns on international sales creates strong economic incentives to prioritise export production, but manufacturers must maintain domestic market relationships for long-term stability.
Technological Innovation Driving Cost Competitiveness
Silver consumption reduction has achieved remarkable progress with usage declining 68% over the past five years through technological innovation in cell architecture. This reduction directly addresses one of the most significant cost components in solar cell manufacturing, as silver represents both a substantial material cost and supply chain risk due to price volatility.
The technological mechanism behind silver reduction involves redesigns in cell technology that maintain electrical performance while using less conductive material. Advanced cell architectures such as PERC (Passivated Emitter Rear Cell) and TOPCon (Tunnel Oxide Passivated Contact) technologies enable thinner silver applications without compromising electrical efficiency.
Material Cost Reduction Trajectory:
• Historical silver reduction: 68% decrease over five years (2019-2024)
• Projected additional reduction: 30% decrease over next five years (2025-2030)
• Complete copper substitution timeline: 12-18 months for initial results
• Equipment modification requirements: Minor changes needed for copper implementation
How Does Copper Replacement Technology Impact Manufacturing?
Copper replacement technology development represents the next phase of cost reduction innovation. Complete replacement of silver with copper paste could eliminate the largest single material cost component in solar cell manufacturing. Research timelines of 12-18 months for initial results indicate that this technology transition could occur within the current market cycle.
International collaboration in copper replacement research involves universities and suppliers across Europe and Asia, demonstrating the global nature of solar technology development. According to recent industry reports, this collaboration approach accelerates innovation by leveraging diverse expertise and research capabilities across multiple institutions and commercial partners.
"The shift from silver to copper in solar cell manufacturing represents more than cost reduction; it fundamentally enhances supply chain security by reducing dependency on precious metals while maintaining electrical performance standards required for international markets."
Equipment modification requirements for copper paste implementation are described as minor, suggesting that existing production facilities can adapt to new materials without major capital expenditure. This compatibility reduces the barrier to technology adoption and enables faster industry-wide implementation once copper paste technology proves commercially viable.
Import Dependency Paradox in Export Growth
India maintains a net import position in solar products despite growing export volumes, reflecting the complex structure of the global solar supply chain. While Indian manufacturers export finished modules and cells, they continue importing upstream components, raw materials, and specialised equipment necessary for production. This situation demonstrates how global copper supply dynamics affect manufacturing strategies.
China retains 78.1% market share of India's module and cell imports in Q1 2025, demonstrating continued dependency on Chinese suppliers even as Indian manufacturers compete with Chinese companies in export markets. This creates an interconnected trade relationship where Indian manufacturers simultaneously compete with and depend upon Chinese suppliers.
India's Solar Trade Balance Analysis:
| Trade Category | Volume (GW) | Value (USD Billion) | Primary Partner |
|---|---|---|---|
| Total Exports | 15.0 | $2.0 | United States (97%) |
| Total Imports | 25.0+ | $2.85 | China (78.1%) |
| Net Position | -10.0 | -$0.85 | Import Dependent |
Vietnam has emerged as the second-largest import source with 9.8% market share, representing efforts to diversify import sources beyond China. This diversification reflects similar supply chain risk management strategies that are driving demand for Indian solar exports in Western markets.
Cell manufacturing capacity gaps relative to module assembly capacity create structural import requirements. While India has developed substantial module assembly capabilities, upstream cell production remains insufficient to supply domestic assembly needs. This gap necessitates continued imports of cells for final assembly into modules for both domestic use and export.
The next major ASX story will hit our subscribers first
Policy Framework Architecture Supporting Export Competitiveness
Domestic Content Requirements through the Approved List of Models and Manufacturers (ALMM) system create protective barriers that support domestic manufacturing while encouraging export focus. By restricting domestic market access to approved domestic suppliers, these policies create incentives for manufacturers to develop export markets for excess capacity.
The reimposition of ALMM requirements resulted in a 35.1% year-over-year decline in imports during Q1 2025, demonstrating the effectiveness of policy tools in protecting domestic market share. This import reduction creates additional domestic demand for locally manufactured products while encouraging capacity expansion that can serve export markets.
Trade agreement optimisation with the United States provides substantial competitive advantages through preferential tariff treatment. The reduction of import duties on Indian solar products from 50% to 18% creates a significant cost advantage compared to Chinese suppliers facing higher tariff rates.
Policy Impact Assessment:
• Import reduction: 35.1% decrease in Q1 2025 following ALMM reimposition
• Tariff advantage: 32 percentage point advantage over Chinese competitors in US market
• Domestic market protection: ALMM system ensures captive domestic demand
• Export incentive alignment: Policies encourage manufacturers to develop international markets
Manufacturing incentive structures through Production Linked Incentive (PLI) schemes provide financial support for capacity expansion targeted at export markets. These incentives reduce the capital cost of establishing manufacturing capacity while creating performance requirements that encourage international competitiveness.
Strategic Positioning in Global Supply Chain Transformation
China Plus One strategies adopted by multinational corporations create systematic opportunities for Indian manufacturers to establish long-term supply relationships. These strategies involve deliberately allocating portions of procurement volume to suppliers outside China to reduce supply chain concentration risk, particularly relevant to renewable energy transformations across industries.
Implementation of China Plus One approaches varies across companies and sectors, with some organisations setting specific percentage targets for non-Chinese suppliers while others establish minimum supplier diversification requirements. Understanding these corporate strategies enables Indian manufacturers to position their capabilities appropriately for different customer segments.
Risk mitigation considerations driving supply chain diversification include geopolitical stability, trade policy predictability, currency stability, and operational continuity. Indian manufacturers must demonstrate capabilities across all these dimensions to qualify as viable alternatives to Chinese suppliers for major procurement programmes.
How Can Indian Manufacturers Access New Markets?
Market access expansion beyond current export destinations requires building relationships with procurement organisations, meeting certification requirements, and establishing local support capabilities. Each new market presents distinct entry barriers and competitive requirements that must be systematically addressed.
European market development opportunities arise from evolving tender specifications that increasingly favour non-Chinese suppliers. Success in European markets requires understanding complex regulatory environments, building relationships with local partners, and adapting products to specific technical requirements across multiple jurisdictions.
Strategic partnership development with international companies provides pathways for market entry and technology sharing. Joint ventures, licensing agreements, and supply partnerships enable Indian manufacturers to access international markets while building capabilities for independent expansion.
Economic Multiplier Effects and Industry Development
Employment generation from solar export growth extends beyond direct manufacturing jobs to encompass supporting industries and services. Each GW of additional export capacity typically supports employment across raw material suppliers, logistics providers, quality testing services, and research and development activities, contributing to energy transition security requirements.
Direct manufacturing employment in the solar sector has expanded significantly with capacity additions, creating opportunities in skilled technical positions, quality control, production management, and engineering support. These positions typically offer higher wages than traditional manufacturing sectors, contributing to economic development in manufacturing regions.
According to IEEFA analysis, indirect employment effects include growth in supporting industries such as specialised transportation, packaging, testing equipment, and maintenance services. The development of solar manufacturing clusters creates ecosystem effects that support broader industrial development.
Economic Impact Analysis:
• Export revenue generation: $2 billion annually from solar exports
• Employment creation: Direct manufacturing jobs plus indirect support roles
• Technology ecosystem development: R&D capabilities and innovation infrastructure
• Regional economic development: Manufacturing hub creation and supporting services
Technology ecosystem development around solar manufacturing includes research institutions, testing facilities, equipment suppliers, and specialised service providers. This ecosystem creation provides long-term competitive advantages by supporting continued innovation and cost reduction.
Innovation infrastructure development includes establishment of research centres, testing laboratories, and pilot production facilities. These capabilities support product development, quality assurance, and technology commercialisation activities that enhance long-term competitiveness in international markets.
Foreign exchange earnings from solar exports contribute significantly to India's trade balance in renewable energy products. The $2 billion in annual export revenue helps offset import costs for other energy-related products and contributes to overall energy trade balance improvement.
Regional economic development impacts concentrate in areas with significant solar manufacturing capacity, creating industrial clusters with specialised workforce capabilities and supporting infrastructure. These developments often attract additional investment in related industries and contribute to broader economic growth in manufacturing regions.
This analysis is based on publicly available industry data and market research. Investment decisions should consider multiple factors and professional consultation. Market conditions and policy frameworks continue evolving, potentially affecting future outcomes discussed in this analysis.
Considering Opportunities in Small-Cap Solar Manufacturing Companies?
Discovery Alert's proprietary Discovery IQ model delivers real-time notifications on significant mineral discoveries that power solar technology manufacturing, instantly empowering subscribers to identify actionable investment opportunities ahead of the broader market. Begin your 14-day free trial today and secure your market-leading advantage in this rapidly evolving sector.