July 31, 2026
Global silver markets are experiencing a fundamental structural shift that extends far beyond traditional investment demand patterns. While precious metals markets have historically been driven by monetary policy, inflation hedging, and speculative positioning, a new industrial demand dynamic is emerging that could reshape supply-demand fundamentals for decades. The convergence of technological advancement, demographic transformation, and energy transition policies is creating unprecedented silver consumption patterns, with India's growing demand for silver in solar energy positioned as the epicentre of this market evolution.
India's Energy Transition Blueprint: A 30-Year Silver Demand Forecast
Renewable Energy Capacity Targets and Silver Consumption Projections
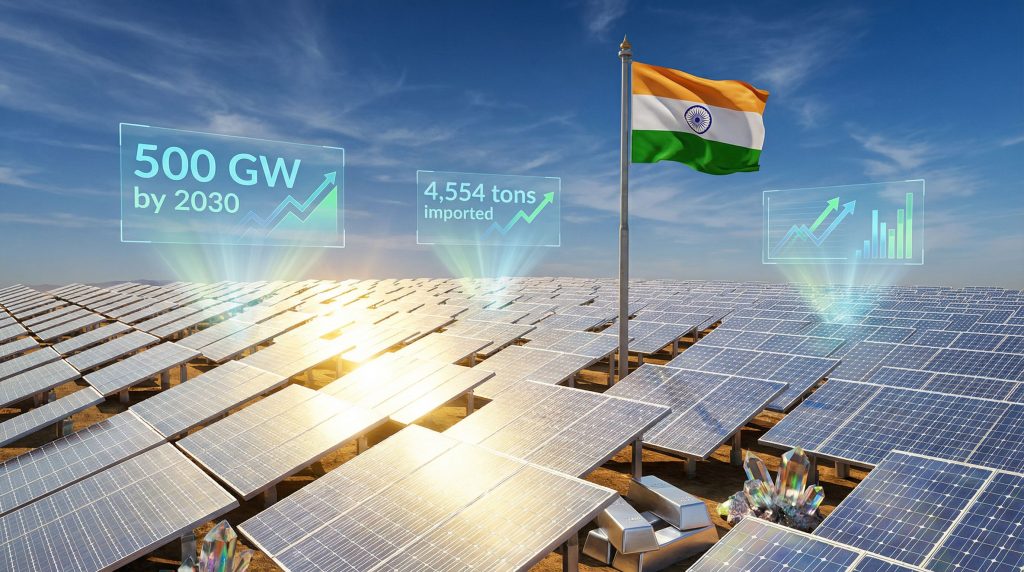
India's commitment to achieving 500 GW of renewable energy capacity by 2030 represents more than an environmental policy objective. This target translates into massive industrial silver requirements that dwarf traditional jewellery and investment demand patterns. Furthermore, the International Energy Agency projects that India will experience the largest energy demand growth of any nation over the next three decades, with renewable sources expected to capture an increasing share of this expansion.
Current solar photovoltaic technology consumes approximately 8 micrograms of silver per watt of generating capacity. This represents a dramatic reduction from the 73 micrograms per watt required in 2011, demonstrating the industry's success in silver thrifting through technological improvements. However, the scale of India's renewable expansion means that even with improved efficiency, absolute silver consumption will surge dramatically.
Key Silver Demand Projections:
- Current installed renewable capacity: 180-190 GW (2024)
- Target capacity by 2030: 500 GW
- Required capacity addition: 320 GW over six years
- Annual average addition: 53 GW per year
Economic Growth Drivers Behind Energy Modernisation
India's economic trajectory provides the fundamental driver for energy infrastructure expansion. With GDP growth projected at 6-7% annually through 2030 according to IMF forecasts, the nation requires corresponding energy capacity increases to support industrial development and urbanisation.
The World Bank projects that India's urban population will expand from approximately 565 million in 2023 to over 800 million by 2050. This demographic shift creates concentrated energy demand in metropolitan areas, driving distributed solar installations and large-scale renewable projects to serve urban centres.
Demographic and Economic Indicators:
| Metric | Current (2024) | Projected (2030) | Growth Rate |
|---|---|---|---|
| Population | 1.45 billion | 1.5 billion | 0.6% annually |
| Urban Population | 565 million | 650 million | 2.3% annually |
| GDP Growth | 6.5% | 6.2% | Sustained expansion |
| Energy Demand Growth | 4-5% annually | Accelerating | IEA projection |
Infrastructure Development Timelines Across Major States
State-level renewable energy programmes demonstrate the distributed nature of India's solar expansion. Rajasthan's solar corridor development leverages the state's exceptional solar irradiance, while Tamil Nadu focuses on rooftop installations across industrial zones. Karnataka's programmes emphasise industrial solar adoption, reflecting the state's manufacturing base.
Each state's approach creates different silver demand patterns. In addition, large-scale utility projects require massive silver paste quantities delivered over construction phases, while distributed installations create steady, geographically dispersed demand for smaller silver quantities.
When big ASX news breaks, our subscribers know first
What Makes India's Silver Import Strategy Different from Traditional Markets?
Industrial vs. Investment Demand Shift Analysis
India's silver import composition reveals a fundamental market transformation that distinguishes it from traditional precious metals consumers. Analysis of 2024 import data demonstrates the shift from wealth storage to manufacturing consumption patterns, particularly affecting silver supply deficits globally.
Silver Import Composition Changes (July 2024):
| Form | Percentage | Primary Use | Market Segment |
|---|---|---|---|
| Grain Form | 67% | Industrial processing | Solar manufacturing |
| Bar Form | 29% | Investment purposes | Wealth storage |
| Wire/Sheet Form | 4% | Manufacturing applications | Electronics/jewellery |
This composition represents a dramatic shift from March 2024 data, which showed higher bar form percentages. Furthermore, the movement toward grain form imports indicates accelerating India's growing demand for silver in solar energy applications, as grain silver serves as the raw material for silver paste production.
The transformation reflects India's evolution from a traditional precious metals market focused on cultural and investment demand toward an industrial consumption economy. Traditional festival-driven purchasing cycles around Dhanteras and Diwali continue to influence market dynamics, but industrial demand is becoming the dominant driver.
Seasonal Import Patterns and Cultural Factors
India's precious metals purchasing patterns historically follow agricultural and cultural cycles. Harvest seasons provide rural populations with cash liquidity for precious metals purchases, while urban festival celebrations drive jewellery and silverware demand.
However, industrial silver demand follows different seasonal patterns tied to solar project construction schedules and manufacturing cycles. This creates a more stable, year-round demand profile that reduces the traditional volatility associated with cultural purchasing cycles.
Cultural vs. Industrial Demand Patterns:
- Traditional demand: Concentrated in October-November (festival season)
- Industrial demand: Distributed across construction and manufacturing cycles
- Investment demand: Counter-cyclical to equity markets and inflation expectations
- Export manufacturing demand: Tied to global solar project development timelines
How Do Advanced Solar Technologies Multiply Silver Requirements?
Next-Generation Panel Technology Silver Intensity
The solar manufacturing industry's transition to higher-efficiency cell architectures creates a countertrend to silver thrifting efforts. While manufacturing improvements continue reducing silver consumption per unit of output, advanced technologies require substantially more silver per watt of capacity, consequently affecting market squeeze impact globally.
Technology-Specific Silver Consumption:
| Technology | Silver Intensity | Efficiency Gain | Market Adoption |
|---|---|---|---|
| PERC | Baseline consumption | Standard efficiency | Mature technology |
| TopCon | +50% silver content | Higher efficiency | Rapid adoption |
| HJT (Heterojunction) | +150% silver content | Premium efficiency | Emerging deployment |
TopCon (Tunnel Oxide Passivated Contact) technology incorporates additional passivation layers that require more sophisticated silver contact formation. Heterojunction technology combines crystalline silicon with amorphous silicon layers, creating cell architectures that demand increased silver electrode requirements for optimal electrical performance.
Manufacturing Process Evolution and Silver Paste Applications
Solar cell manufacturing relies on conductive silver paste applied to cell surfaces through precision screen printing or inkjet printing processes. The paste composition includes silver powder, glass frit, and organic vehicles that determine both electrical performance and manufacturing efficiency.
Advanced cell designs require finer grid patterns and more precise silver deposition to minimise resistive losses while maximising light capture. This precision requirement often increases silver consumption even as overall paste efficiency improves through better application techniques.
Silver Paste Technical Requirements:
- Electrical conductivity: Silver provides superior performance vs. alternatives
- Corrosion resistance: Essential for 25-year module lifespans
- Thermal stability: Required for high-temperature manufacturing processes
- Adhesion properties: Critical for mechanical durability
Which Mega-Projects Are Driving India's Silver Demand Surge?
Gujarat State Renewable Energy Park Case Study
The Adani Green Energy renewable energy park in Gujarat State represents the scale of individual projects driving India's growing demand for silver in solar energy. The project specifications demonstrate how concentrated developments create substantial localised silver requirements.
Project Development Phases:
- Total planned capacity: 30 GW
- Construction timeline: 5-year development period
- Annual capacity additions: Approximately 6 GW per phase
- Geographic concentration: Single location in Gujarat desert region
- Projected household coverage: 16 million homes
The project's location in previously barren desert land represents India's strategic approach to renewable development without competing with agricultural land use. This geographic strategy enables massive project scaling while avoiding displacement of existing economic activities.
State-Level Solar Installation Programmes
India's distributed approach to renewable development creates multiple silver demand centres across different states. Each region's solar development follows distinct patterns based on local resources, industrial base, and grid infrastructure.
Regional Development Characteristics:
- Rajasthan: Large-scale utility projects leveraging high solar irradiance
- Tamil Nadu: Industrial rooftop installations supporting manufacturing zones
- Karnataka: Commercial and industrial solar adoption programmes
- Gujarat: Utility-scale projects and renewable energy parks
- Andhra Pradesh: Distributed solar programmes across agricultural regions
This geographic distribution creates supply chain complexity for silver paste suppliers, requiring multiple distribution points and inventory management across different regional markets.
What Do Import Statistics Reveal About Market Transformation?
Monthly Import Volume Analysis
India's silver import patterns in 2024 demonstrate unprecedented volatility and scale that reflect underlying demand transformation. The monthly data reveals both the magnitude of change and the concentrated nature of purchasing patterns, which have created significant tariff impacts on silver pricing globally.
Critical Import Statistics:
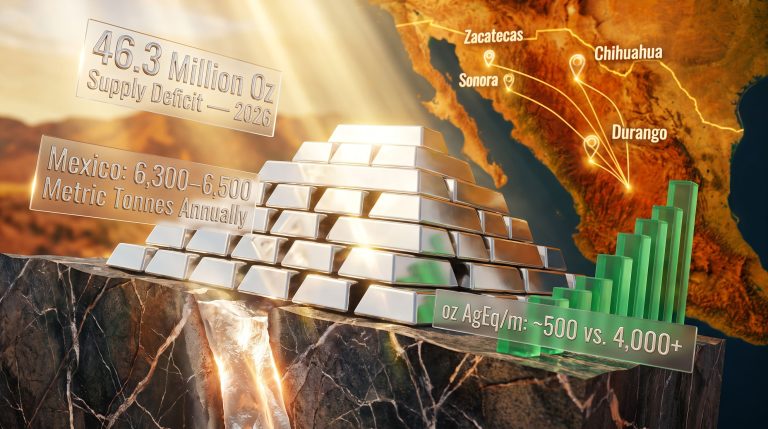
- February 2024 peak: 70.7 million ounces imported
- Proportion of annual demand: Equivalent to 64% of 2023's full-year imports
- First half 2024: 4,554 tons vs. 560 tons in first half 2023
- Growth multiple: 8-fold increase year-over-year
- Projected annual range: 6,500-7,000 tons potential
These import volumes require context within India's broader economic patterns. The February surge may reflect anticipatory purchasing ahead of policy changes, inventory building by manufacturers facing strong demand forecasts, or seasonal variations in project financing and procurement cycles.
Duty Structure Impact on Market Accessibility
India's reduction of import duties from 15% to 6% in July 2024 created immediate price competitiveness improvements for domestic silver-consuming industries. The 9-percentage-point reduction translates to approximately 9% cost reduction for imported silver, enhancing margins for domestic manufacturers or enabling price reductions to customers.
Policy Impact Analysis:
- Previous duty structure: 15% import duty
- Revised duty structure: 6% import duty
- Net cost reduction: 9 percentage points
- Policy objective: Enhance domestic value addition in precious metals jewellery
- Secondary effect: Improved competitiveness for industrial silver applications
The timing of duty reduction coinciding with import surge creates analytical complexity in distinguishing policy-driven effects from underlying demand growth. However, the scale of import increases suggests structural demand changes beyond policy adjustments.
How Will Technology Substitution Affect Long-Term Silver Demand?
Copper-Based Alternative Development Timeline
The solar manufacturing industry continues researching silver substitutes to reduce input costs and supply dependency. Silver-coated copper paste represents the most commercially viable near-term alternative, offering 30-50% silver content reduction compared to current formulations.
Full copper metallisation remains a research objective, but production line compatibility and electrical performance requirements create significant technical hurdles. Manufacturing equipment designed for silver paste application requires modifications to accommodate different material properties and processing temperatures.
Substitution Technology Assessment:
- Silver-coated copper: Partial substitution with proven performance
- Full copper metallisation: Long-term research objective with technical challenges
- Alternative conductors: Early-stage research with limited commercial viability
- Process modifications: Required equipment changes affect adoption timelines
Efficiency Improvements vs. Capacity Expansion Balance
The solar industry faces competing trends between silver thrifting (reducing silver per unit) and capacity expansion (increasing total silver consumption). Historical efficiency improvements have achieved substantial silver reduction per watt, but expanding solar deployment more than offsets per-unit savings, creating potential for silver squeeze strategies to emerge.
Scenario Modelling Framework:
| Scenario | Efficiency Gains | Capacity Growth | Net Silver Demand |
|---|---|---|---|
| Conservative | 4-5% quarterly reduction | Moderate expansion | Stable to growing |
| Balanced | 3-4% quarterly reduction | 15% annual growth | Strong growth |
| Aggressive | 2-3% quarterly reduction | 20%+ annual growth | Dramatic growth |
The mathematical relationship demonstrates that capacity expansion rates exceeding efficiency improvement rates create net silver demand growth. India's renewable energy targets suggest expansion rates that overwhelm efficiency gains.
The next major ASX story will hit our subscribers first
What Are the Geopolitical Implications of India's Silver Strategy?
Supply Chain Diversification Requirements
India's emergence as a major industrial silver consumer creates strategic dependencies on international silver markets. Unlike traditional jewellery demand, which allows inventory flexibility and timing adjustments, industrial manufacturing requires consistent supply reliability.
The concentration of global silver mining in specific geographic regions creates potential supply vulnerabilities. Primary silver mines provide approximately 25-30% of global supply, with the remainder coming as by-products from base metal mining operations.
Supply Chain Risk Factors:
- Geographic concentration: Limited number of primary silver producing regions
- By-product dependency: 70-75% of silver comes from base metal mining
- Transportation logistics: Bulk silver shipments require specialised handling
- Currency exposure: Silver pricing in USD creates exchange rate risks
Competition with China's Solar Manufacturing Dominance
China's control of approximately 80% of global solar panel manufacturing creates both opportunity and competitive pressure for India's solar industry development. As Indian manufacturers scale production capacity, they compete directly with established Chinese supply chains for silver and other critical materials.
Competitive Dynamics:
- Market share potential: India targeting increased global manufacturing share
- Technology transfer: Access to advanced manufacturing processes
- Cost competitiveness: Labour costs vs. scale advantages
- Export opportunities: Domestic manufacturing supporting international markets
Investment Implications: Which Sectors Benefit Most?
Silver Mining Companies Exposure to Indian Demand
Primary silver producers and companies with significant silver by-production benefit directly from India's demand growth. Geographic proximity to Indian markets provides logistics advantages, while long-term supply contracts offer revenue stability. This trend aligns with broader market transformation insights affecting global investment patterns.
Mining Sector Considerations:
- Primary producers: Companies with silver as primary product benefit most
- By-product operations: Base metal miners with silver production gain exposure
- Geographic advantages: Proximity to Indian ports reduces shipping costs
- Contract opportunities: Long-term supply agreements with Indian manufacturers
Solar Manufacturing Value Chain Analysis
The solar manufacturing value chain experiences both opportunities and margin pressures from silver demand growth. Silver paste suppliers benefit from volume growth but face input cost pressures. Solar panel manufacturers must balance efficiency improvements against material cost increases.
Value Chain Impact Assessment:
- Silver paste manufacturers: Direct beneficiaries of volume growth
- Solar cell producers: Cost pressures offset by efficiency improvements
- Module assemblers: Pass-through pricing to project developers
- Project developers: Solar installation costs affected by material inflation
FAQ: Understanding India's Solar Silver Revolution
How much silver does a typical solar panel require?
Current solar technology consumes approximately 8 micrograms of silver per watt of generating capacity. A typical residential solar panel rated at 400 watts would therefore contain approximately 3.2 milligrams of silver. However, advanced technologies like TopCon and HJT require substantially more silver per watt, potentially doubling or tripling these quantities.
Why can't solar manufacturers completely eliminate silver?
Silver's unique combination of electrical conductivity, corrosion resistance, and thermal stability makes it irreplaceable in current solar cell architectures. While alternative materials exist, they either provide inferior electrical performance, require different manufacturing processes, or fail to meet the 25-year durability requirements for commercial solar installations.
What happens if silver prices continue rising?
Rising silver prices create cost pressures throughout the solar value chain that eventually pass through to project developers and electricity consumers. However, solar installation costs have declined dramatically over the past decade, providing cushion against material cost increases. Sustained silver price increases would accelerate research into substitute materials and manufacturing process improvements.
Future Outlook: India as a Global Silver Demand Driver
2030 Demand Projection Scenarios
India's renewable energy commitments suggest sustained silver demand growth through the end of the decade. Multiple scenario analyses demonstrate that even conservative assumptions regarding efficiency improvements and capacity additions result in substantial silver consumption increases, as highlighted by experts tracking India's renewable energy sector growth.
Demand Scenario Analysis:
| Scenario | 2030 Capacity | Technology Mix | Silver Demand |
|---|---|---|---|
| Conservative | 400 GW | Current technology | Moderate growth |
| Target Achievement | 500 GW | Mixed technology | Strong growth |
| Aggressive Expansion | 600+ GW | Advanced technology | Dramatic growth |
Integration with Global Silver Market Dynamics
India's emergence as a major industrial silver consumer occurs within the context of global silver market deficits projected for six consecutive years. Supply constraints from by-product mining limitations and limited primary silver development suggest sustained price pressure that could affect solar development economics, particularly as solar industry costs rise due to material price increases.
Market Integration Factors:
- Global deficit conditions: Supply constraints supporting price strength
- Industrial demand growth: Electronics and automotive sectors also increasing consumption
- Investment demand volatility: Economic uncertainty affecting traditional silver investment
- Mining supply response: Limited near-term production increases available
The convergence of these factors suggests that India's growing demand for silver in solar energy will continue to be a dominant force shaping global precious metals markets throughout the remainder of this decade and beyond.
Disclaimer: This analysis involves forecasts, projections, and speculative elements regarding future market conditions, technology adoption, and economic developments. Silver markets and solar industry developments involve substantial risks and uncertainties. Readers should conduct independent research and consult qualified professionals before making investment decisions. Past performance and historical trends do not guarantee future results.
Looking to Capitalise on India's Silver-Solar Revolution?
Discovery Alert's proprietary Discovery IQ model delivers instant notifications on significant ASX mineral discoveries, empowering subscribers to identify actionable opportunities in precious metals and critical minerals sectors ahead of broader market awareness. Explore how major mineral discoveries can generate substantial returns by visiting Discovery Alert's dedicated discoveries page, showcasing historic examples of exceptional market outcomes, and begin your 14-day free trial today to position yourself ahead of evolving commodity demand cycles.