June 30, 2026
India's renewable energy expansion represents one of the most significant transformations in global power markets, fundamentally reshaping energy economics across multiple sectors. The transition from power deficiency to surplus capacity demonstrates how rapidly emerging economies can leverage modern renewable technologies to achieve energy security while creating new industrial competitiveness advantages.
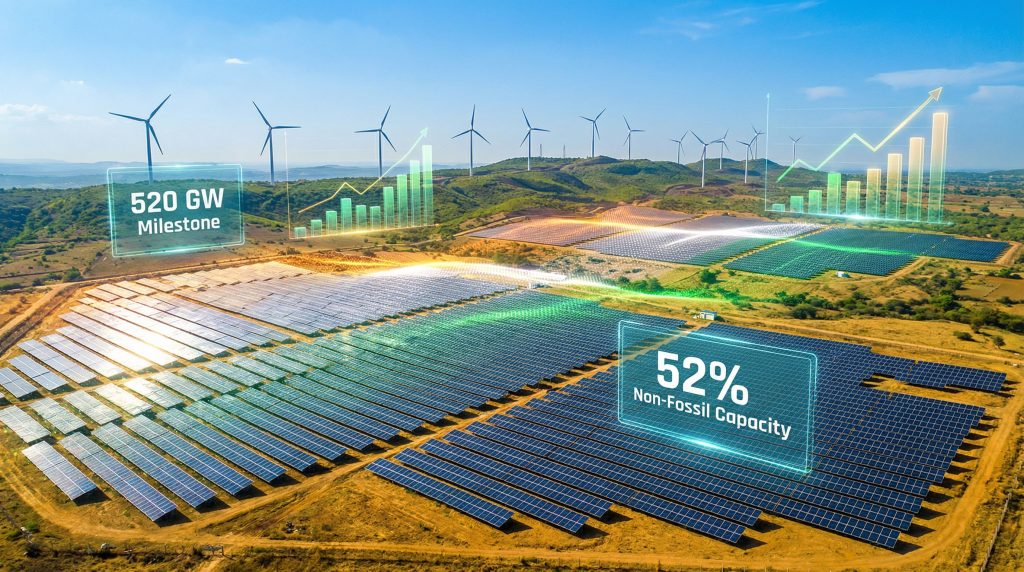
What Does India's 520 GW Milestone Mean for Global Energy Economics?
India's achievement of 520 GW installed capacity with 52% non-fossil sources represents a structural inflection point in global power markets. This milestone, reached approximately five years ahead of original 2030 targets, demonstrates the acceleration capability of renewable deployment when supported by appropriate policy frameworks and manufacturing scale.
Furthermore, this achievement positions India as a significant player in the critical minerals energy transition, creating substantial demand for lithium, copper, and rare earth elements required for renewable energy infrastructure.
Breaking Down the Economic Scale of India's Power Transformation
The statistical progression reveals the magnitude of this transformation. Between April 2025 and January 2026 alone, India added 52.5 GW of new capacity, with 44.5 GW from renewable sources – nearly double the previous year's deployment pace. This acceleration trajectory suggests compounding effects in both supply chain maturation and installation capability.
Key Performance Metrics:
• Total installed capacity: 520 GW (January 2026)
• Non-fossil capacity: 272 GW (52% of total)
• Annual renewable additions (2025): 44.5 GW
• Grid scheduling intervals: 15 minutes (indicating advanced dispatch capability)
• Historical comparison: 32% non-fossil capacity in 2016 vs 52% in 2026
The economic implications extend beyond capacity statistics. A decade ago, India operated with a 4-5% electricity deficit; today it approaches surplus capacity while serving the world's third-largest electricity demand base. This transition occurred alongside substantial grid modernisation, including smart metering deployment and digital load management systems.
However, a critical distinction emerges between installed capacity and actual generation patterns. While non-fossil sources comprise 52% of installed capacity, coal still accounts for over 70% of actual electricity generation. This reflects the capacity factor challenge inherent in variable renewable sources – solar photovoltaic systems typically achieve 18-22% capacity factors in India's geographic context, while wind resources achieve 25-35% depending on location.
Comparative Analysis: India vs. Global Renewable Leaders
India's renewable expansion velocity positions it uniquely among major economies. The 52% non-fossil capacity milestone places India ahead of several developed markets in renewable penetration, though behind leaders like Denmark (approximately 80% wind penetration) and Costa Rica (over 99% renewable electricity generation).
Investment Efficiency Comparison:
| Country | Renewable Capacity Added (2020-2025) | Investment per GW | Capacity Factor Achievement |
|---|---|---|---|
| India | 180+ GW | $0.8-1.2 billion | 20-28% |
| China | 300+ GW | $0.9-1.4 billion | 22-32% |
| United States | 120+ GW | $1.5-2.2 billion | 25-35% |
| European Union | 150+ GW | $2.0-3.0 billion | 30-40% |
The cost competitiveness of sub-INR 4 per unit renewable tariffs (approximately $0.048/kWh) positions India among the globally competitive renewable energy markets. This pricing represents a significant reduction from historical levels and creates meaningful advantages for energy-intensive industries.
When big ASX news breaks, our subscribers know first
Why Are Energy-Intensive Industries Watching India's Grid Revolution?
Energy-intensive manufacturing sectors face a fundamental recalculation of production economics as India's renewable energy expansion reshapes input cost structures. The emergence of reliable, low-cost renewable electricity creates new competitive dynamics across aluminium smelting, steel production, and chemical processing industries.
The Manufacturing Cost Equation
For aluminium smelting operations, electricity represents 35-40% of total production costs. The Hall-Héroult process used in primary aluminium production requires 12-15 MWh of electricity per metric ton of output, making power costs the dominant variable in smelter economics.
The promise of sub-INR 4 renewable tariffs creates substantial competitive advantages. A reduction from typical industrial tariffs of INR 6-7 per unit to INR 4 per unit generates approximately 20-30% improvement in total smelting economics, depending on specific process technology and facility efficiency.
In addition, developments in direct lithium extraction technologies are reducing the environmental footprint of lithium processing, aligning with India's sustainability objectives.
Regional Electricity Cost Analysis:
• Global industrial electricity prices (2025-2026): $60-120/MWh
• Sub-INR 4 renewable tariffs: Approximately $48/MWh
• Competitive advantage: 20-60% below global benchmarks
• Aluminium smelting power intensity: 12-15 MWh per metric ton
• Cost impact: $150-300 per metric ton savings potential
This cost advantage becomes particularly significant when considering the continuous baseload power requirements of aluminium smelting. Historically, smelting operations concentrated in regions with abundant hydroelectric power (Canada, Iceland, Norway) or low-cost fossil fuel resources. India's renewable energy expansion introduces a new geographic pole for competitive smelting capacity.
Industrial Policy Implications
The technical requirements for aluminium smelting present unique challenges for renewable energy integration. Primary aluminium production requires direct current supply at very high currents (300,000+ amperes in modern cells) with stringent power quality requirements. Frequency variations, voltage fluctuations, or supply interruptions exceeding milliseconds can damage electrolyte chemistry and cell operations.
Modern developments in grid-interactive battery systems and advanced power electronics now enable renewable-powered smelting through:
• Co-located battery storage facilities providing smoothing and voltage support
• Advanced converter systems managing variable renewable sources and DC smelting loads
• Grid-scale storage enabling continuous industrial operations
• Performance-based incentive schemes and capital subsidies for renewable energy projects
Several major Indian aluminium producers have announced capacity expansion plans explicitly citing renewable energy cost advantages. This trend reflects the industry's recognition that India's renewable energy expansion creates opportunities for production cost optimisation not available in traditional smelting regions.
What Role Does Energy Storage Play in India's 900 GW Vision?
Energy storage has emerged as the critical bottleneck constraining India's renewable expansion velocity. The ambitious target of integrating 900 GW of non-fossil capacity by 2035-36 fundamentally depends on parallel storage infrastructure development to maintain grid stability and reliability.
Storage Economics and Grid Stability
Industry analysis indicates that approximately 50-100 GWh of storage capacity is required per 100 GW of variable renewable generation to maintain grid stability without excessive curtailment or demand management. Applied to India's 900 GW target, this implies a requirement for 450-900 GWh of cumulative storage capacity.
Current global utility-scale battery storage capacity stands at approximately 50-60 GWh as of early 2026. India's requirement would represent an enormous expansion of global battery manufacturing and deployment – potentially 8-15 times current global capacity.
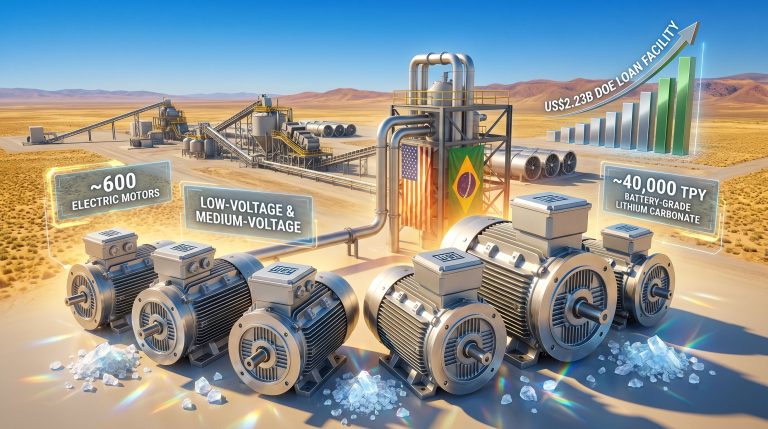
The demand for Indian battery-grade lithium refining capacity will surge as domestic storage requirements expand. This creates opportunities for value-added lithium processing within India's borders.
Storage Cost Trajectory Analysis:
| Technology | 2025 Cost ($/kWh) | 2030 Projection ($/kWh) | System Cost (4-hour duration) |
|---|---|---|---|
| Lithium-ion | $130-150 | $80-100 | $520-600/kWh |
| Flow Batteries | $300-400 | $150-200 | $1,200-1,600/kWh |
| Compressed Air | $150-250 | $100-150 | $600-1,000/kWh |
| Pumped Hydro | $50-100 | $50-80 | $200-400/kWh |
At current costs, a 1 GWh battery storage facility would require approximately $450-600 million to construct. Scaling to India's implied storage requirement suggests total capital investment of $200-500 billion in battery storage infrastructure through 2035-36.
Technology Investment Landscape
India's storage requirements will likely utilise multiple technology options beyond lithium-ion batteries exclusively. Pumped hydro storage remains the largest contributor globally, but suitable geographic locations face environmental and displacement constraints. India currently operates approximately 42 GW of pumped storage capacity, but expanding this faces geographical limitations.
Alternative technologies serving specific niches include:
• Long-duration flow batteries for 8-12 hour storage applications
• Compressed air energy storage for bulk grid stability
• Hydrogen electrolysis paired with fuel cells for seasonal storage
• Advanced inverters and battery management systems for multiple grid services
Modern storage systems provide multiple revenue streams beyond energy arbitrage: frequency regulation, voltage support, and fault ride-through capabilities. These multi-service capabilities improve project economics by 20-40% depending on market design, making storage investments more financially viable.
How Will India's Renewable Surge Impact Global Commodity Markets?
India's renewable energy expansion creates unprecedented demand for critical minerals and materials, potentially reshaping global supply chains and commodity pricing dynamics across multiple sectors. The scale of India's ambitions generates material requirements that influence global markets for lithium, rare earth elements, copper, and steel.
Critical Mineral Demand Projections
The construction of 900 GW renewable capacity requires substantial material inputs across solar panels, wind turbines, transmission infrastructure, and storage systems. Solar photovoltaic installations require approximately 4-6 metric tons of materials per MW (including silicon, silver, aluminium, and glass), while wind turbines require 200-300 metric tons per MW (primarily steel and rare earth elements).
Material Requirements for 900 GW Target:
• Solar capacity (estimated 600 GW): 2.4-3.6 million metric tons of materials
• Wind capacity (estimated 300 GW): 60-90 million metric tons of materials
• Battery storage (450-900 GWh): 1.5-3.0 million metric tons lithium equivalent
• Transmission infrastructure: 15-25 million metric tons of copper and aluminium
The lithium demand implications are particularly significant. Battery storage requirements for grid stabilisation could consume 1.5-3.0 million metric tons of lithium carbonate equivalent – representing approximately 15-30% of current global lithium production dedicated to India's renewable energy expansion alone.
Consequently, India's lithium supply strategy has become increasingly focused on securing long-term supply agreements with producing nations and developing domestic processing capabilities.
Manufacturing Supply Chain Implications
India's domestic manufacturing policies include local content requirements and production-linked incentive schemes for renewable energy components. These policies aim to capture value-added manufacturing rather than simply importing finished equipment.
Current domestic manufacturing capacity covers approximately:
• Solar modules: 15-20 GW annual production capacity
• Wind turbines: 8-12 GW annual production capacity
• Battery cells: 2-5 GWh annual production capacity
• Power electronics: 60-80% of domestic demand
The gap between domestic production capacity and deployment targets necessitates substantial imports, creating trade policy implications for clean energy technology. Import dependency for critical components could create supply chain vulnerabilities, driving policy emphasis toward domestic manufacturing scale-up.
Similarly, copper market trends indicate potential supply constraints as global electrification accelerates. India's renewable expansion will compete with other emerging economies for limited copper supplies essential for electrical infrastructure.
What Are the Regional Economic Development Patterns?
India's renewable energy expansion generates geographically concentrated economic benefits, with certain states emerging as renewable energy hubs while others focus on manufacturing and grid integration services. This regional specialisation creates new patterns of economic development and inter-state cooperation.
State-Level Renewable Energy Economics
Leading renewable energy states demonstrate distinct advantages in resource quality, policy support, and infrastructure development. Gujarat, Rajasthan, Tamil Nadu, and Karnataka account for approximately 60-70% of India's renewable capacity additions in recent years.
Top Renewable Energy States (2025 Data):
| State | Renewable Capacity (GW) | Primary Resources | Economic Impact |
|---|---|---|---|
| Rajasthan | 45+ | Solar, Wind | $8-12 billion investment |
| Gujarat | 40+ | Solar, Wind | $10-15 billion investment |
| Tamil Nadu | 35+ | Wind, Solar | $7-11 billion investment |
| Karnataka | 30+ | Solar, Wind | $6-10 billion investment |
Regional employment generation follows renewable capacity deployment patterns. The clean energy sector generates approximately 15-25 jobs per MW of installed capacity across construction, manufacturing, operations, and maintenance phases. For states with substantial renewable deployment, this translates to 300,000-500,000 direct and indirect jobs in the clean energy value chain.
Infrastructure Investment Distribution
Transmission infrastructure investment concentrates in renewable-rich states and inter-state connectivity projects. The Green Energy Corridor and interstate transmission system require approximately $15-25 billion investment to accommodate 900 GW renewable capacity integration.
Grid modernisation costs include:
• Smart grid infrastructure: $8-12 billion investment
• Storage integration systems: $5-10 billion investment
• Digital control and metering: $3-7 billion investment
• Grid resilience and backup systems: $2-5 billion investment
Rural electrification improvements through distributed renewable projects create economic multiplier effects in agricultural and rural communities. Rooftop solar, agro-voltaic systems, and mini-grid deployments generate income opportunities for rural households while improving energy access reliability.
How Does India's Energy Transition Compare Globally?
India's renewable energy trajectory demonstrates unique characteristics when benchmarked against other major economies undergoing energy transitions. The combination of deployment speed, cost competitiveness, and integration challenges creates a distinct model for emerging economy renewable transitions.
International Benchmarking Analysis
India's renewable deployment velocity exceeds most major economies when adjusted for economic development stage and infrastructure starting point. The addition of 180+ GW renewable capacity between 2020-2025 represents the world's second-largest absolute increase (after China) and the highest growth rate among major economies.
Global Renewable Deployment Comparison (2020-2025):
• China: 300+ GW added, 2.5x baseline growth
• India: 180+ GW added, 4.2x baseline growth
• United States: 120+ GW added, 1.8x baseline growth
• European Union: 150+ GW added, 1.6x baseline growth
Cost competitiveness analysis reveals India's advantages in manufacturing scale and policy support. Sub-INR 4 renewable tariffs position India among global cost leaders, comparable to utility-scale solar auctions in Chile, Saudi Arabia, and Australia.
According to the International Energy Agency's latest analysis, India requires substantial investment to achieve its renewable energy targets. However, the Central Electricity Authority projects that India's power capacity will double to 1,121 GW by 2035-36, with solar energy leading the transition.
Climate Finance and International Cooperation
Foreign investment flows into India's renewable sector total approximately $25-35 billion annually across equity investments, debt financing, and development finance institution support. Major sources include:
• Multilateral development banks: $8-12 billion annually
• Commercial investment: $12-18 billion annually
• Bilateral development finance: $3-7 billion annually
• Carbon market mechanisms: $1-3 billion annually
Technology adoption patterns show India's preference for proven, cost-effective technologies rather than cutting-edge innovations. This approach prioritises deployment speed and cost optimisation over technological advancement, reflecting resource constraints and scale requirements.
The next major ASX story will hit our subscribers first
What Are the Long-Term Economic Scenarios?
India's renewable energy expansion creates multiple economic scenarios depending on storage deployment success, grid integration effectiveness, and industrial policy coordination. Long-term projections must account for technological uncertainties, policy evolution, and global competitive dynamics.
2030-2035 Economic Modelling
Achieving the 500 GW non-fossil target by 2030 and 900 GW by 2035-36 generates substantial economic impacts across multiple sectors. Conservative modelling suggests GDP contributions of 1.2-2.0% from renewable energy sector development, including direct investment, employment generation, and input cost reductions for energy-intensive industries.
Employment Generation Estimates:
• Direct employment: 2.5-4.0 million jobs across the clean energy value chain
• Indirect employment: 5.0-8.0 million jobs in supporting industries
• Induced employment: 3.0-6.0 million jobs from economic multiplier effects
• Total employment impact: 10.5-18.0 million jobs by 2035
Energy security benefits include reduced fossil fuel import dependency worth approximately $25-40 billion annually at current energy prices. This import substitution creates fiscal space for domestic investment and reduces exposure to global energy price volatility.
Net-Zero Pathway Economics
India's 2070 net-zero commitment requires investment of approximately $10-15 trillion over the next five decades across all sectors. Renewable energy expansion represents approximately 20-30% of total net-zero investment requirements, with the remainder distributed across industrial decarbonisation, transportation electrification, and carbon capture technologies.
Sectoral Investment Requirements (2025-2070):
| Sector | Investment Required | Share of Total |
|---|---|---|
| Renewable Energy | $2.0-4.0 trillion | 20-30% |
| Grid and Storage | $1.5-3.0 trillion | 15-25% |
| Industrial Transition | $3.0-5.0 trillion | 30-40% |
| Transportation | $2.0-3.5 trillion | 15-25% |
| Buildings and Efficiency | $1.5-2.5 trillion | 10-20% |
International competitiveness under carbon pricing scenarios favours India's renewable energy advantages. As global carbon pricing mechanisms expand, India's low-carbon manufacturing capabilities create export opportunities in carbon-intensive sectors like aluminium, steel, and chemicals.
Frequently Asked Questions About India's Renewable Energy Economics
Investment and Market Access Questions
What are the key investment opportunities in India's renewable sector?
Primary investment opportunities concentrate in grid-scale storage projects, transmission infrastructure, and renewable energy manufacturing. Storage projects offer 8-12% IRR potential with 15-20 year contract structures. Manufacturing investments benefit from production-linked incentive schemes offering 4-6% of turnover as government support for eligible technologies.
How do renewable energy costs compare with conventional power?
Current renewable tariffs of INR 2.5-4.0 per unit compare favourably with new coal power costs of INR 4.5-6.0 per unit (including environmental compliance). Natural gas-based power costs INR 8-12 per unit depending on fuel prices. However, renewable costs exclude storage and grid integration expenses, which add INR 1.5-3.0 per unit depending on duration requirements.
What policy support mechanisms exist for renewable energy projects?
Government support includes accelerated depreciation (40% in first year), generation-based incentives for wind projects, viability gap funding for storage projects, and transmission charge waivers for renewable energy projects. Additional state-level incentives vary significantly across jurisdictions.
Industrial and Economic Impact Questions
Which industries benefit most from India's renewable energy expansion?
Energy-intensive industries including aluminium smelting, steel production, cement manufacturing, and chemical processing benefit most from reduced electricity costs. Industries with continuous power requirements benefit particularly from renewable-plus-storage solutions that provide 24/7 clean electricity at competitive tariffs.
How does grid reliability affect industrial planning decisions?
Modern grid management systems achieve 99.5%+ uptime in major industrial corridors, sufficient for most manufacturing operations. However, aluminium smelting and other continuous processes require 99.9%+ reliability, necessitating on-site backup systems or dedicated renewable-plus-storage installations.
What are the employment implications of the energy transition?
The renewable energy sector generates 15-25 jobs per MW of installed capacity across construction, manufacturing, and operations phases. However, coal sector employment reductions create transition challenges in mining-dependent regions. Net employment impact remains positive, with 2-3 jobs created for each job displaced in traditional energy sectors.
This analysis reflects current market conditions and policy frameworks as of early 2026. Investment decisions should consider regulatory changes, technological developments, and market evolution. Energy sector investments carry inherent risks including regulatory changes, technology obsolescence, and commodity price volatility.
Ready to Capitalise on India's Energy Transition Opportunities?
India's renewable energy expansion is creating unprecedented demand for critical minerals including lithium, copper, and rare earth elements. Discovery Alert's proprietary Discovery IQ model delivers instant notifications on significant ASX mineral discoveries across these essential commodities, empowering investors to identify actionable opportunities ahead of the broader market. Start your 14-day free trial today and position yourself at the forefront of the energy transition investment wave.