
June 23, 2026
The Clock Is Already Ticking: How a 60-Day Diplomatic Window Became the Most Consequential Date in Crude Markets
When geopolitical risk gets priced out of a commodity market, the exit is rarely clean. The unwinding of a fear premium embedded over weeks or months can happen within hours, and the resulting price movement tells only part of the story. What remains after the headline volatility fades is often more instructive: a market structure that reveals exactly how thin the underlying supply cushion actually is.
That is precisely the situation energy markets face in mid-2026. The Iran 60-day oil license and August 21 oil market catalyst, authorised by the US Treasury Department on June 22, 2026, have together produced one of the clearest inflection-point setups crude traders have encountered in years. The question is no longer whether the license matters. It is whether the market has correctly priced what happens when it expires.
When big ASX news breaks, our subscribers know first
Understanding the Mechanics of the US Treasury's June 22 Waiver
The Treasury Department's authorisation covers something that would have been unthinkable under the previous sanctions architecture: Iranian crude oil, petroleum products, and related transactions denominated in US dollars. For the first time in decades, dollar-clearing for Iranian crude is legally permitted within the bounds of this instrument.
The license runs from June 22 through August 21, 2026, a hard 60-day window with no automatic renewal mechanism. According to reporting from Barchart, the waiver followed diplomatic movement that also resulted in the lifting of the US Navy's operational blockade on Iranian port access, a development with its own logistical significance for physical oil flows.
The Scale of Supply Being Unlocked
Analysts estimate the waiver could facilitate the movement of roughly 140 million barrels of Iranian crude over its duration. Early logistical activity has already begun: two supertankers entered the Persian Gulf to load approximately 4 million barrels combined, with at least one vessel reportedly vectoring toward Iraq's Basra port, signalling that physical mobilisation has commenced alongside the diplomatic announcement.
The prospect of US imports of Iranian crude and petrochemical products, if confirmed, would represent the first such shipments since the early 1990s. That framing matters. This is not a resumption of a familiar trade route. It is the activation of supply infrastructure that has been dormant for a generation.
The 60-day license is a time-bounded diplomatic instrument, not a permanent sanctions reset. Its hard expiry on August 21 creates a structural inflection point rather than a routine policy milestone. Every barrel that flows under this authorisation flows with a countdown attached.
How Crude Benchmarks Responded to the License Announcement
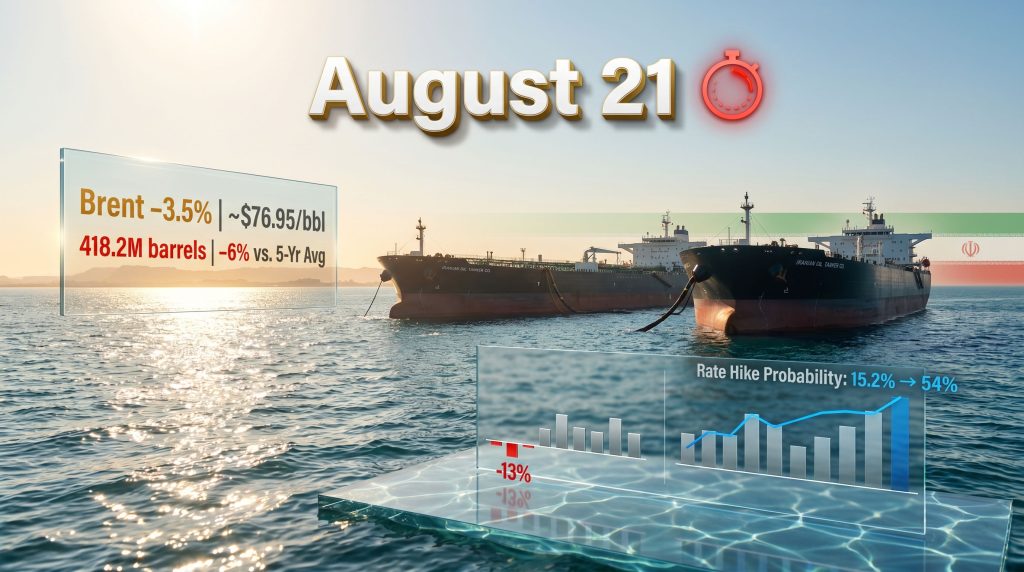
The price reaction was immediate and interpretively significant. Brent crude fell approximately 3.5%, settling near $76.95 to $77 per barrel. WTI dropped roughly 2.7% to around $74 per barrel, while August WTI futures edged up 0.45% intraday to approximately $74.19. These crude oil volatility trends highlight just how rapidly geopolitical developments can reshape benchmark pricing.
For context, WTI had averaged $88.62 per barrel on June 12, 2026, already $5.70 lower than the prior week but still $14.78 higher than a year earlier. The trajectory from that June 12 level to the post-announcement prices reflects the compressed speed at which geopolitical risk premiums can deflate.
| Benchmark | Movement | Level |
|---|---|---|
| Brent Crude | -3.5% (approx.) | ~$76.95-$77/barrel |
| WTI Crude | -2.7% | ~$74/barrel |
| August WTI Futures | +0.45% intraday | ~$74.19/barrel |
| WTI Average (June 12, 2026) | -$5.70 week-over-week | $88.62/barrel |
What the Sell-Off Actually Communicates
Citi's Scott Chronert interpreted the decline as a signal of growing market confidence that the conflict trajectory is shifting toward resolution, which in turn reduces the probability that elevated energy costs would reignite inflationary pressures across the broader economy.
The critical nuance is that this sell-off was not driven by a flood of new barrels reaching the market. Iranian crude takes weeks to load, transit, and process. The price fell because fear declined, not because supply materially improved overnight. That distinction carries significant weight when evaluating what happens between now and August 21.
The Strait of Hormuz: A Risk Premium That Cannot Be Fully Dismissed
Iran publicly declared it had closed the Strait of Hormuz, a claim that, if accurate, would disrupt approximately 20% of global seaborne oil trade. US Central Command formally contradicted this, confirming the strait remained fully open and operational throughout the period in question. Furthermore, TVP World reported that the sanctions suspension was tied directly to ongoing peace talks, adding another layer of diplomatic complexity to the situation.
This contradiction is itself a market signal. When a state actor claims to have executed a disruption that verified military sources deny, traders are forced to operate within a dual-reality pricing environment. They must simultaneously discount the Iranian claim as posturing while acknowledging that the capability and intent to threaten Hormuz remain credible.
Why the Hormuz Threat Retains Structural Relevance
Several factors keep Hormuz rhetoric from being entirely dismissed:
- The strait is only 21 miles wide at its narrowest navigable point, making it inherently vulnerable to disruption
- Roughly 17 to 21 million barrels per day of crude and petroleum products transit Hormuz, representing a concentration of seaborne energy flow with no viable alternative route for Gulf producers
- Any credible threat, even one that is ultimately unexecuted, can spike crude futures within hours due to algorithmic trading systems that respond to geopolitical keywords
- With the August 21 expiry creating a defined renegotiation pressure point, any diplomatic deterioration in late July or early August could trigger simultaneous license-expiry anxiety and Hormuz rhetoric pricing
The combination of a hard expiry date and a latent Hormuz threat creates what traders sometimes describe as a convergent risk structure, where multiple independent risk factors share the same trigger date. This dynamic is further amplified by OPEC's market influence, which continues to shape supply decisions around geopolitical developments.
US Petroleum Inventories Reveal a Market with Limited Shock Absorption
The announcement-driven price decline obscures a more troubling underlying condition: US crude inventories are structurally thin across multiple categories simultaneously. This is not a crude-specific story. It is a full-spectrum supply vulnerability.
| Inventory Category | Current Level | Change | vs. 5-Year Average |
|---|---|---|---|
| Commercial Crude Stocks | 418.2 million barrels | -8.3 million barrels | -6% |
| Distillate Inventories | Below 5-year average | +1.0 million barrel build | -13% |
| Refinery Utilisation | 96.7% | Stable | Near operational ceiling |
| Refinery Processing Rate | 17.2 million bpd | Stable | High |
| US Crude Imports | 5.1 million bpd | Stable | Sustained |
| Distillate Production | 5.2 million bpd | Active | High |
The Distillate Deficit Is the More Acute Problem
Crude inventories sitting 6% below the five-year average warrant attention. Distillate inventories running 13% below the five-year average warrant alarm.
Distillates, which encompass diesel fuel, heating oil, and jet fuel, are the functional energy inputs for freight logistics, agricultural machinery, industrial manufacturing, and commercial aviation. A distillate shortage does not just affect pump prices. It constrains the physical movement of goods across supply chains.
The 1.0-million-barrel build in distillate inventories sounds constructive until it is placed against a 13% structural deficit. At current production rates of 5.2 million barrels per day, the pace of inventory rebuilding is insufficient to meaningfully close that gap before August 21.
Refinery utilisation at 96.7% is approaching the practical ceiling for US refining infrastructure. At this utilisation level, there is virtually no operational headroom to increase crude processing and compensate for a sudden supply reduction. The buffer that would normally exist in spare refining capacity has effectively been consumed.
This is the core of the supply vulnerability argument: even if Iranian crude begins flowing under the license, the refining system's inability to meaningfully increase throughput means downstream fuel markets remain exposed.
The Federal Reserve Dimension: When Energy Prices and Rate Expectations Collide
Oil markets do not operate in isolation from monetary policy, and the June 2026 environment makes that interdependence unusually visible. Fed funds futures shifted dramatically in the same week as the license announcement, moving from pricing a 15.2% probability of at least two additional 25-basis-point rate hikes before year-end to a 54% probability, an extraordinary repricing within seven trading days.
This shift reflects how rapidly market sentiment recalibrates when energy price data, inflation expectations, and geopolitical signals converge simultaneously. Lower crude prices reduce near-term inflation pressure, which should theoretically support rate-cut expectations. Yet the market moved decisively in the opposite direction, suggesting traders are pricing in scenarios where the current price softness proves temporary. The broader trade war oil impact on investor sentiment has similarly contributed to this compressed repricing dynamic.
Capital Rotation and Defensive Positioning
Pepperstone's Chris Weston described the environment as one of genuinely turbulent conditions, as investors rotated away from AI-driven growth equities into more defensive asset classes. The broader market impact was measurable:
- The MSCI Asia-Pacific index (ex-Japan) declined 2.9% during the same period
- South Korea's Kospi fell 8.1%, reflecting how economies with significant energy import exposure amplify the volatility of crude pricing decisions made in Washington and Tehran
- Equity markets with high energy cost sensitivity, including transportation, manufacturing, and consumer staples, repriced to reflect the new rate probability distribution
The paradox of the current setup is that lower crude prices ease short-term inflation fears while simultaneously leaving the rate hike probability elevated because investors distrust the durability of that relief. Consequently, the safe-haven market response has been notable, with defensive positioning increasing across multiple asset classes.
The next major ASX story will hit our subscribers first
Scenario Modelling: Three Paths to August 21
Scenario 1: Diplomatic Continuity (Base Case)
The license runs its full course without escalation. Brent holds within the $76 to $78 range observed in late June 2026. Iranian supply flows provide partial offset to the ongoing crude inventory draw. Rate hike expectations stabilise as energy inflation concerns remain contained. This outcome favours fuel-intensive equities, provides relief to freight-dependent businesses, and supports bond markets pricing in eventual policy easing.
Scenario 2: Hormuz Escalation Before Expiry (Bear Case for Crude Consumers)
Iranian Hormuz rhetoric intensifies before August 21, triggering a renewed risk premium. The existing 418.2-million-barrel crude inventory level provides minimal buffer. WTI could revisit the $88.62 per barrel level recorded on June 12 within weeks. Distillate markets, already running 13% below the five-year average, would face the most acute tightening, with immediate downstream consequences for diesel-dependent industries.
Scenario 3: License Extension or Renegotiation
The license is restructured or extended beyond August 21 as part of a broader diplomatic framework. President Trump's stated position, that Iran's use of oil revenues for military rebuilding remains uncertain, leaves this pathway open but unconfirmed. A confirmed extension would likely push Brent toward the lower end of the $74 to $76 range and provide meaningful relief to inflation-sensitive bond markets.
The estimated $14 billion financial value of the 60-day window to Iran creates a powerful short-term incentive for Tehran to maintain compliance during the license period. However, this incentive applies only while the license is active. It provides no behavioural guarantee for the period after August 21.
What the Next EIA Report Will Reveal
The EIA Weekly Petroleum Status Report covering the week ending June 19, 2026 represents the next critical data checkpoint. Two outcomes carry the most market-moving potential:
- If the 8.3-million-barrel crude draw extends into a second consecutive week, it confirms underlying demand is outpacing the license-enabled supply normalisation, strengthening the bear-case scenario for crude consumers
- If the draw partially reverses, it signals that Iranian barrels are beginning to reach US markets and that the license is functioning as intended, supporting the base-case range
Distillate inventory movement will be the more sensitive indicator of the two. A continued deficit despite active production at 5.2 million barrels per day would signal structural tightness that the temporary license alone cannot resolve.
Key Metrics to Track Between Now and August 21
- Weekly EIA crude and distillate inventory changes relative to the five-year seasonal average
- Supertanker tracking data for Iranian crude vessel movements in the Persian Gulf and beyond
- Official US Central Command statements on Strait of Hormuz operational status
- Fed funds futures probability distribution for year-end rate decisions
- Any formal US-Iran communications regarding the post-August 21 sanctions framework
The Geopolitical Limits of a 60-Day Instrument
The temporary structure of the license carries an often-overlooked strategic limitation. Iran cannot build durable long-term infrastructure, establish new trading relationships, or construct financial clearing mechanisms around a 60-day authorisation window. The instrument is too short-lived to allow Iranian oil infrastructure to meaningfully reintegrate with global markets.
This limitation matters for supply analysis because it means the volume of Iranian crude that actually reaches US refiners before August 21 will likely fall well short of the theoretical 140-million-barrel capacity estimate. Supertanker transit times, port loading schedules, and refinery acceptance logistics all compress the practical window considerably.
EU sanctions on Iran also remain independently in place, meaning European buyers cannot participate in the supply normalisation regardless of US Treasury actions. This geographic restriction on Iranian crude buyers further constrains the price-stabilising effect of the license.
President Trump's public refusal to guarantee that Iran would not use oil sale proceeds to fund military activity, expressed as an explicit acknowledgement of uncertainty rather than a policy commitment, reinforces that the post-August 21 environment is genuinely open-ended rather than diplomatically pre-determined.
Five Numbers That Define the August 21 Setup
| Metric | Value | Market Significance |
|---|---|---|
| License Duration | 60 days (June 22 to August 21) | Hard expiry creates a defined catalyst date |
| Estimated Iranian Barrels Unlocked | ~140 million barrels | Meaningful but time-limited supply addition |
| US Crude Deficit vs. 5-Year Average | -6% (418.2M barrels) | Limited buffer against supply disruption |
| Distillate Deficit vs. 5-Year Average | -13% | More acute vulnerability than crude headline |
| Rate Hike Probability Shift (1 week) | 15.2% to 54% | Rapid monetary policy risk repricing |
The Iran 60-day oil license and August 21 oil market catalyst together represent something relatively rare in commodity markets: a known, date-specific risk event with clearly defined upside and downside scenarios, a quantified supply variable, and an unusually transparent set of inventory and refinery data points against which to measure outcomes. Markets do not often provide that degree of structural clarity. The challenge for investors is that clarity about the structure of a risk event is not the same as certainty about its resolution.
This article contains forward-looking analysis, scenario modelling, and market commentary that reflects information available as of the time of writing. Commodity prices, inventory levels, and geopolitical conditions are subject to rapid change. Nothing in this article constitutes financial advice. Readers should conduct independent research and consult qualified financial advisers before making investment decisions.
Want to Stay Ahead of High-Impact Commodity Market Shifts Like This One?
Discovery Alert's proprietary Discovery IQ model delivers real-time alerts on significant ASX mineral discoveries, turning complex market data into actionable insights for both short-term traders and long-term investors — explore historic discoveries that have generated substantial returns or start your 14-day free trial today to position yourself ahead of the next major market move.