
July 22, 2026
The escalating tensions surrounding Iran closes strait of Hormuz in response to US blockade represent a critical juncture in global energy security, with far-reaching implications extending well beyond immediate supply disruptions. Furthermore, the trump tariffs impact on international trade creates additional complexity for nations already struggling with energy supply vulnerabilities. Understanding these dynamics requires examining not just immediate economic impacts, but the deeper structural dependencies that shape modern energy markets.
Geographic Positioning and Strategic Value
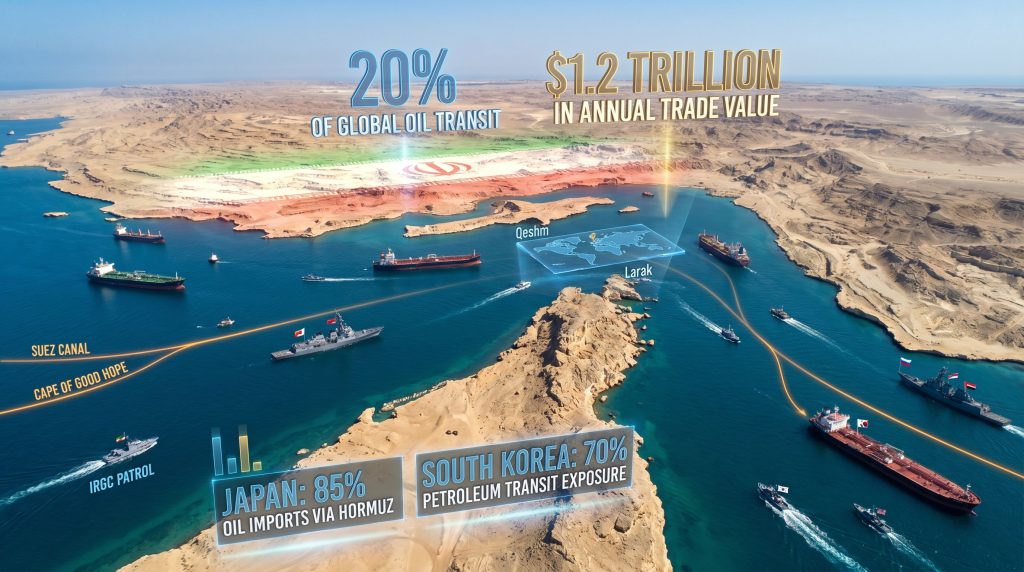
The narrow passage between Iran's Qeshm Island and Larak Island represents one of the world's most strategically significant maritime corridors. This 21-mile-wide channel at its narrowest point controls approximately 20% of global petroleum liquids transit, making it a crucial node in international energy infrastructure. The waterway's strategic importance stems from its role as the primary exit route for oil exports from Kuwait, Saudi Arabia, Iraq, Qatar, and the United Arab Emirates.
Economic Magnitude and Trade Flow Analysis
Annual trade value flowing through this corridor reaches approximately $1.2 trillion, encompassing not only crude oil but also refined products, liquefied natural gas, and petrochemical shipments. The International Energy Agency estimates that roughly 18.5 million barrels per day of petroleum and petroleum products transit this route under normal operating conditions.
Key commodity flows include:
- Crude oil exports: 15.5 million barrels daily
- Refined products: 2.2 million barrels daily
- LNG shipments: 25% of global liquefied natural gas trade
- Petrochemical products: Regional production hub exports
In addition, the oil price trade war dynamics significantly influence how these commodity flows respond to geopolitical tensions and supply disruptions.
Military and Surveillance Infrastructure
Iran maintains comprehensive maritime domain awareness through the Khatam al-Anbiya Central Military Headquarters, which serves as the country's highest operational military command. This organisation coordinates surveillance operations across multiple platforms including shore-based radar systems, patrol vessel networks, and communication interception capabilities.
The Revolutionary Guard Corps operates specialised vessels designed for fast-attack missions and maritime interdiction. These include Seraj-class fast attack craft equipped with anti-ship missiles and mine-laying capabilities, providing Iran with asymmetric naval advantages in the confined waters of the strait.
When big ASX news breaks, our subscribers know first
Iranian Control Mechanisms and Enforcement Protocols
Iran's management of strait transit involves a sophisticated system of vessel tracking, route designation, and authorisation requirements that demonstrates extensive maritime domain control capabilities.
Navigation Channel Specifications
The designated transit route runs between Qeshm and Larak islands, following internationally recognised shipping lanes established by the International Maritime Organisation. However, Iran maintains authority to modify these routes based on security assessments and operational requirements.
| Channel Specifications | Details |
|---|---|
| Minimum width | 21 nautical miles |
| Maximum vessel draft | 25 meters (deep water channel) |
| Traffic separation scheme | IMO-recognised bidirectional lanes |
| Iranian territorial waters | Northern 12 nautical miles |
| Oman territorial waters | Southern 12 nautical miles |
Authorisation and Fee Structure
Recent events demonstrate Iran's implementation of transit authorisation requirements. Parliamentary Speaker Mohammad Bhager Ghalibaf confirmed that passage through the strait would be conducted based on designated routes with Iranian authorisation. Market participants note this could imply continued transit toll collection, though specific fee structures remain undisclosed.
The authorisation process requires:
- Advance notification of vessel arrival and cargo details
- Route compliance with Iranian-designated channels
- Coordination with Iranian naval authorities
- AIS transponder activation for continuous tracking
Vessel Identification and Tracking Systems
Iran employs multiple vessel monitoring technologies including Automatic Identification System (AIS) transponder data analysis and radar surveillance networks. The system can track vessel movements, cargo types, and destination ports, providing Iranian authorities with comprehensive situational awareness.
During the April 2026 crisis, Iranian officials demonstrated precise knowledge of vessel movements, including the FPMC C Lord (301,861 dwt VLCC) and Desh Garima (114,790 dwt Aframax), indicating sophisticated tracking capabilities.
Triggers for Iranian Strait Restrictions
Analysis of recent closure events reveals specific trigger mechanisms that prompt Iranian decisions to restrict strait access.
US Naval Blockade Response Patterns
The April 2026 sequence demonstrates Iranian response patterns to US naval actions:
Timeline of Events:
- April 13, 2026: US initiated naval blockade of Iranian ports
- April 17, 2026: Israel-Lebanon ceasefire triggered Iranian reopening announcement
- April 17, 2026: Trump declared strait "COMPLETELY OPEN" while maintaining blockade
- April 18, 2026: Iran reimposed full restrictions
Parliamentary Oversight and Military Command
Iranian decision-making involves coordination between parliamentary leadership and military command structures. Mohammad Bhager Ghalibaf, who led Iranian negotiations in Islamabad, Pakistan, demonstrated parliamentary authority over strait management decisions through his statement that regulations governing the strait would be determined by field conditions rather than diplomatic announcements.
Lieutenant Colonel Ebrahim Zolfaqari, representing the Khatam al-Anbiya Central Military Headquarters, indicated that restrictions would continue until the US agreed to complete freedom of navigation for vessels travelling to and from Iranian ports.
Ceasefire Agreement Compliance Thresholds
The brief reopening period (April 17-18, 2026) followed the Israel-Lebanon ceasefire agreement, suggesting Iranian responsiveness to broader regional conflict de-escalation. However, the rapid reimposition of restrictions indicates that partial compliance with ceasefire terms was insufficient to maintain transit access.
Iran requires comprehensive resolution of navigation restrictions, not selective implementation of ceasefire provisions, according to military spokesman assessments.
Global Economic Impact Cascades
Strait closures trigger immediate market responses across multiple sectors, with effects propagating through interconnected global supply chains. The tariffs impact on markets compounds these disruptions by creating additional trade barriers that affect energy-dependent industries.
Oil Price Volatility Scenarios
Historical analysis reveals that Hormuz closure announcements typically generate immediate oil price increases of 5-15% within 24 hours, depending on global inventory levels and alternative supply availability. Moreover, detailed oil price crash analysis shows how geopolitical tensions interact with market fundamentals.
Price Response Factors:
- Strategic reserve levels in major consuming nations
- Spare production capacity in non-Gulf producers
- Alternative route capacity utilisation rates
- Seasonal demand patterns and inventory cycles
Shipping Industry Response Patterns
During the April 2026 events, multiple vessel tracking platforms recorded significant behavioural changes:
- Suezmax tankers began idling near strait entrances
- VLCCs bound for Red Sea destinations reconsidered routing options
- Insurance premiums for Gulf operations increased pending clarity on transit terms
BIMCO Chief Security Officer Jakob Larsen noted that mine threat status within the IMO-recognised traffic separation scheme remained unclear, indicating that security assessments drive insurance and routing decisions beyond political announcements.
Supply Chain Disruption Modelling
Market participants reported that the brief reopening announcement appeared aimed primarily at allowing vessels already in the Gulf to exit, addressing vessel availability constraints rather than encouraging new business entry.
Vessel Congestion Impacts:
- Charter rates increase due to reduced available tonnage
- Port congestion develops at alternative loading terminals
- Cargo scheduling disruptions affect refinery planning
- Inventory management strategies shift toward higher stock levels
Regional Dependency Analysis and Strategic Vulnerabilities
Asian economies demonstrate the highest exposure to Hormuz disruptions due to their dependence on Middle Eastern oil imports and limited alternative supply sources. Consequently, Australia's energy exports challenges become more significant as alternative suppliers face increased demand pressures.
Asian Market Dependencies
Japan's Energy Import Profile:
- 85% of oil imports transit through Hormuz
- Strategic reserves: 145 days of consumption (as of 2024)
- Alternative suppliers: Limited by production capacity and shipping costs
South Korea's Petroleum Exposure:
- 70% of petroleum imports via Hormuz transit
- Strategic reserves: 96 days of consumption
- Refinery configurations: Optimised for Middle Eastern crude grades
India's Strategic Considerations:
- Strategic reserve capacity: 39 days of consumption (across 3 facilities)
- Current utilisation: Approximately 85% of capacity
- Alternative suppliers: Russia, Venezuela (limited by sanctions and logistics)
European Market Vulnerability Assessment
European markets demonstrate lower direct exposure due to diversified supply sources, but face indirect impacts through global price mechanisms and refined product imports from Asian refineries.
Key European Vulnerabilities:
- Petrochemical feedstocks from Middle Eastern producers
- Refined product imports from Asian refining centres
- LNG supplies during peak winter demand periods
- Marine fuel availability for shipping operations
North American Strategic Position
The United States maintains Strategic Petroleum Reserve capacity of approximately 714 million barrels (as of 2024), equivalent to roughly 35 days of total petroleum consumption. Canada's strategic reserves and domestic production provide additional North American supply security.
Alternative Transportation Routes and Infrastructure Limitations
When primary transit routes face disruption, global energy flows redirect through alternative pathways with varying capacity constraints and economic implications.
Suez Canal and SUMED Pipeline System
The Suez Canal accommodates vessels up to 240,000 dwt, handling approximately 12% of global seaborne trade. During Hormuz closures, this route experiences increased congestion and higher transit fees.
Suez Canal Limitations:
- Daily capacity: Maximum 106 vessels (both directions)
- Transit time: 12-16 hours depending on convoy scheduling
- Draft restrictions: 20.1 metres maximum
- Beam limitations: 50 metres maximum width
The SUMED pipeline connecting the Red Sea to Mediterranean provides additional crude transport capacity of 2.5 million barrels per day, though this represents only a fraction of typical Hormuz volumes.
Cape of Good Hope Routing Economics
Vessels choosing the Cape route face significant additional costs:
| Route Comparison | Hormuz-Suez | Cape of Good Hope |
|---|---|---|
| Distance (Gulf to Rotterdam) | 6,500 nautical miles | 11,200 nautical miles |
| Transit time | 15-18 days | 24-28 days |
| Additional fuel cost | Baseline | +$850,000 (VLCC) |
| Charter rate impact | Baseline | +65-80% |
Regional Pipeline Alternatives
East-West Crude Oil Pipeline (Saudi Arabia):
- Capacity: 5 million barrels per day
- Route: Eastern Province to Red Sea coast
- Limitations: Serves only Saudi crude, requires Red Sea shipping
Iraq-Turkey Pipeline:
- Capacity: 1.6 million barrels per day
- Current status: Intermittent operations due to security concerns
- Strategic importance: Bypasses Gulf entirely
The next major ASX story will hit our subscribers first
Military Response Frameworks and International Coordination
Hormuz closures typically trigger coordinated international responses involving naval deployments, diplomatic initiatives, and economic countermeasures.
Coalition Naval Capabilities
The Combined Maritime Forces, headquartered in Bahrain, coordinates naval operations across 34 partner nations. Key capabilities include:
- Mine countermeasure vessels for threat assessment and clearance
- Escort operations for commercial vessel protection
- Intelligence surveillance and reconnaissance platforms
- Communication systems for merchant vessel coordination
International Maritime Organisation Protocols
The IMO maintains specific protocols for freedom of navigation disputes, including assessment procedures for traffic separation scheme compliance. During the April 2026 events, the IMO announced it was assessing Iran's announcements for compliance with established navigation frameworks.
Diplomatic Resolution Mechanisms
Historical precedents suggest successful resolution typically requires:
- Third-party mediation by neutral nations
- Graduated sanctions relief tied to transit restoration
- Security guarantees for commercial vessels
- Compensation frameworks for transit delays
Technology and Intelligence Factors in Maritime Domain Control
Modern strait management relies heavily on technological capabilities for vessel identification, threat assessment, and traffic coordination.
Satellite Monitoring and Maritime Domain Awareness
Commercial satellite providers offer near-real-time vessel tracking through:
- Synthetic Aperture Radar (SAR) imagery for all-weather monitoring
- Automatic Identification System (AIS) data collection
- Optical imagery for vessel identification and cargo assessment
- Radio Frequency (RF) signal monitoring for communication patterns
Mine Threat Assessment Technologies
BIMCO's assessment that mine threat status remained unclear within the traffic separation scheme highlights critical technology gaps:
Mine Detection Challenges:
- Bottom mine identification in variable depth conditions
- Influence mine detection requiring specialised magnetic and acoustic sensors
- Mine clearance operations requiring specialised naval units
- Area declaration procedures for certified safe passage
Communication Interception and Naval Intelligence
Iran's ability to coordinate vessel movements suggests sophisticated communication monitoring capabilities, including VHF radio monitoring, satellite communication interception, and cellular signal analysis in coastal waters.
Long-term Strategic Implications and Adaptation Strategies
Recurring Hormuz disruptions drive structural changes in global energy infrastructure and security policies. Furthermore, these events highlight how Iran closes strait of Hormuz in response to US blockade scenarios may become more frequent as geopolitical tensions escalate.
Energy Security Policy Evolution
Strategic Reserve Expansion Programmes:
- India: Planning expansion to 132 million barrels by 2030
- Japan: Considering private sector reserve requirements
- South Korea: Evaluating distributed storage options
- European Union: Reviewing minimum stock obligation levels
Renewable Energy Transition Acceleration
Strait closure risks provide additional momentum for renewable energy development:
- Solar capacity additions in import-dependent nations
- Wind power expansion for electricity generation
- Electric vehicle adoption reducing petroleum demand
- Hydrogen economy development for industrial applications
Regional Alliance Restructuring
Energy security concerns drive new partnership frameworks:
Indo-Pacific Cooperation:
- Quad energy security initiatives (US, Japan, India, Australia)
- ASEAN energy cooperation mechanisms
- Regional petroleum reserve sharing agreements
Atlantic Cooperation:
- US-Europe energy security partnerships
- North American energy integration initiatives
- Strategic petroleum coordination protocols
What Are the Three Most Likely Scenarios?
Strategic planning requires consideration of multiple potential scenarios with varying probability assessments and impact magnitudes.
Scenario A: Extended Closure with Military Escalation
Probability Assessment: 25-30% during active US-Iran tensions
Key Characteristics:
- Duration: 3-6 months
- Military involvement: Coalition naval escorts required
- Economic impact: Global recession risk from sustained $150+ oil prices
- Resolution mechanism: Comprehensive diplomatic settlement or regime change
Market Implications:
- Strategic reserve deployment across multiple nations simultaneously
- Emergency shipping arrangements through alternative routes
- Industrial demand destruction in price-sensitive sectors
- Renewable energy investment surge accelerating transition timelines
Scenario B: Managed Transit with Iranian Oversight
Probability Assessment: 45-50% under current conditions
Key Characteristics:
- Duration: Indefinite but stable
- Transit fees: $500,000-$2,000,000 per VLCC
- Vessel restrictions: Iranian authorisation and routing requirements
- Security provisions: Iranian escort or monitoring
Market Implications:
- Shipping cost increases of 15-25% for Gulf exports
- Insurance premium adjustments for political risk
- Alternative route development for risk diversification
- Long-term supply contract modifications
Scenario C: International Intervention and Reopening
Probability Assessment: 20-25% requiring multilateral coordination
Key Characteristics:
- Duration: 2-4 weeks intervention period
- Military requirement: Combined international naval operation
- Diplomatic framework: UN Security Council authorisation
- Economic cost: $50-100 billion military deployment expense
Market Implications:
- Oil price spike to $200+ during intervention period
- Strategic reserve coordination among allied nations
- Shipping insurance crisis requiring government backstops
- Supply chain reconfiguration lasting 6-12 months
Investment and Trading Strategy Implications
Hormuz disruption scenarios create specific opportunities and risks across energy and related sectors.
Energy Sector Positioning Strategies
Upstream Oil and Gas:
- Non-Gulf producers benefit from supply disruption premiums
- Deepwater projects gain economic viability during price spikes
- Shale oil operations increase production in response to higher prices
- Strategic acreage value increases in politically stable regions
Downstream Refining:
- Complex refineries outside the Gulf region benefit from wider crack spreads
- Product tanker operators experience increased charter rates
- Storage terminal operators benefit from inventory buildup strategies
- Regional refineries gain market share from disrupted competitors
Shipping and Logistics Investment Themes
Vessel Investment Opportunities:
- VLCC and Suezmax tankers benefit from longer voyage distances
- Product carriers benefit from refined product redistribution
- LNG carriers gain from alternative energy source demand
- Dry bulk vessels benefit from increased coal shipments
Infrastructure Development:
- Pipeline projects connecting to non-Gulf sources
- Terminal expansion at alternative loading ports
- Storage capacity development in consuming regions
- Port infrastructure upgrades for larger vessel accommodation
Risk Management and Hedging Strategies
Commodity Exposure Management:
- WTI-Brent spread trading opportunities during disruptions
- Regional price differential arbitrage possibilities
- Refined product crack spread volatility strategies
- Natural gas substitution plays during oil price spikes
Currency and Financial Market Impacts:
- Oil-exporting currencies strengthen during sustained high prices
- Import-dependent currencies weaken under energy cost pressure
- Inflation hedge instruments gain appeal
- Central bank policy responses create interest rate volatility
Investment decisions should consider that geopolitical events create both opportunities and significant downside risks. Market participants should evaluate their risk tolerance and implement appropriate hedging strategies when engaging with energy-related investments during periods of elevated geopolitical uncertainty.
Historical Context and Pattern Recognition
Previous Hormuz closure attempts provide valuable insights into likely duration, resolution mechanisms, and economic impacts of future disruptions.
Tanker War Precedents (1984-1987)
During the Iran-Iraq War, both nations targeted oil tankers in what became known as the "Tanker War." This period offers crucial historical precedents for current scenario planning.
Key Historical Patterns:
- Escalation timeline: Attacks began sporadically, then intensified over 18 months
- International response: Operation Earnest Will provided US naval escorts for Kuwaiti tankers
- Economic impact: Oil prices increased 50-100% during peak conflict periods
- Resolution mechanism: UN-mediated ceasefire in August 1988
Lessons for Current Analysis:
- Coalition coordination proves essential for maintaining commercial transit
- Insurance markets require government backstops during extended conflicts
- Alternative supply sources take 6-12 months to reach full capacity
- Diplomatic resolution typically requires addressing broader regional conflicts
Previous Closure Attempts and Durations
Notable Historical Events:
| Date | Duration | Trigger Event | Resolution Method | Economic Impact |
|---|---|---|---|---|
| 1987-1988 | 14 months | Iran-Iraq Tanker War | UN ceasefire agreement | Oil: +85% peak price |
| 2008 | 3 days | Military exercise threats | Diplomatic de-escalation | Oil: +15% temporary spike |
| 2012 | 2 weeks | Nuclear sanctions escalation | EU diplomatic intervention | Oil: +25% sustained increase |
| 2019 | 1 week | UAE tanker attacks | Regional security talks | Oil: +8% brief increase |
Effective Diplomatic Resolution Patterns
Successful closure resolutions historically involve specific diplomatic mechanisms:
- Third-party guarantees for vessel safety during transit
- Graduated sanction relief tied to specific reopening milestones
- Regional security frameworks addressing broader maritime concerns
- Economic compensation for shipping delays and additional costs
- Monitoring mechanisms to verify compliance with agreements
Economic Recovery Timelines
Market Normalisation Phases:
- Immediate phase (0-30 days): Volatile pricing, strategic reserve releases
- Adjustment phase (1-6 months): Alternative route establishment, supply reconfiguration
- Recovery phase (6-18 months): Price stabilisation, infrastructure adaptation
- New equilibrium (18+ months): Permanent structural changes in supply chains
Investment Recovery Patterns:
Historical analysis shows that energy infrastructure investments made during closure periods typically generate returns 15-25% above baseline levels over 3-5 year periods, as markets price in ongoing geopolitical risk premiums.
Understanding these historical patterns enables more informed assessment of current risks and opportunities in Iran closes strait of Hormuz in response to US blockade, providing context for strategic decision-making across government, corporate, and investment sectors. For comprehensive analysis of related developments, BBC News provides ongoing coverage of the evolving situation in the Middle East.
Want to Capitalise on Energy Market Volatility?
Discovery Alert's proprietary Discovery IQ model delivers instant notifications on significant ASX mineral discoveries, particularly energy-related commodities that often surge during geopolitical crises like the Strait of Hormuz tensions. Position yourself ahead of market movements by accessing Discovery Alert's discoveries page to see how historic mineral discoveries have generated substantial returns during volatile periods, then begin your 14-day free trial to gain immediate market advantages.