
June 15, 2026
How a Narrow Waterway Controls the Price of Nearly Everything
Every barrel of oil has a price. But embedded within that price is something less tangible: a probability. The probability that the supply chain will hold, that the tankers will sail, that the chokepoints will remain open. When that probability shifts, markets reprice instantly, and the effects cascade across equities, currencies, interest rates, and household budgets within hours.
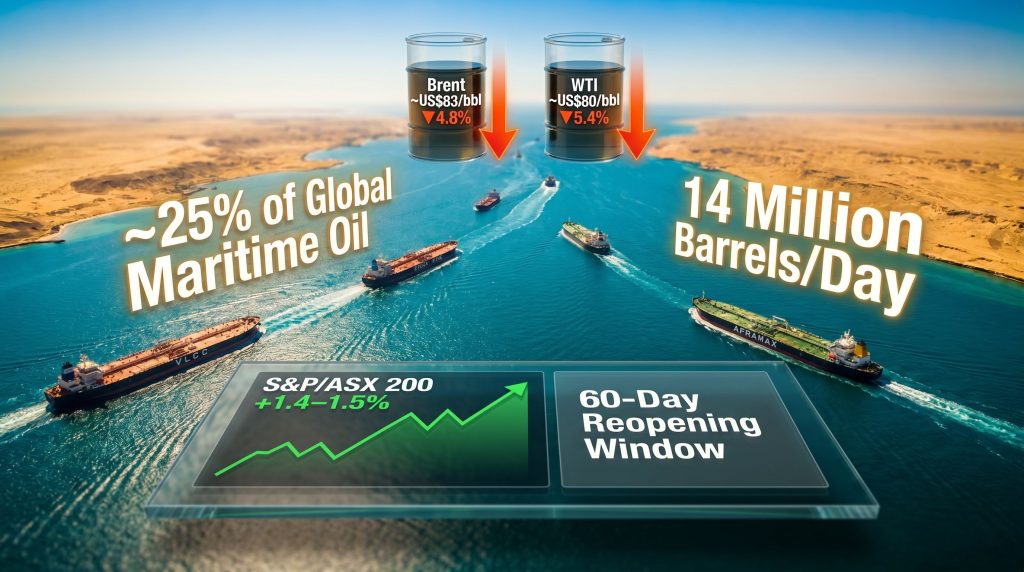
No single location on earth concentrates this dynamic more acutely than the Strait of Hormuz. At its narrowest point, the strait measures roughly 33 kilometres across, yet through this corridor flows approximately 25% of all globally traded maritime oil and around 20% of global LNG trade. For the Gulf producers, there is no practical alternative. The geography is absolute. Closure forces costly and time-consuming detours around the African continent, adding weeks to voyage times and hundreds of millions of dollars in logistics costs.
Understanding how the Iran deal and Strait of Hormuz oil prices became the dominant market narrative of mid-2026 requires understanding this chokepoint not just as geography, but as a pricing mechanism.
When big ASX news breaks, our subscribers know first
What the Geopolitical Risk Premium Actually Measures
Most commodity pricing discussions focus on supply and demand fundamentals. However, in oil markets, a third variable operates continuously: the probability-weighted cost of future supply disruption. Traders and risk desks refer to this as the geopolitical risk premium, and it can be substantial.
The concept works like this: even if today's supply is unaffected, the expectation of future disruption raises present prices. Buyers pay more now to secure supply rather than face shortfalls later. Sellers demand compensation for uncertainty. The result is a structural premium layered above the price that pure supply and demand would otherwise produce.
Historical precedents confirm this pattern:
- During the Iran-Iraq War in the 1980s, the so-called Tanker War saw dozens of vessels attacked in the Gulf, causing repeated oil price spikes even when actual supply volumes remained relatively stable
- The 2019 tanker attacks near the Strait of Hormuz caused Brent crude to jump by more than 14% in a single session before partially retracing as the physical impact proved limited
- Each episode illustrated the same principle: fear prices faster and more aggressively than physical shortage
During the conflict period of early-to-mid 2026, with the Strait effectively closed since early in the year and an estimated 14 million barrels per day of oil transport disrupted, crude oil prices climbed toward US$125 per barrel at peak conflict pricing. That figure was not a reflection of a world running out of oil. It was a reflection of markets pricing the possibility that it might.
Key Insight: A geopolitical risk premium is not a reflection of actual supply shortage. It is a market pricing in the probability of future shortage. When that probability falls, prices correct sharply, often faster than the physical situation warrants.
The US-Iran Framework: What the Agreement Actually Contains
Over a weekend in mid-June 2026, the United States and Iran agreed to a preliminary ceasefire and diplomatic framework. President Trump confirmed the arrangement publicly and directed an end to the US naval blockade of Iranian ports. According to reporting on the Iran peace talks, a formal memorandum of understanding was scheduled for signing in Switzerland on the following Friday.
Several critical details distinguish this from a completed agreement:
- The deal remains an initial framework, not a legally binding instrument
- The proposed structure includes a fragile 60-day reopening window for the Strait of Hormuz
- Key terms including sanctions relief, nuclear concessions, and enforcement mechanisms had not been publicly confirmed at the time of the announcement
- The MOU signing had not yet occurred, leaving the agreement vulnerable to collapse before formalisation
This distinction matters enormously for investors. The market's sharp reaction occurred on the basis of an unratified framework, which means the price moves embed a significant probability that the deal will hold, not a certainty that it has.
How Oil Markets Priced the News
Oil markets are forward-pricing mechanisms. They do not wait for tankers to begin sailing before revising assumptions. Furthermore, the announcement alone was sufficient to trigger a substantial repricing of risk:
| Benchmark | Peak Conflict-Era Price | Post-Announcement Price | Single-Session Move |
|---|---|---|---|
| Brent Crude | ~US$125/barrel | ~US$83/barrel | approximately -4.8% |
| WTI Crude | Above US$120/barrel | ~US$80/barrel | approximately -5.4% |
Early Sunday evening reports captured an initial Brent move of approximately US$5 per barrel before markets fully opened for the week. The final session figure settled around the 4.8% decline. This rapid repricing is consistent with how war premiums behave historically: they deflate in hours because they were built on sentiment, not physical supply changes.
How Cheaper Oil Transmits Through the Economy
The mechanics of lower oil prices reaching consumers and corporate earnings are well understood, but the sequencing matters for investors assessing how durable the broader market rally may be.
The transmission chain operates as follows:
- Crude oil prices fall, reducing input costs for refining and petrochemical industries
- Petrol and diesel retail prices decline within weeks, reducing household transport expenses
- Logistics and freight costs ease across manufacturing, agriculture, and retail supply chains
- Inflation indices, particularly CPI components tied to energy, soften over a 1-2 month lag
- Central banks face reduced pressure to maintain restrictive rate settings
- Lower rate expectations support higher equity valuations through reduced discount rates
- Improved consumer disposable income lifts retail and discretionary spending expectations
This chain explains why the S&P/ASX 200 advanced approximately 1.4-1.5% on the session despite no domestic earnings catalyst. The ASX market response was macro-driven, fuelled by a global risk repricing rather than any improvement in Australian corporate fundamentals.
Analytical Note: When a market rallies on macro risk repricing rather than earnings revision, investors should distinguish between a sustainable re-rating and a sentiment-driven move. The durability depends entirely on whether the underlying catalyst, in this case the diplomatic framework, holds.
ASX Sector Responses: Who Gained and Who Did Not
The session produced a clear bifurcation across ASX sectors:
Beneficiaries:
- Banks and financial stocks attracted strong buying as the interest rate trajectory outlook improved
- BHP (ASX: BHP) and diversified miners led index gains as commodity sentiment improved broadly across the resources complex
- Retail and consumer discretionary stocks responded positively to improved household spending expectations
- Asian equity markets rallied in sympathy, confirming the global rather than domestic nature of the repricing
Under pressure:
- Energy producers faced the sharpest headwinds, as oil price revenue forecasts compressed instantly
- Woodside Energy (ASX: WDS) and Santos (ASX: STO) were the two most prominent names facing selling pressure
- Smaller, more leveraged producers demonstrated the highest negative beta to the move
Understanding the Differentiated Risk Within ASX Energy Stocks
Not all energy companies carry identical exposure to spot oil price movements. The structure of their revenue, their contract terms, and their balance sheet positioning create meaningfully different risk profiles, even within the same sector.
| Company | ASX Code | Revenue Structure | Key Differentiator |
|---|---|---|---|
| Woodside Energy | WDS | Long-term LNG contracts dominant | Contracted revenues provide partial insulation; dividend yield above 5% offers downside buffer |
| Santos | STO | Higher direct oil price exposure | Greater sensitivity to spot price movements; company-specific operational factors add complexity |
| Karoon Energy | KAR | Predominantly spot-exposed | Highest beta to oil price; amplified gains in rallies, amplified losses in corrections |
A detail that many retail investors miss: Woodside's LNG contract structure means that a portion of its revenue is locked in at predetermined pricing for extended periods. This does not eliminate oil price sensitivity, but it dampens the immediate earnings impact relative to pure spot-price producers. Santos occupies a middle position, whilst smaller operators like Karoon represent the most direct leveraged bet on crude.
Investor Caution: A sharp single-session decline in energy stocks does not automatically constitute a value entry point. The critical variable is whether the diplomatic framework holds. If it collapses, energy stocks could recover sharply toward pre-deal pricing. If it holds and physical flows normalise, further compression remains possible.
The Physical Reality Lags the Market Reaction
One of the least discussed aspects of the Iran deal and Strait of Hormuz oil prices dynamic is the gap between diplomatic announcements and physical market normalisation. Markets price possibilities in seconds. Tankers, however, take weeks to reroute.
Even assuming the MOU is signed as scheduled and neither party walks away, concerns about Hormuz turmoil persist, with maritime logistics analysts and insurance specialists flagging several operational obstacles:
- Naval mine clearance in and around the Strait is a technically complex operation that could require weeks to months of coordinated effort
- War risk insurance premiums for vessels transiting the area will remain elevated until physical security is demonstrably established, not merely promised by diplomats
- Tanker routing decisions are made by shipping companies responding to insurer requirements, not by governments. Until insurers lower their premiums, many operators will maintain alternative routes
- Iranian crude production restart timelines represent an additional lag. Even if sanctions relief is confirmed, bringing constrained output back online is not instantaneous
The net effect is that physical supply normalisation is likely to lag the market's reaction by months. This creates a scenario where oil has already priced in restoration of flows that have not yet physically occurred, potentially creating a period of elevated volatility as financial markets and physical markets recalibrate.
The next major ASX story will hit our subscribers first
Three Scenarios for Oil Prices in the Period Ahead
Investors should assign probability weights to at least three credible outcomes rather than treating the current price as a settled equilibrium.
Scenario 1: Deal Holds and Strait Reopens Smoothly
Oil maintains its downward trajectory as the supply risk premium continues to deflate. Brent could test support levels below US$80 per barrel as physical flows begin normalising. Energy stocks remain under sustained pressure whilst the broader market consolidates its gains.
Scenario 2: Deal Signed but Implementation Stalls
The MOU is executed but operational complications, including mine clearance delays, insurer hesitancy, or political friction around sanctions terms, slow physical reopening. Oil stabilises in a volatile range as markets weigh diplomatic progress against physical delays. Energy stocks find a floor while the broader market rally loses momentum.
Scenario 3: Deal Collapses Before or After Signing
A breakdown in negotiations, or a post-signing breach by either party, would see the war premium rapidly reinstated. Oil rebounds sharply, energy stocks recover, and broader equity markets give back a substantial portion of recent gains. This scenario would represent a binary reversal of the entire risk repricing event. The impact on oil markets from such a reversal could be severe, echoing patterns seen during previous geopolitical breakdowns.
The RBA Dimension: Cheap Oil and Australian Rate Dynamics
For Australian investors, the inflation channel connecting global oil prices to domestic monetary policy deserves careful attention. Energy costs flow directly into headline CPI calculations, and petrol prices in particular carry significant weight in the Australian household inflation experience.
At the time of this event, the RBA cash rate sat at 4.35%, with a hold decision widely anticipated by market participants at the June 2026 meeting. The oil price decline does not immediately change that outcome. However, its medium-term implications are more meaningful:
- A sustained decline in global energy prices would reduce petrol and transport cost contributions to Australian CPI within one to two months
- Lower headline inflation readings give the RBA more latitude to consider rate normalisation in subsequent meetings
- Any shift in the rate trajectory has compounding positive effects, supporting equity valuations, property markets, and consumer confidence simultaneously
Consequently, Jerome Powell's inflation projections and broader central bank thinking around energy-driven disinflation are worth monitoring closely alongside RBA communications.
Key Takeaway: The Iran deal's most durable impact on Australian investors may not materialise through energy stocks directly. Its most significant channel may be through the RBA's medium-term rate trajectory over the following six to twelve months.
A Framework for Evaluating Energy Stocks During Geopolitical Transitions
Geopolitical risk repricing events are among the most difficult environments to navigate because the dominant variable is non-financial. Below is a structured approach to thinking through energy stock positioning:
Step 1: Determine the company's revenue exposure to spot oil prices versus contracted rates. Contracted exposure provides a buffer; spot exposure amplifies both upside and downside.
Step 2: Assess balance sheet resilience. Identify whether the company can sustain operations, service debt, and maintain dividends at oil prices in the US$70-80 per barrel range for an extended period.
Step 3: Evaluate dividend sustainability at lower oil price assumptions. For income-oriented investors, a dividend cut triggered by sustained lower oil prices can produce a double compression in share price.
Step 4: Monitor diplomatic signposts systematically. The most important near-term indicators include the MOU signing outcome, tanker movement data through the Strait, maritime war risk insurance premium trends, and Iranian crude production figures.
Step 5: Size positions relative to the binary nature of the outcome. The volatility from tariffs and geopolitical disruptions in this environment means that standard position sizing frameworks may underweight the tail risk on both sides.
Key Metrics at a Glance
| Metric | Value |
|---|---|
| Strait of Hormuz share of global maritime oil trade | approximately 25% |
| Strait of Hormuz share of global LNG trade | approximately 20% |
| Daily oil transport disrupted during conflict period | approximately 14 million barrels |
| Brent crude peak during conflict period | approximately US$125/barrel |
| Brent crude post-announcement price | approximately US$83/barrel |
| WTI crude post-announcement price | approximately US$80/barrel |
| Brent single-session decline | approximately 4.8% |
| WTI single-session decline | approximately 5.4% |
| ASX 200 single-session gain | approximately 1.4-1.5% |
| RBA cash rate at time of event | 4.35% |
| Proposed Strait reopening framework duration | 60 days |
Critical Signposts for Investors to Monitor
The following indicators will determine which of the three scenarios above materialises and how quickly:
- MOU signing outcome in Switzerland: The most immediate binary event. Execution confirms the framework's durability; failure would trigger a sharp reversal across oil and equity markets
- Tanker movement data: Vessel tracking services provide near-real-time evidence of whether physical shipping through the Strait is actually resuming
- Maritime war risk insurance rates: These premium levels are an objective signal of whether professional risk assessors believe the situation is genuinely normalising
- Iranian crude production data: Any measurable increase in Iranian output would represent tangible, physical evidence of sanctions relief and deal implementation beyond the diplomatic layer
- RBA post-meeting communications: Language around global energy price developments within the inflation outlook would signal whether the central bank is factoring the oil move into its rate trajectory thinking
- Brent price trajectory: Sustained trading below US$80 per barrel would indicate market confidence in deal durability. A rebound above US$90 would signal growing scepticism about physical implementation
The Iran deal and Strait of Hormuz oil prices story is not a single-day event. It is, in addition, an evolving diplomatic and logistical process whose financial implications will play out across weeks and months, with multiple inflection points that investors can monitor systematically rather than react to emotionally.
This article is intended for informational purposes only and does not constitute financial advice. Past market behaviour during geopolitical events does not guarantee future outcomes. All scenario analysis involves forecasts and assumptions that may not eventuate. Investors should conduct their own research and consider seeking advice from a licensed financial adviser before making investment decisions.
Want to Stay Ahead of the Next Major ASX Mineral Discovery?
While geopolitical risk premiums reshape oil prices overnight, Discovery Alert's proprietary Discovery IQ model scans ASX announcements in real time, delivering instant alerts on significant mineral discoveries across more than 30 commodities — explore historic discoveries and their extraordinary returns, then begin your 14-day free trial at Discovery Alert to position yourself ahead of the broader market.