June 23, 2026
When Crude Oil Becomes a Diplomatic Instrument
Global oil markets have always responded to geopolitical risk, but rarely do they receive a precise, time-stamped signal that a major supply constraint may be unwinding. The mechanics of sanctions relief are rarely straightforward, and the gap between a temporary authorisation and a structural policy shift can mean the difference between a multi-month price correction and a brief reprieve. Understanding how that distinction plays out in real time is essential for anyone tracking the Iran oil license and oil prices relationship in 2026.
When big ASX news breaks, our subscribers know first
The Architecture of the OFAC Authorisation
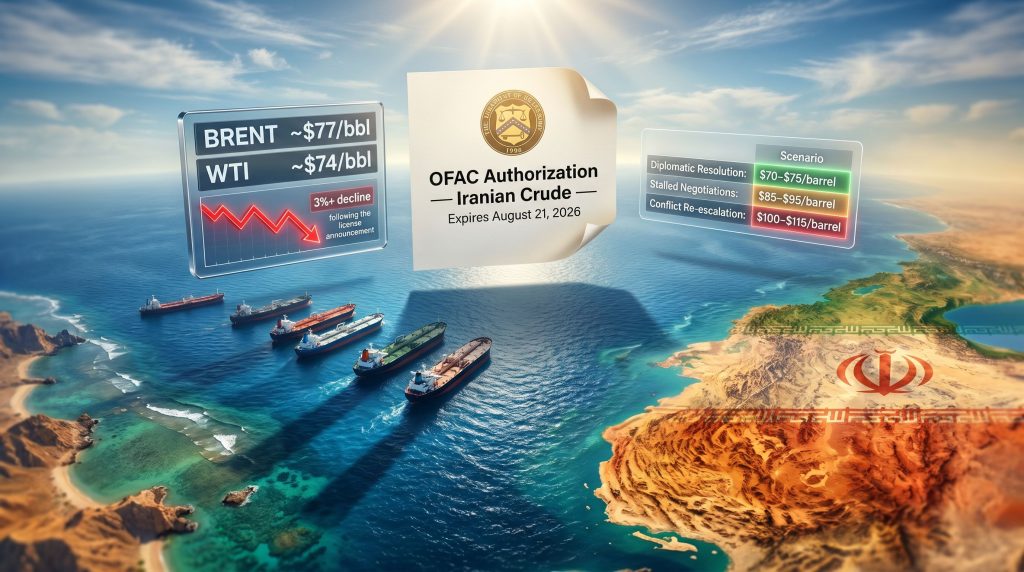
The U.S. Treasury's Office of Foreign Assets Control issued a 60-day license with a scope that extends well beyond a simple export permit. The authorisation covers the full supply chain lifecycle of Iranian crude, including production activity, physical delivery logistics, commercial sale, and, critically, the ability to settle transactions in U.S. dollars.
Throughout the period of reimposed sanctions that began in 2018, Iranian oil continued to flow through informal channels, shadow banking arrangements, and barter-based trade structures that bypassed the dollar system entirely. The reintroduction of dollar-denominated payment mechanisms is not merely a technicality. It transforms the commercial viability of Iranian crude for a much broader pool of institutional buyers who previously could not engage without legal and compliance exposure.
The license expires on August 21, 2026, creating a defined horizon that markets are already pricing into the forward curve. Furthermore, it is worth noting that the geopolitical oil price drivers at play here extend well beyond the licence itself, encompassing broader diplomatic fault lines that remain unresolved.
It is essential to distinguish this authorisation from a permanent sanctions removal. A waiver of this kind is administratively reversible. Its political durability depends entirely on the trajectory of ongoing diplomatic negotiations, and traders have structured their exposure accordingly.
How Oil Prices Have Responded
The Immediate Selloff and Subsequent Stabilisation
The announcement triggered a sharp decline in both major crude benchmarks. Brent crude futures fell more than 3%, settling near $77 per barrel, while West Texas Intermediate declined to approximately $74 per barrel. In early Tuesday trading, Brent recovered marginally to $78.18 and WTI edged up to $74.19, reflecting cautious positioning rather than a full reversal.
The price action reflects a market caught between two competing signals: genuine optimism that a significant volume of Iranian crude is moving toward global buyers, and residual uncertainty about whether diplomatic progress translates into a durable outcome before the licence window closes.
Mapping the Scale of the Price Correction
| Metric | Q1 2026 Peak | Post-License Level | Change |
|---|---|---|---|
| Brent Crude | ~$118/barrel | ~$77/barrel | -$41/barrel (~35%) |
| WTI Crude | ~$115/barrel (est.) | ~$74/barrel | -$41/barrel (~36%) |
| War Premium Status | Fully embedded | Partially unwinding | Ongoing compression |
The scale of the correction from Q1 highs is significant. A roughly 35% decline in Brent from peak levels represents a substantial erosion of the conflict-driven premium that had built into futures pricing over the preceding months.
Decoding the War Premium
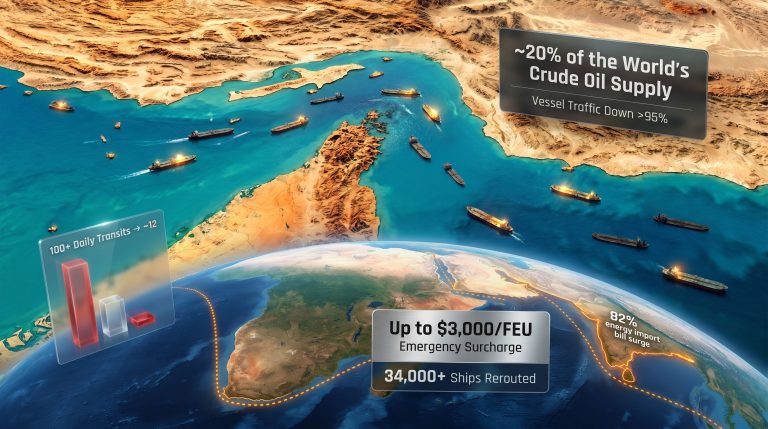
The concept of a war premium in crude oil pricing refers to the speculative risk buffer that market participants embed into forward contracts when conflict threatens to disrupt supply infrastructure or transit routes. The Strait of Hormuz, the narrow waterway between Oman and Iran through which approximately 20% of global seaborne oil supply passes, became the primary geographic focal point for this premium during the Middle East conflict of early 2026.
When conflict escalation risk rises, futures traders price in a probability-weighted cost of disruption. When that risk begins to recede, the premium compresses. The current price trajectory suggests the market is actively discounting a scenario where Hormuz disruption risk continues to fall, though this remains conditional on diplomatic developments.
Scott Chronert, Managing Director of U.S. Equity Strategy at Citi Research, offered a notably direct analytical framework when speaking on CNBC's Squawk Box Asia. His assessment was that the oil price trading pattern observed over recent weeks functions as a real-time signal of conflict resolution probability, with sustained price declines indicating growing market consensus around de-escalation. He further characterised the energy price situation as an overhang with direct inflation implications that appears to be easing across the near-term horizon.
Iranian Supply: Volume, Geography, and Revenue Mechanics
How Much Oil Are We Actually Talking About?
Analyst estimates suggest the authorisation could facilitate the movement of approximately 140 million barrels of Iranian crude into global supply chains over the licence period. To contextualise that figure, global oil demand currently runs at roughly 100 to 103 million barrels per day. The Iranian volume therefore represents a meaningful but not transformational addition to available supply, assuming logistical and buyer infrastructure can absorb it within the timeframe.
The geographic distribution of those barrels is unlikely to be evenly spread. Asian refiners, particularly those in China and India, are expected to absorb the majority of the supply. Both countries maintained informal purchasing relationships with Iranian producers throughout the sanctions period, often through intermediary traders and discounted pricing arrangements. The licence legitimises and streamlines what was previously conducted through workarounds.
The Revenue Equation and Its Political Complications
At elevated crude prices, Iranian oil export revenues were estimated at approximately $139 million per day during high-price periods earlier in the conflict cycle. The ability to now transact in dollars rather than alternative settlement mechanisms represents a material upgrade in both the scale and reliability of those revenues.
This has generated genuine political tension within the U.S. administration. President Trump publicly acknowledged the concern that oil export proceeds could be redirected toward Iranian military reconstruction activity rather than civilian welfare needs. His stated expectation was that revenues would be directed toward food imports for the Iranian population, but no explicit enforcement mechanism for that preference appears to be embedded within the OFAC authorisation itself.
The absence of ring-fenced revenue controls within the licence structure creates a policy monitoring challenge that could become politically significant. If credible evidence emerges that export revenues are being channelled toward military activity, the domestic political pressure to revoke or decline to extend the licence would likely intensify rapidly.
Consequently, OPEC's market influence adds another layer of complexity here, as the cartel's response to Iranian supply re-entering mainstream channels remains a critical variable for price direction.
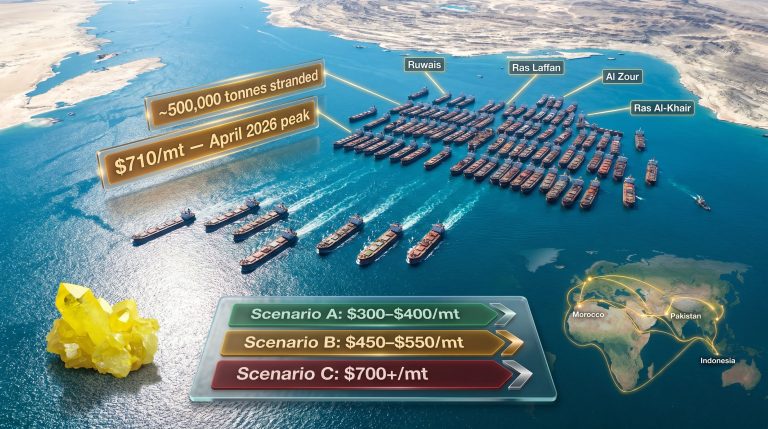
Scenario Analysis: Three Paths for Crude Pricing
The price outlook for Brent and WTI over the coming months is not linear. It branches across at least three meaningfully different scenarios, each driven by a distinct set of diplomatic and operational triggers.
| Scenario | Trigger Condition | Brent Price Range (Outlook) |
|---|---|---|
| Diplomatic Resolution | Full ceasefire + licence extension or new framework | $70–$75/barrel |
| Stalled Negotiations | Licence expires without renewal, no deal | $85–$95/barrel |
| Conflict Re-escalation | Confirmed Hormuz disruption or renewed strikes | $100–$115/barrel |
Forces That Could Extend the Price Relief
- A durable ceasefire agreement emerging from Switzerland-based talks before the August 21 expiration
- OFAC choosing to extend or replace the licence with a broader nuclear deal framework
- OPEC+ maintaining or modestly increasing production targets in parallel, rather than cutting to defend prices
- Continued U.S. Central Command presence ensuring Hormuz transit operational integrity
Forces That Could Reverse the Decline
- A breakdown in ceasefire negotiations triggering renewed hostilities
- Credible evidence of military revenue diversion prompting early licence revocation
- OPEC+ implementing production cuts that absorb Iranian volume additions
- A confirmed Strait of Hormuz closure, which would immediately reinstate the full war premium across the curve
In addition, the broader trade war oil impact remains a background risk factor that could amplify or offset these dynamics depending on how tariff tensions evolve alongside the diplomatic timeline.
The Hormuz Binary: The Market's Single Largest Risk Variable
The conflicting claims about Hormuz status over the weekend preceding the licence announcement illustrate precisely why crude oil traders cannot simply take diplomatic signals at face value. Iran declared the strait closed. U.S. Central Command publicly contradicted that claim.
Commercial vessels and oil tankers were observed holding position in the Gulf of Oman as recently as June 17, 2026, reflecting the operational uncertainty that persists even as diplomatic channels remain active. This positioning behaviour is itself a form of market signal, indicating that shipping operators and cargo insurers are not yet fully convinced that the risk of disruption has passed.
A single confirmed Hormuz closure event would constitute a repricing trigger of the first order. At current demand levels, rerouting tanker traffic around the Cape of Good Hope adds weeks to delivery timelines and hundreds of thousands of dollars to per-voyage costs — effects that would feed directly into physical crude spreads and forward pricing with minimal lag.
The next major ASX story will hit our subscribers first
Inflation, the Federal Reserve, and Energy Disinflation
Why Energy Prices Feed Directly Into Headline CPI
Crude oil sits at the upstream end of an extraordinarily broad cost transmission chain. Transportation fuel, petrochemical feedstocks, agricultural logistics, plastic packaging, and airline ticket pricing all carry embedded crude oil exposure. A sustained decline from the $118 Q1 peak toward the current $74 to $78 range represents a meaningful input cost reduction across each of these categories.
The Federal Reserve's preferred inflation metrics, particularly the Personal Consumption Expenditures price index, do incorporate energy price movements into headline readings. A sustained downward shift in energy prices therefore creates mathematical conditions for headline inflation improvement. However, the Fed inflation outlook suggests that policymakers will require sustained, multi-month evidence before adjusting their rate trajectory in response.
The Limits of Energy Disinflation as a Policy Tool
However, the transmission from lower energy prices to adjusted Fed policy is neither automatic nor immediate. Several important constraints apply:
- Core inflation metrics that exclude food and energy remain the primary policy anchor for the Federal Reserve
- The Fed has consistently indicated that a single input declining does not independently shift its rate trajectory
- Energy price improvements must be sustained and must feed through to core PCE prints before they influence rate expectations materially
- A hawkish policy posture that predates the oil price decline cannot be expected to reverse on the basis of a conditional, time-bound authorisation
If the Iran oil license and oil prices relationship produces durable, multi-month price relief, the disinflationary signal it generates could become one contributing factor among several in the Fed's eventual recalibration calculus. But it is not a standalone policy lever.
How Equity Markets Are Reading the Oil Signal
Price as a Conflict Resolution Barometer
Citi Research's equity strategy team has articulated an investment framework built around using crude oil price behaviour as a forward-looking conflict resolution indicator. The logic is grounded in market microstructure theory: futures prices aggregate the probability-weighted expectations of thousands of informed participants simultaneously. Sustained directional moves in crude therefore carry informational content about consensus conflict probability, not just supply and demand arithmetic.
This framework is particularly useful during periods when diplomatic communications are deliberately ambiguous or tactically contradictory, as they have been throughout the Iran-U.S. negotiations. Furthermore, geopolitical market risks across adjacent commodity classes suggest that the conflict resolution signal embedded in crude pricing may have broader cross-asset implications worth monitoring.
Sector Rotation Implications
The crude price correction carries differentiated implications across equity sectors:
- Energy producers: Declining benchmark prices compress upstream revenue per barrel, creating margin headwinds for exploration and production companies
- Integrated majors: Face dual pressure from lower realised crude prices and potential downstream margin compression as refined product pricing adjusts
- Airlines and freight operators: Input cost relief from lower jet fuel and diesel prices supports a meaningful recovery in operating margins
- Chemical and materials manufacturers: Feedstock cost reduction flows through to improved unit economics across the production chain
- Rate-sensitive equities: If energy disinflation contributes to broader CPI moderation, duration-sensitive assets may benefit from an adjusted rate outlook over the medium term
Frequently Asked Questions
What exactly does the 60-day OFAC oil licence authorise?
The licence issued by the U.S. Treasury's Office of Foreign Assets Control permits the full production, transportation, delivery, and commercial sale of Iranian crude oil, including the ability to settle transactions in U.S. dollars. It expires on August 21, 2026, and represents the most significant opening of Iranian petroleum to mainstream international trade since the reimposition of sanctions in 2018. For further context, Reuters reports that the authorisation marks a notable shift in U.S. energy diplomacy toward Iran.
How large is the potential Iranian supply addition?
Analyst estimates point to approximately 140 million barrels potentially entering global supply chains over the licence window. Asian refiners, particularly in China and India, are expected to be the primary destination markets given pre-existing informal trading relationships with Iranian suppliers.
What happens to crude prices if the licence expires without renewal?
Scenario analysis suggests Brent crude could recover to the $85 to $95 range in a stalled negotiations outcome, and potentially retest the $100 to $115 range if active conflict resumes or Strait of Hormuz disruption is confirmed. The war premium that has partially unwound would likely be partially or fully reinstated.
Does the licence guarantee Iranian crude reaches global markets?
No. Authorisation creates legal and commercial pathway availability, but physical delivery depends on shipping logistics, buyer contract structures, insurance coverage, and the stability of the political environment during the licence window. The distinction between authorisation and guaranteed delivery is important for supply-side modelling. As the Atlantic Council has noted, the Iran oil license and oil prices dynamic hinges heavily on whether waivers translate into sustained market access or remain politically contingent instruments.
Disclaimer: This article contains forward-looking scenario analysis and market commentary that involves assumptions, estimates, and projections that may not be realised. Price forecasts and scenario modelling do not constitute investment advice. Readers should conduct their own research and consult qualified financial advisors before making investment decisions based on commodity price outlooks or geopolitical risk assessments.
Want to Stay Ahead of the Next Major Market-Moving Discovery?
While geopolitical shifts in crude oil markets capture headlines, significant mineral discoveries on the ASX can generate equally compelling investment opportunities — and Discovery Alert's proprietary Discovery IQ model delivers real-time alerts the moment those discoveries are announced, turning complex data across 30-plus commodities into clear, actionable insights. Explore historic examples of exceptional discovery returns or begin your 14-day free trial today to position yourself ahead of the broader market.