June 23, 2026
The Architecture of a Global Chokepoint: Understanding the Strait of Hormuz Shipping Disruption
Every major energy crisis in modern history has ultimately come down to geography. The movement of crude oil and liquefied natural gas is not abstract — it is physical, constrained by waterways, chokepoints, and infrastructure that took decades to build. Of all the pressure points embedded in the global energy system, none carries greater systemic weight than the narrow corridor connecting the Persian Gulf to the Gulf of Oman. When that corridor becomes contested, the consequences ripple through every economy on earth within days, not months.
The Strait of Hormuz shipping disruption that began in earnest on February 28, 2026 has now evolved into something far more structurally consequential than a temporary geopolitical flare-up. It is reshaping how energy is routed, priced, insured, and secured at a global level. Understanding the full dimensions of this disruption requires moving beyond the daily headlines and examining the underlying mechanics, the competing signals, and the scenarios that will determine whether normalisation takes weeks, months, or becomes a permanent reconfiguration of global energy architecture. Furthermore, oil's role in the global economy means that every day of disruption compounds pressure across multiple sectors simultaneously.
When big ASX news breaks, our subscribers know first
A Data-First Assessment: What the Numbers Actually Reveal
The scale of the current disruption is most clearly understood through the operational data, which paints a picture that diplomatic statements have frequently obscured.
| Key Impact Metric | Pre-Crisis Baseline | Current Status |
|---|---|---|
| Daily Tanker Transits | 100+ vessels | Effectively collapsed |
| Total Tankers Transited Since Crisis Began | Normal daily rate | ~21 tankers total at key points |
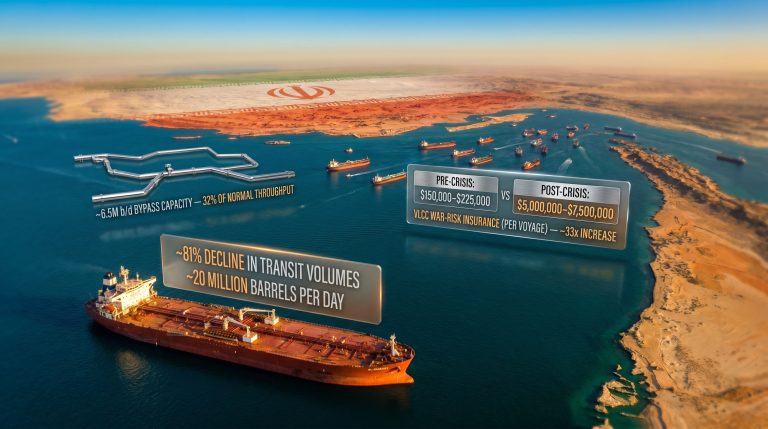
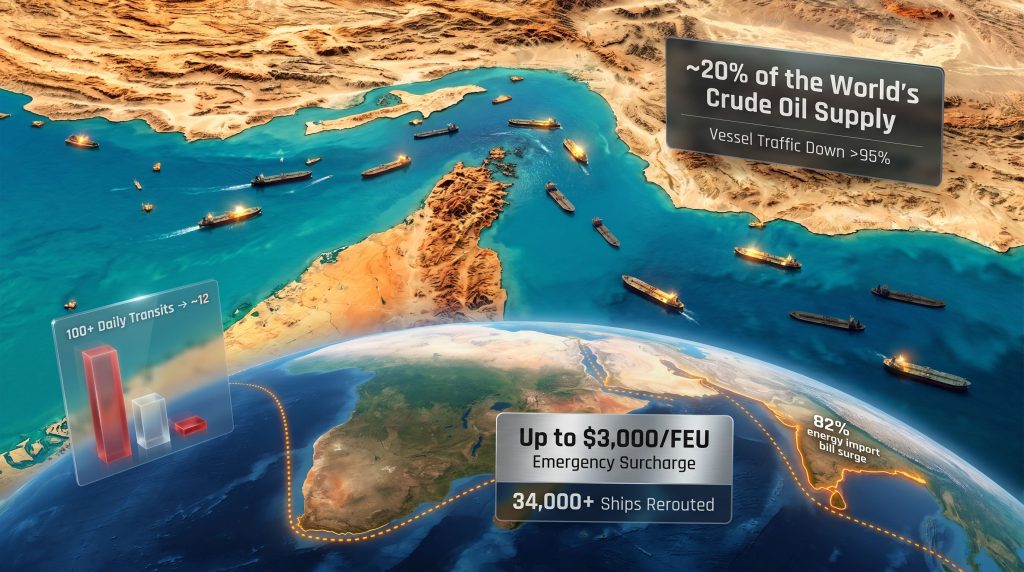
| Vessel Traffic vs. Pre-War Levels | 100% | Down more than 95% |
| Global Crude Oil Supply Impacted | Baseline flow | ~20% of world supply halted |
| Brent Crude Price Response | ~$75–80/bbl | Surged above $90/bbl |
| Container Capacity Trapped | Pre-crisis free flow | Up to 470,000 TEUs affected |
| Container Ships Initially Stranded | None | ~138 vessels in the Gulf |
| Route Diversions Recorded | Standard routing | 34,000+ ships rerouted |
The disruption was triggered by coordinated U.S. and Israeli military strikes against Iranian targets, prompting Iran's Revolutionary Guards to formally declare the strait closed to commercial shipping. The immediate consequence extended well beyond any physical threat to vessels. The declaration triggered the withdrawal of Protection and Indemnity (P&I) war risk insurance across virtually the entire commercial shipping industry, rendering Gulf transit economically non-viable for mainstream operators regardless of whether ships could physically pass through the waterway.
This distinction matters enormously and is frequently underappreciated in coverage of the crisis. The physical navigability of the strait and its commercial viability are two entirely separate conditions. Even when diplomatic agreements suggest the waterway has technically reopened, the insurance market operates on its own independent risk assessment timeline, typically lagging diplomatic agreements by weeks to months.
The Insurance Architecture Breakdown: P&I Withdrawal as the True Gatekeeper
A dimension of the Strait of Hormuz shipping disruption that receives insufficient analytical attention is the structural role of the marine insurance market in determining whether the strait functions commercially.
How the insurance mechanism works in practice:
-
P&I Clubs, which are mutual insurance associations covering third-party liability for shipowners including crew injury, cargo loss, and environmental damage, withdrew war risk coverage immediately upon the Revolutionary Guards' formal closure declaration.
-
Without P&I coverage, shipowners face effectively unlimited liability exposure for any incident occurring during a Gulf transit.
-
Hull and machinery war risk underwriters simultaneously elevated premiums to levels that rendered most voyages commercially unviable even for operators willing to accept elevated physical risk.
-
The result is a structural closure that persists independently of whether Iran physically permits vessels to pass through the waterway.
The physical opening and the commercial reopening of the Strait of Hormuz are two distinct events, separated by the insurance market's independent risk timeline. Normalisation requires both conditions to be satisfied simultaneously, and the insurance market has historically moved on its own schedule.
BIMCO, the world's largest international shipowners' association, noted publicly that the U.S.-Iran Memorandum of Understanding announced in mid-June 2026 left critical operational questions unanswered, including safe routing protocols, traffic sequencing, naval protection procedures, and emergency response frameworks. The concern was not merely political but intensely practical: shipowners needed reassurance that transit was not just permitted but genuinely safe before commercial operators would consider returning. According to UNCTAD's analysis of Hormuz disruptions, the broader implications for global trade and development extend well beyond the immediate energy sector.
The Conflicting Signals Problem: A Messaging War With Real Market Consequences
One of the most destabilising features of the disruption has been the persistent contradictory messaging between Iran and the United States, which has prevented shipping operators, insurers, and energy traders from forming reliable risk assessments.
The core contradiction played out with unusual clarity in the immediate aftermath of the MOU announcement:
-
Iran's position: The strait was re-declared closed within hours of the agreement being announced, citing continued Israeli military operations in Lebanon as justification.
-
U.S. Central Command's position: American military authorities simultaneously asserted that the waterway remained open and functional, citing 55 merchant ship transits carrying more than 17 million barrels of oil in a single day as evidence of normalising traffic.
-
Independent maritime data: Vessel tracking data recorded a sharp decline from 21 transits on Saturday to just 12 transits on Sunday following Iran's re-closure declaration, with neutral and European commercial tonnage entirely absent from the traffic profile.
-
AIS dark mode indicator: Five out of eight inbound vessels recorded during this period were operating without broadcasting their Automatic Identification System signals, a pattern consistent with sanctioned or high-risk operators rather than normalised commercial traffic.
Maritime intelligence data indicated that the MOU-driven recovery that began in mid-June 2026 effectively stalled within 24 hours of its announcement. The traffic profile observed in the immediate aftermath resembled the late-blockade baseline more than a genuinely functioning open strait.
Chubb Ltd chief executive Evan Greenberg characterised the operating environment explicitly as a war zone scenario, emphasising that not all navigational channels through Hormuz were accessible to commercial traffic. Only a single narrow channel was being used for transit at that point, severely limiting throughput capacity. The U.S. Navy was working to clear additional channels, but no firm timeline for broader navigability was established. Consequently, crude oil volatility trends intensified significantly as operators struggled to price risk accurately.
The Rerouting Economy: What 34,000 Ship Diversions Actually Cost
With the strait inaccessible to most mainstream commercial operators, the shipping industry underwent one of its most significant routing restructurings since the Suez Canal crisis of the 1950s.
Route extension impacts:
-
Vessels rerouting via the Cape of Good Hope add between 10 and 14 additional days to Asia-Europe voyages.
-
Each diversion eliminates approximately 2 to 3 vessel rotations per ship annually, compressing effective fleet capacity across affected trade lanes.
-
34,000+ vessels had already diverted routes since the crisis began, with the fourth week of disruption recording the highest single-week diversion volume of the entire period.
Cost escalation across the supply chain:
| Cost Category | Impact |
|---|---|
| Emergency Surcharges | Up to $3,000 per FEU on east-west routes |
| Insurance Premiums | War risk surcharges making Gulf transit economically prohibitive |
| Port Dwell Times | Navi Mumbai import dwell times doubled to 23.47 days |
| Container Rate Trajectory | Significant increases as seasonal demand compounds supply constraints |
The rerouting has not distributed pressure evenly across global port infrastructure. Jawaharlal Nehru Port in Navi Mumbai became the most visibly strained facility, with import dwell times doubling. Meanwhile, Saudi Arabia and Singapore emerged as prominent rerouting and transshipment hubs. The UAE's share of regional maritime traffic declined significantly, dropping from approximately 42.6% to 33.1%, reflecting the collapse of Gulf-originating commercial flows. Thousands of maritime crew members remained anchored on vessels in the Gulf of Oman throughout the crisis, adding a humanitarian dimension to an already complex logistical emergency. For live vessel movement data, Hormuz Strait Monitor provides regularly updated tracking across the waterway.
Which Nations Face the Greatest Exposure?
Not all economies bear equal vulnerability to a prolonged Strait of Hormuz shipping disruption. The most exposed nations share a common profile: high dependence on Gulf crude imports, limited strategic reserve buffers, and constrained access to alternative supply sources.
Vulnerability profile by region:
| Economy | Exposure Level | Key Vulnerability Factor |
|---|---|---|
| India | Very High | Energy import bill surged 82% during peak disruption |
| Japan | Very High | Overwhelming majority of crude sourced from Gulf producers |
| South Korea | Very High | Minimal viable alternative supply routing |
| China | High | Significant Gulf crude dependency, partially offset by Russian supply |
| European nations | Moderate | Pipeline infrastructure mitigates some exposure; LNG import dependency creates vulnerability |
| United States | Lower | Domestic shale production insulates from Gulf supply shocks |
| Canada, Australia | Lower | Net energy exporters; exposed only through global price benchmarks |
India's response has been particularly instructive. Facing an 82% surge in its energy import bill during the peak disruption period, the Indian government ordered a major strategic petroleum reserve expansion directly in response to the supply crisis. India received its first post-deal LNG cargo through Hormuz but signalled clearly that it was not rushing back to Middle Eastern supply dependency. In addition, the disruption has materially altered the global LNG supply outlook, accelerating long-term agreements with alternative producers.
The next major ASX story will hit our subscribers first
The Pipeline Bypass Question: Capacity Versus Reality
The crisis has renewed focus on existing pipeline infrastructure designed specifically to bypass the chokepoint. However, a significant gap exists between theoretical bypass capacity and operational reality.
| Pipeline Route | Operator | Approximate Capacity | Status |
|---|---|---|---|
| Saudi East-West Pipeline (Petroline) | Saudi Aramco | ~5 million bpd | Elevated utilisation; Red Sea terminal constraints |
| UAE Habshan-Fujairah Pipeline | ADNOC | ~1.5 million bpd | Near full utilisation |
| Iraq Syria Oil Route | Iraqi Government | Limited | Retained as strategic alternative |
| Kuwait Gulf Loadings | Kuwait Petroleum | Scaling toward 2 million bpd | Actively expanding |
The critical limitation is arithmetic. Combined bypass pipeline capacity falls substantially short of the 17 to 20 million barrels per day that normally transit Hormuz during periods of normal operations. Even at full utilisation across all available alternatives, bypass infrastructure can replace only a fraction of standard throughput, meaning the global supply deficit cannot be resolved through pipeline alternatives alone.
The Supply Overhang Paradox: 80 Million Barrels and Elevated Prices
Among the most analytically counterintuitive aspects of the disruption is the simultaneous existence of a massive queued supply overhang and persistently elevated oil prices. Approximately 80 million barrels of crude were reported queued and ready to exit the strait as of mid-June 2026, a volume that would normally exert significant downward pressure on Brent crude benchmarks if released rapidly into the market.
The market, however, was simultaneously pricing in ongoing disruption risk, renewed Iranian closure threats, and the structural uncertainty of the MOU framework. The result was a market that appeared bearish on fundamentals but bullish on geopolitical risk premium, creating the price volatility that characterised trading throughout the crisis period. Furthermore, OPEC's influence on oil markets added another layer of complexity, as member nations navigated competing interests between supporting prices and managing their own export constraints.
Goldman Sachs publicly warned that even a formal reopening of the Strait of Hormuz might not restore pre-crisis traffic volumes, suggesting that the disruption was accelerating a permanent architectural shift in global energy routing that could outlast the immediate geopolitical crisis itself. This is perhaps the most consequential long-term implication: that structural routing changes, once embedded in carrier network design, tend to persist even after the conditions that created them have resolved.
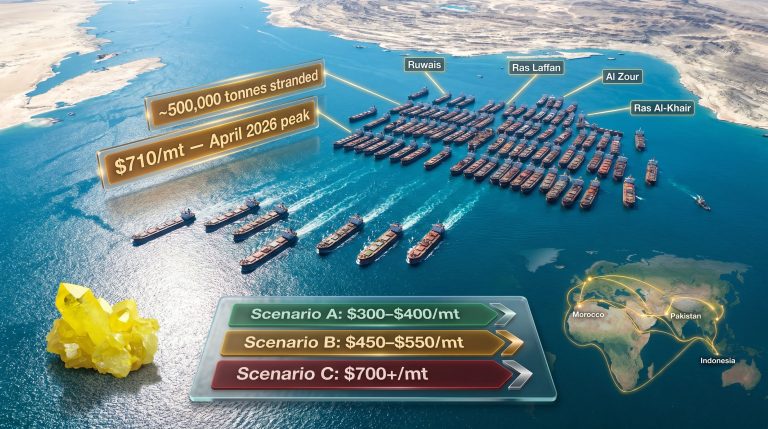
Strategic Scenarios: Three Pathways to Normalisation
Given the complexity of the disruption, single-outcome forecasting is analytically insufficient. The plausible range of outcomes over a 3 to 12 month horizon can be mapped across three distinct scenarios.
Scenario 1: Accelerated Diplomatic Resolution (Estimated probability: 15–20%)
Requires a comprehensive U.S.-Iran agreement with verified implementation, cessation of Israeli operations in Lebanon, full P&I insurance reinstatement, and completion of U.S. Navy channel clearance. Under this scenario, commercial normalisation could occur within 4 to 8 weeks post-agreement, with Brent crude declining toward the $70 to $75 per barrel range. Shipping rate normalisation would likely lag by a further 8 to 12 weeks as fleet repositioning from Cape routes takes time.
Scenario 2: Partial, Contested Reopening (Estimated probability: 50–60%)
The current MOU framework limps forward with intermittent Iranian compliance, limited channel access, and selective transit permissions for non-U.S. flagged vessels. Meaningful traffic recovery would take 8 to 16 weeks, with oil prices continuing to trade in a volatile $80 to $95 per barrel band. Emergency surcharges would remain in place, with Cape routing continuing for European and U.S.-bound cargo while selective Gulf transits resume for Asian-flagged vessels.
Scenario 3: Prolonged Strategic Closure (Estimated probability: 25–35%)
U.S.-Iran talks collapse entirely, Israeli operations expand, or Iran formally institutionalises strait control as a strategic leverage instrument. Under this scenario, disruption extends beyond six months from the initial closure, with Brent crude finding structural support above $90 to $100 per barrel. Permanent rerouting infrastructure investment would accelerate, with the Cape of Good Hope becoming the de facto default routing for Asia-Europe trade.
The Compound Risk Factor: Qatar's Ras Laffan and European Gas Markets
A dimension of the broader regional crisis that has compounded the Strait of Hormuz shipping disruption's impact is the simultaneous pressure on European gas markets. An explosion at Qatar's Ras Laffan LNG facility, combined with ongoing Hormuz threats and regional heatwave conditions, has pushed European gas prices higher at precisely the moment when the continent is most exposed to Middle Eastern supply disruption. Moreover, the trade war impact on oil prices has added further complexity to an already strained pricing environment.
Qatar has moved to restore LNG exports despite the Ras Laffan setback, but the compound nature of these concurrent disruptions illustrates why energy markets are treating the current environment as structurally different from previous geopolitical flare-ups. Multiple supply pressure points are active simultaneously, reducing the system's ability to absorb shocks through alternative routing alone.
This article is intended for informational purposes only and does not constitute financial or investment advice. Scenario probabilities and price projections represent analytical assessments based on currently available information and are inherently subject to rapid change given the fluid geopolitical environment. Readers should conduct their own due diligence before making any investment or commercial decisions based on the information presented.
Want to Stay Ahead of the Commodity Shifts Driving ASX Mineral Discoveries?
When energy disruptions reshape global supply chains at this scale, the flow-on effects for resource and mineral exploration companies can be rapid and significant — and Discovery Alert's proprietary Discovery IQ model scans ASX announcements in real time, instantly identifying high-potential mineral discoveries across more than 30 commodities before the broader market catches on. Start your 14-day free trial at Discovery Alert today, or explore how historic discoveries have generated exceptional returns on the Discovery Alert discoveries page.