July 28, 2026
The Chokepoint That Pays: Understanding Why Iran's Oil Revenues Rise Despite War
Commodity markets have a long memory for chokepoints. From the 1973 Arab oil embargo to the tanker wars of the 1980s, history repeatedly demonstrates that physical control over energy transit corridors creates leverage that transcends conventional military or economic logic. What unfolded in the opening months of 2026 sits firmly within that tradition, yet pushes the paradox further than analysts had previously modelled. When a nation under active military assault, naval blockade, and expanded sanctions manages to increase its daily oil revenue, the standard playbook for economic coercion requires serious reconsideration.
This is precisely what happened when Iran oil revenues rise despite war became one of the defining financial storylines of the 2026 conflict. The numbers are not speculative. They are drawn from tanker tracking services, Bloomberg commodity analysis, and IEA supply assessments, and they point to a structural reality that energy market analysts, geopolitical strategists, and commodity investors cannot afford to ignore.
When big ASX news breaks, our subscribers know first
Before the First Strike: Iran's Export Architecture in Early 2026
To appreciate the revenue paradox, it is necessary to understand what Iran's oil export machine looked like before hostilities began on February 28, 2026. By that point, Iran had spent years engineering a parallel export infrastructure specifically designed to operate outside Western enforcement mechanisms.
The core of this system was a sanctions-hardened shadow fleet, a collection of tankers operating with Automatic Identification System transponders deliberately suppressed, conducting vessel-to-vessel transfers at sea, and moving crude through grey-zone financing channels linked to Islamic Revolutionary Guard Corps-affiliated commercial networks. The destination for the overwhelming majority of this oil, estimated at between 1.1 and 1.9 million barrels per day, was China.
| Metric | Pre-War Baseline (February 2026) |
|---|---|
| Estimated crude export volume | 1.1–1.9 million bpd |
| Primary destination | China (90%+ of total exports) |
| Discount to Brent benchmark | $10–$20 per barrel |
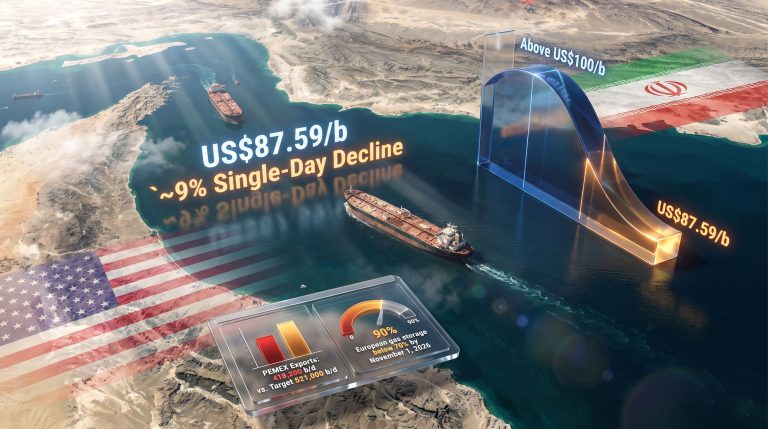
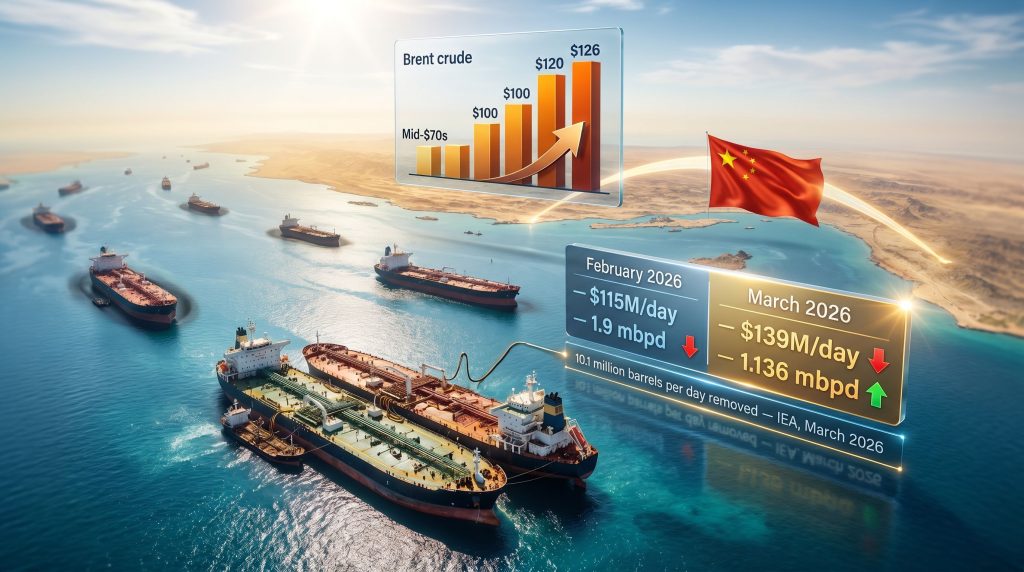
| Estimated daily oil revenue | ~$115 million |
| Sanctions evasion method | AIS-off shadow fleet, STS transfers, grey financing |
Source: Bloomberg, TankerTrackers.com, Kpler data (March 2026), Al Jazeera
Iranian Light crude was moving at a meaningful discount to the Brent benchmark precisely because buyers needed to be compensated for the legal and reputational risk of purchasing sanctioned barrels. At a $10 to $20 per barrel discount, Chinese independent refiners, sometimes called teapot refineries, found the economics sufficiently attractive to accept that risk.
What makes this architecture strategically significant is not merely that it existed, but that it had been stress-tested and refined across more than a decade of escalating Western pressure. By 2026, Iran had effectively built a logistics and financial system immune to the enforcement mechanisms available to Western actors, provided a dominant consuming nation continued to absorb the supply. The broader geopolitical commodity landscape had been shifting in this direction for some time, reshaping how sanctioned producers navigate global markets.
How the Strait of Hormuz Closure Reshaped Global Oil Pricing
The Strait of Hormuz is not simply an important shipping lane. It is the single most consequential maritime chokepoint in the global energy system, through which approximately 20% of the world's traded oil flows on any given day. When Iran effectively closed the strait around March 4, 2026, the disruption was not incremental. It was categorical.
The International Energy Agency estimated that approximately 10.1 million barrels per day came off the global market during March 2026, as GCC producers including Saudi Arabia and Iraq also experienced infrastructure disruptions from Iranian strikes. No supply shock of comparable magnitude had been recorded in modern energy market history.
Brent crude price trajectory following the Hormuz closure:
| Period | Brent Price (Approximate) | Primary Driver |
|---|---|---|
| February 2026 | Mid-$70s per barrel | Baseline sanctions environment |
| Early March 2026 | $90–$100 per barrel | Hormuz closure announcement |
| Late March 2026 | ~$120 per barrel | IEA confirms 10.1 mbpd supply removal |
| April 2026 | ~$126 per barrel | Highest level in four years |
Source: OilPrice.com, Bloomberg commodity desk analysis
The price escalation reflected not just the immediate supply removal but the forward-looking risk premium that markets attached to an uncertain reopening timeline. Traders and refiners, facing the prospect of months without reliable access to Gulf crude, bid aggressively for available Atlantic Basin and North Sea barrels, further compressing the availability of alternative supply and amplifying the price signal.
Furthermore, understanding the interplay between oil prices and geopolitics is essential here. A critical but underappreciated dynamic involves what economists describe as inelastic demand. Crude oil, particularly for industrial economies with limited short-term substitution capacity, exhibits very low price elasticity in the short run. Refineries cannot simply switch feedstocks overnight. This means that when supply contracts sharply, the price response is disproportionately large relative to the volume removed.
The Revenue Paradox: Fewer Barrels, More Dollars
The counterintuitive core of this story lies in the arithmetic of what happened to Iran's revenue when its physical export volumes fell sharply. According to UANI tanker tracking data for March 2026, Iranian crude exports averaged approximately 1.136 million barrels per day, representing a roughly 45% decline from the February baseline.
Standard economic intuition suggests revenue should have fallen proportionately. It did not.
| Metric | February 2026 | March 2026 | Change |
|---|---|---|---|
| Physical export volume | ~1.9 mbpd | ~1.136 mbpd | -45% |
| Estimated monthly export value | ~$4.27 billion | ~$3.63 billion | -15% |
| Estimated daily oil revenue | ~$115 million | ~$139 million | +$24 million |
| Brent crude price | Mid-$70s per barrel | ~$120 per barrel | +60%+ |
Source: UANI tanker tracking, Bloomberg, TankerTrackers.com, Kpler data (March 2026)
The mechanism driving this outcome is what can be described as discount compression. Under normal sanctioned-state trading conditions, Iranian crude was penalised by a substantial discount to Brent. As the Hormuz closure removed Gulf supply from global markets and drove benchmark prices sharply higher, the absolute discount became less meaningful to Chinese buyers who now faced severely constrained alternatives. The effective per-barrel realisation for Iranian crude moved toward benchmark pricing in practical terms, even if the nominal discount structure remained in place.
Iran's estimated daily oil revenue rose to approximately $139 million in March 2026, up from $115 million in February, even as physical export volumes declined by roughly 45%. The surge in per-barrel realisation more than offset the volume loss, according to analysis from Bloomberg and OilPrice.com.
The result was that Iran sold fewer barrels but extracted dramatically more value from each one. With Gulf Cooperation Council exporters locked out of global markets by the same disruption Iran had engineered, Tehran temporarily held an asymmetric advantage in the one commodity on which the global economy remained structurally dependent. As reported by OilPrice.com, this volume-down, revenue-up dynamic defied nearly every standard model of wartime economic coercion.
China's Role as the Strategic Demand Anchor
The revenue paradox could not have materialised without a buyer both willing and structurally capable of absorbing Iranian crude at scale. China fulfilled both requirements simultaneously.
By the time the 2026 conflict began, China had already become the dominant consumer of Iranian oil, accounting for more than 90% of total Iranian crude exports. This relationship was not merely commercial. It represented a strategic alignment in which Beijing had invested substantial logistical and financial infrastructure to ensure the supply chain remained functional regardless of Western pressure.
Chinese state authorities directed domestic refiners to continue purchasing Iranian crude without regard to U.S. sanctions targeting buyers, according to reporting from OilPrice.com. This directive was backed by China's deployment of its own vessel networks, alternative payment infrastructure operating outside SWIFT-connected banking systems, and refinery integration specifically designed to process Iranian crude grades.
Three structural factors made China's absorption capacity decisive:
- Vessel ownership architecture: Chinese state-affiliated tanker fleets provided transportation capacity outside the reach of Western insurance and flag-state enforcement
- Payment channel alternatives: Transactions settled outside conventional Western banking networks, eliminating the primary enforcement lever available to U.S. Treasury sanctions administrators
- Refinery configuration: Chinese industrial refineries, particularly independent teapot operators, had been processing discounted Iranian crude for years and possessed the technical capability to continue at scale
When petroleum products and feedstocks are included alongside crude oil, total Iranian exports through this system reached an estimated 2.8 million barrels per day at their peak during the conflict, according to reporting by The Economist on March 29, 2026. This figure underscores the degree to which China's industrial appetite for discounted hydrocarbons had created a structural floor beneath Iranian export revenues that no naval blockade could easily eliminate.
Russia and Beijing both benefited from the elevated price environment created by the Hormuz disruption, as higher benchmark pricing supported revenues from their own export programmes. This alignment of financial interests created a geopolitical context in which neither major power had strong incentive to support the reopening of the strait on terms favourable to Western consumers. The ongoing US-China trade war further complicated Western efforts to apply coordinated diplomatic pressure on Beijing over its continued absorption of sanctioned barrels.
How Iran's Shadow Fleet Defied the Naval Blockade
Perhaps the most underappreciated dimension of Iran's revenue resilience involves the operational durability of the export infrastructure it had constructed over years of sanctions pressure. A naval blockade, in conventional strategic thinking, severs an adversary's access to export markets by physically controlling sea lanes. Against a standard merchant fleet operating through declared routes with transparent documentation, this approach is highly effective.
Iran's shadow fleet was not a standard merchant fleet.
The vessels involved operated with transponders disabled, preventing real-time tracking through publicly available AIS data. Ship-to-ship transfers conducted in international waters obscured cargo origins, making chain-of-custody documentation effectively untraceable through conventional customs and compliance systems. IRGC-linked commercial networks handled the financial dimensions through channels that circumvented Western banking controls.
Crucially, while Kharg Island, Iran's primary crude export terminal responsible for handling the large majority of Iranian oil exports, sustained damage during the conflict, the infrastructure proved more resilient than pre-war assessments had suggested. Reporting from OilPrice.com noted that no party appeared to have a strong incentive to render Kharg Island permanently non-operational, a strategic restraint that reflected the mutual financial interest in maintaining some level of Iranian crude flow to Asian markets.
The damage to Iranian export infrastructure, while significant, proved less operationally disruptive than pre-conflict modelling had projected. The redundancy built into Iran's export system across decades of sanctions pressure provided resilience that conventional military planning did not fully account for.
The next major ASX story will hit our subscribers first
Three Scenarios for Iran's Revenue Trajectory
Forward-looking analysis of Iran's oil revenue position requires acknowledging that outcomes depend heavily on variables that remain in flux. The following scenarios represent analytical frameworks rather than forecasts, and investors and analysts should treat all forward projections in this domain with appropriate caution given the inherent unpredictability of military conflict and diplomatic negotiation.
Scenario 1: Prolonged Hormuz Disruption (Base Case)
- Brent crude remains above $110 per barrel
- Iranian export volumes stabilise in the 1.0–1.3 mbpd range
- Daily revenues hold in the $120–$145 million range
- China continues absorbing the full available supply at near-benchmark pricing
Scenario 2: Negotiated Partial Reopening (Moderate Case)
- Hormuz partially reopened under international mediation pressure
- Brent retreats to the $85–$95 per barrel range as alternative supply re-enters the market
- Iranian volumes recover toward approximately 1.5 mbpd
- Revenue normalises toward pre-war levels of approximately $115 million per day
Scenario 3: Full Escalation and Infrastructure Destruction (Tail Risk)
- Kharg Island rendered non-operational through sustained strikes
- Iranian export capacity collapses below 500,000 barrels per day
- Brent spikes toward $140+ before demand destruction moderates the price
- Iran's revenue collapses despite extreme per-barrel pricing, as insufficient volume exists to generate meaningful total revenue
The third scenario represents the outcome that sanctions architects and military planners may have originally anticipated. The fact that it had not materialised through the early months of the conflict reflects both the strategic restraint of attacking parties and the structural entrenchment of Iran's export infrastructure.
The Broader Market Architecture: Who Else Benefited?
The Hormuz disruption did not affect only Iran's revenue position. It reshaped the economic calculus for every sanctioned or partially-sanctioned hydrocarbon producer with access to Asian markets.
| Sanctioned Producer | Pre-Crisis Export Volume | Crisis-Period Export Volume | Price Environment |
|---|---|---|---|
| Iran | 1.1–1.9 mbpd | ~1.136 mbpd (crude only) | +60%+ per barrel vs. February |
| Venezuela | ~800,000 bpd | Seven-year export high | Elevated benchmark pricing |
| Russia | Ongoing Asian export diversion | Continued sales to India, China | Elevated Urals differential pricing |
Source: OilPrice.com, Venezuela oil ministry reporting
Venezuela's export volumes reached a seven-year high during the crisis period, as elevated benchmark prices made previously marginal barrels economically viable and buyers diversified away from disrupted Gulf supply. Russian crude sales to Asian markets continued largely uninterrupted, with the elevated Brent benchmark lifting the absolute revenue per barrel even where percentage discounts remained. The trade war impact on oil markets had already conditioned these dynamics well before the conflict began.
The IEA's assessment of 10.1 million barrels per day removed from global supply during March 2026 now functions as a structural reference point for future crisis modelling. It establishes the upper bound of what a single chokepoint can deliver in terms of supply shock magnitude, and it will inform scenario planning for energy security analysts, central banks, and commodity trading desks for years ahead.
A separate but consequential development involved strategic reserve drawdowns across the Asia-Pacific region. Nations including Japan, South Korea, and India activated emergency release mechanisms to bridge supply shortfalls, temporarily suppressing some of the price pressure but simultaneously depleting strategic buffers that would require months to replenish regardless of when the Hormuz situation resolved.
The Gap Between Regime Revenue and Economic Welfare
A critical distinction separates Iran's oil revenue performance from the economic welfare of ordinary Iranian citizens, and conflating the two leads to fundamental misunderstandings of what the revenue data actually implies.
The export earnings flowing through Iran's shadow fleet architecture move predominantly through IRGC-affiliated commercial networks. The opacity that makes this infrastructure resistant to Western sanctions on oil trading enforcement also makes it effectively opaque to the Iranian civilian economy. Oil revenue gains at the regime level do not automatically translate into fiscal expenditure on public services, consumer subsidies, or economic stabilisation measures.
What ordinary Iranians experienced during the early war period included:
- Accelerating inflation driven by currency depreciation and supply chain disruption
- Domestic fuel and commodity shortages exacerbated by export prioritisation
- Contraction in private sector activity as conflict uncertainty suppressed investment
- Erosion of purchasing power that proceeded independently of export revenue performance
The revenue figures cited throughout this analysis should therefore be understood as metrics of regime financial capacity rather than indicators of national economic health. The same structural opacity that enables sanctions evasion ensures that the civilian transmission of export revenues remains structurally limited.
There is also a longer-term geological constraint that adds a structural ceiling to Iran's export ambitions regardless of geopolitical outcomes. Iran's major producing fields, particularly Ahvaz, Marun, and Gachsaran, are mature assets with natural decline rates that years of underinvestment and sanctions-related technology restrictions have accelerated. The country's ability to sustain, let alone increase, its export capacity over a multi-year horizon faces constraints that no amount of per-barrel price appreciation can permanently resolve.
Rethinking Economic Coercion Against Chokepoint-Adjacent Producers
The 2026 Iran experience reveals a fundamental tension at the heart of economic warfare strategy that deserves explicit acknowledgment. The standard model of sanctions and blockade assumes that restricting a commodity exporter's access to markets reduces both volume and revenue simultaneously, degrading the financial capacity of the targeted regime.
This model functions reasonably well when the targeted producer is price-taking, geographically isolated, and lacks a dominant consuming partner willing to circumvent enforcement mechanisms. Iran in 2026 satisfied none of these conditions.
Instead, Iran's geography placed it in physical control of a chokepoint whose disruption amplified the per-unit value of the very commodity it was being prevented from selling in quantity. The same act of military escalation that reduced Iran's physical export volumes simultaneously increased the benchmark price against which its remaining barrels were valued. Consequently, the disruption that was intended to be financially punishing became, in its early months, financially advantageous — a dynamic that analysts at TipRanks noted was without clear modern precedent in wartime commodity markets.
This outcome does not mean that sanctions and blockades are ineffective instruments under all circumstances. It means that against chokepoint-adjacent, sanctions-hardened producers with a committed dominant buyer, the revenue consequences of conflict are far more complex than linear volume-reduction models suggest.
For energy market analysts and investors, the practical implication is clear: modelling the financial impact of conflict on commodity-exporting nations requires explicit price-response assumptions, not just volume-disruption assumptions. When those two variables move in opposite directions with sufficient magnitude, the revenue outcome can invert conventional expectations entirely. Iran oil revenues rise despite war is not merely a 2026 headline; it is a case study that will reshape how strategists and investors model chokepoint-adjacent conflict scenarios for a generation.
Frequently Asked Questions: Iran Oil Revenues and the 2026 Conflict
Why did Iran's oil revenues rise despite the war?
Iran's revenues increased because the global crude price surge, driven by the Strait of Hormuz closure and the removal of an estimated 10.1 million barrels per day from world markets, more than offset the decline in Iran's physical export volumes. Fewer barrels were sold, but each barrel generated significantly more income per unit. The discount compression effect, whereby Iranian crude moved closer to benchmark pricing as Chinese buyers faced severely constrained alternatives, further amplified the per-barrel revenue gain.
How much was Iran earning from oil during the conflict?
Analysis from Bloomberg and tanker tracking services placed Iran's estimated daily oil revenue at approximately $139 million in March 2026, compared to roughly $115 million in February, representing a gain of approximately $24 million per day despite a 45% reduction in export volume.
How did Iran continue exporting oil during a U.S. naval blockade?
Iran maintained export flows primarily through its established shadow fleet infrastructure, comprising vessels operating with AIS transponders disabled, using ship-to-ship transfers, and moving crude through IRGC-linked financial channels. China served as the primary buyer, absorbing the majority of available supply through its own vessel networks and payment infrastructure outside Western banking systems.
What happened to global oil prices after the Strait of Hormuz closed?
Brent crude rose from approximately the mid-$70s per barrel before the conflict to around $120 by late March 2026 and approximately $126 in April, the highest level in four years, as markets priced in the largest supply disruption in modern energy market history.
What is the difference between Iran's oil revenues and Iran's economic health?
Iran's oil revenues, concentrated within IRGC-affiliated export networks, do not directly translate into broader civilian economic wellbeing. Ordinary Iranians face ongoing inflation, currency depreciation, and supply disruptions that persist regardless of export revenue performance at the regime level. The opacity that enables sanctions evasion simultaneously limits the civilian transmission of oil export income.
Disclaimer: This article contains forward-looking scenarios and analytical projections that involve significant uncertainty. Nothing in this article constitutes investment advice. All revenue estimates are derived from third-party tanker tracking and commodity analysis services and should be treated as approximations subject to revision. Readers should consult independent financial and geopolitical analysis before making any investment decisions related to energy markets or geopolitical risk.
Want To Catch The Next Major Commodity Discovery Before The Market Does?
When geopolitical shocks send commodity prices surging, the investors best positioned are those already holding exposure to significant discoveries — and Discovery Alert's proprietary Discovery IQ model delivers real-time ASX mineral discovery alerts, turning complex market signals into clear, actionable opportunities. Explore why historic discoveries have generated extraordinary returns and begin your 14-day free trial today to ensure you're ahead of the next major market move.