July 26, 2026
Sanctions, Shadow Fleets, and the Strait: Understanding How Iran Sold $18 Billion of Oil During War and Ceasefire
The global oil market has long operated under a fundamental assumption: that sufficiently aggressive sanctions and military pressure can choke off a major producer's export capacity, ultimately forcing a recalibration of state behaviour. History keeps complicating that assumption. From the Soviet gas trade during the Cold War to Venezuela's continued crude exports under waves of US pressure, the pattern repeats itself. Heavily sanctioned oil producers rarely go dark entirely. Instead, they adapt, discount, and reroute. The latest chapter in this recurring story involves Iran, a declared blockade, and an $18 billion revenue figure that has forced analysts to revisit some basic assumptions about how energy economics actually functions under wartime conditions.
When big ASX news breaks, our subscribers know first
The Revenue Breakdown That Surprised the Market
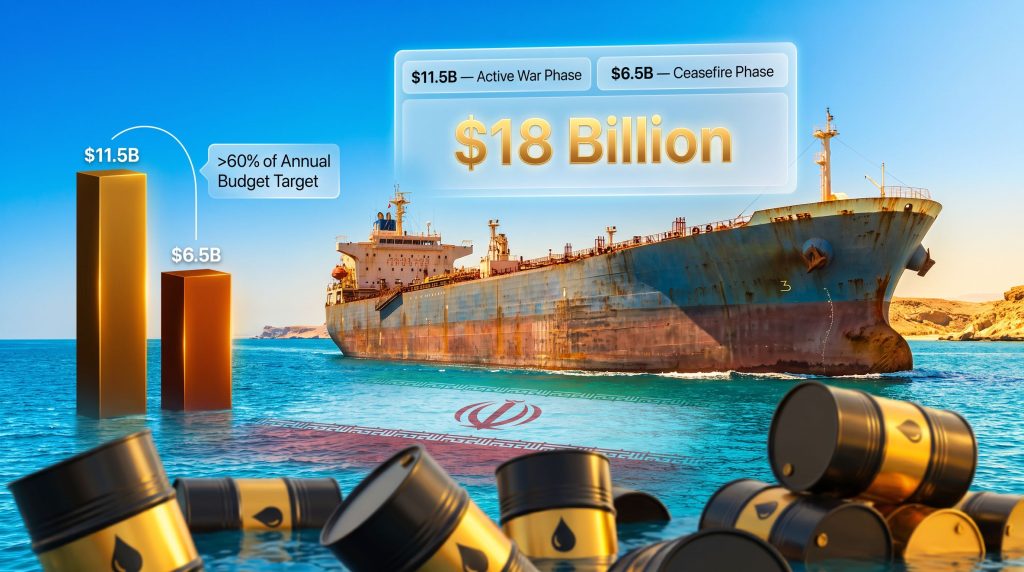
Iran's oil ministry disclosed in late July 2026 that the country had generated a combined $18 billion in oil revenues across two distinct phases: the active conflict period and the subsequent ceasefire. Breaking this figure down reveals something counterintuitive at the heart of the story.
| Period | Oil Revenue | Key Conditions |
|---|---|---|
| Active War Phase | $11.5 billion | US blockade declared on Iranian ports |
| Ceasefire Phase | $6.5 billion | Partial trade corridor resumption |
| Total Combined | $18 billion | Exceeded 60% of annual budget forecast |
The ministry noted that this combined figure represented more than 60% of the oil revenues projected in Iran's national budget for the year, achieved during what the government itself described as a period of acute crisis. If Iran's annual oil revenue target sits in the vicinity of $28 to $30 billion, then the wartime and ceasefire figures together leave a gap of roughly $10 to $12 billion to be recovered through whatever export pathways remain operational.
What makes this breakdown analytically significant is not just the total, but the distribution. The war phase generated nearly double the revenue of the ceasefire phase. This runs against the intuitive expectation that a pause in hostilities would accelerate economic recovery. The explanation lies in how grey-market oil trade actually functions under extreme geopolitical pressure.
Furthermore, according to Iran's oil ministry, Iran sold $18 billion of oil during war and ceasefire conditions that many analysts had assumed would be far more economically crippling. The resilience of these revenues has prompted a significant reassessment across energy policy circles.
How the Shadow Fleet Economy Works
The Infrastructure Behind Sanctioned Oil Trade
Understanding how Iran sold $18 billion of oil during war and ceasefire requires understanding the infrastructure that makes sanctioned crude trade possible in the first place. This is not a new system, and it is far more sophisticated than casual media coverage typically suggests.
The architecture of sanctioned oil trade involves several interlocking mechanisms:
- Ship-to-ship transfers conducted in international waters, where cargo is moved between vessels to obscure the origin of the crude before it reaches a buyer's port.
- Flag-of-convenience registrations, where tankers operate under the flags of nations with limited enforcement capacity or willingness to comply with US-led sanctions frameworks.
- Intermediary trading hubs in jurisdictions that maintain political neutrality or face insufficient secondary sanctions pressure to enforce compliance.
- Document alteration and cargo blending, where Iranian crude is mixed with oil from other origins to make traceability harder at the refinery gate.
China remains the dominant destination for discounted Iranian crude under sanctions cycles. Independent Chinese refineries, commonly referred to in the industry as teapot refiners, operate largely outside the compliance structures that govern major state-owned or publicly listed refining companies. These facilities have historically absorbed significant volumes of Iranian crude, particularly when discount levels are attractive enough to offset reputational or secondary sanctions risk.
The wartime context likely widened Iranian crude discounts significantly beyond normal sanctions-era levels. When official pricing benchmarks are disrupted by active conflict, opportunistic buyers gain leverage, and sellers facing blockades must offer deeper concessions to move volume.
Iranian crude is typically offered at discounts ranging from $5 to $15 per barrel below Brent under standard sanctions conditions. During active conflict and declared blockades, that spread may widen further, creating a buyer's market for non-aligned purchasers who are willing to absorb compliance exposure in exchange for materially lower feedstock costs. These oil price movements reflect the broader pressures reshaping global energy trade in an increasingly fragmented geopolitical environment.
Why the War Phase Outperformed the Ceasefire Period
The gap between the $11.5 billion war phase figure and the $6.5 billion ceasefire figure is worth examining carefully, because it reveals something important about the timing dynamics of grey-market energy trade.
Several analytical frameworks help explain this pattern:
- Pre-positioned export contracts: Iranian oil traders likely secured forward sales agreements before the conflict intensified, with delivery and payment windows that fell within the war phase even if the commercial terms were agreed earlier.
- Buyer urgency during peak uncertainty: When supply disruption risk is highest, price-sensitive buyers accelerate purchases to build strategic stockpiles. Wartime conditions create urgency that ceasefire conditions remove.
- Enforcement dynamics: Blockade enforcement is rarely uniform. Early in a declared blockade, gaps in naval coverage, diplomatic ambiguity, and logistical lag may leave corridors temporarily accessible. These windows can generate significant revenue before enforcement tightens.
- Ceasefire disruption: The period following the ceasefire may have seen trade routes disrupted not by blockade enforcement, but by the physical damage to port infrastructure, insurance market withdrawal from Iranian voyages, and tightened third-party compliance reviews triggered by global attention on the conflict.
The Strait of Hormuz: Why Geography Gives Iran Asymmetric Leverage
The conflict's renewal in early July over the Strait of Hormuz highlights the structural reality that underpins Iran's negotiating position in any energy-related confrontation with Western powers.
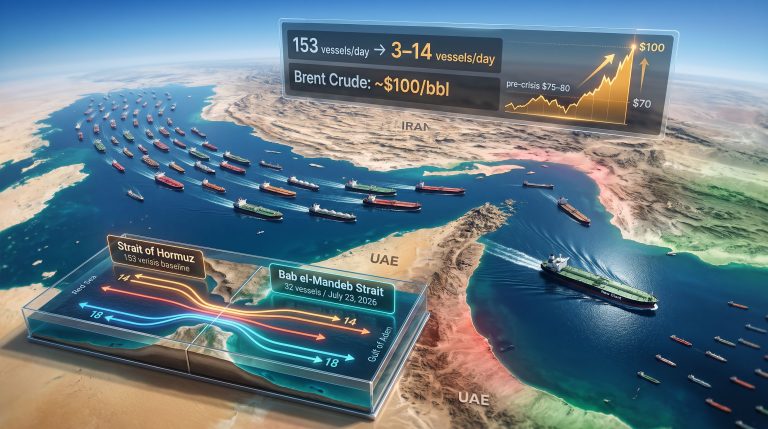
The Strait of Hormuz is a narrow maritime passage between Iran and Oman, and approximately 17 to 21 million barrels per day of seaborne oil transits through it, representing roughly 20% of global seaborne oil supply. The strait functions as the single exit point for crude exported from Kuwait, Iraq, the UAE, Qatar, and Saudi Arabia's eastern terminals, in addition to Iranian exports.
This geography creates a structural asymmetry. Iran does not need to successfully export its own oil to cause enormous damage to global energy markets. The threat of interdicting traffic through the strait generates a geopolitical risk premium on global crude benchmarks, typically estimated at $5 to $15 per barrel during active conflict phases. That premium affects all buyers, regardless of where their oil originates.
The Strait of Hormuz is not merely a transit route for Iranian exports. It is a structural lever over the entire architecture of Middle Eastern energy logistics, and its contested status introduces systemic risk that extends far beyond any bilateral political dispute.
For major Asian refining economies, particularly those in China, India, Japan, and South Korea, continued access to Gulf crude through the strait is not optional. It is foundational to refinery planning, petrochemical supply chains, and domestic energy pricing stability. Consequently, this dependency gives Iran a form of leverage that operates independently of its own export capacity. These crude oil logistics complexities continue to shape how major buyers respond to supply shocks in the region.
The Parliamentary Contradiction and What It Reveals About Sanctioned-State Communication
One of the more analytically revealing dimensions of this story involves a direct contradiction between two official Iranian government communications. In late June, parliament speaker and chief negotiator Mohammad Bagher Ghalibaf stated publicly that Iran had been entirely unable to export oil during the US port blockade. Weeks later, the oil ministry disclosed $18 billion in combined revenues covering that same period.
These statements cannot both be literally accurate. Three frameworks help reconcile the gap:
- Definitional divergence: Ghalibaf's statement may have referred specifically to official, sanctions-compliant export trade, while the ministry's figures captured the full spectrum of revenue-generating activity including grey-market transactions.
- Temporal sequencing: The blockade's most effective enforcement window may have been genuinely short, with alternative export mechanisms operational before and after peak pressure periods. A narrow period of effective blockade does not contradict broader revenue generation across the full conflict timeline.
- Strategic domestic framing: Public statements by senior political officials in sanctioned states routinely serve domestic audiences rather than reflecting operational reality. Portraying Iran as a victim of economic warfare serves internal political cohesion purposes regardless of actual revenue performance.
This pattern is not unique to Iran. Analysts tracking the Venezuela sanctions model, Russia, and North Korea have consistently observed divergence between official political narratives about sanctions impact and the actual commercial outcomes visible through shipping data, payment flows, and commodity price tracking.
The next major ASX story will hit our subscribers first
Historical Comparison: Iran's Sanctions Resilience Over Time
How Does 2026 Compare to Previous Sanctions Eras?
Placing the 2026 wartime revenue figure in historical context underscores both how much worse sanctions outcomes have been in the past and how the global grey-market infrastructure has matured.
| Period | Estimated Export Impact | Revenue/Economic Outcome |
|---|---|---|
| 2012 EU and US Sanctions | Approximately 50% volume reduction | Severe fiscal contraction, currency crisis |
| 2018-2019 Maximum Pressure Campaign | Exports fell from ~2.5M bpd to ~400K bpd | GDP contraction of approximately 6% |
| 2026 Wartime and Ceasefire | Partial blockade; $18B revenue achieved | More than 60% of annual budget target met |
The contrast between the 2018-2019 maximum pressure era, when exports collapsed to around 400,000 barrels per day, and the 2026 wartime period, when Iran still managed to cover the majority of its budget oil revenue target, reflects a maturing global sanctions evasion ecosystem. The shadow fleet infrastructure is larger, better financed, and more geographically distributed than it was a decade ago.
However, it is worth noting that Russian oil sanctions have followed a comparable trajectory, with Moscow similarly leveraging shadow fleet networks and willing Asian buyers to sustain export revenues well above what Western policymakers anticipated. The parallel is instructive for understanding the structural limits of unilateral economic pressure.
Disclaimer: Forward-looking analysis, scenario projections, and revenue estimates contained in this article are based on publicly available information and analytical frameworks. They should not be construed as financial advice or definitive assessments of geopolitical outcomes. Energy market conditions are subject to rapid change.
What This Means for Global Energy Policy and Market Strategy
The implications of how Iran sold $18 billion of oil during war and ceasefire extend well beyond the bilateral US-Iran dynamic. Several structural conclusions emerge for energy market participants and policymakers.
For oil price analysis:
- Geopolitical trade tensions tied to Strait of Hormuz disruption risk are likely to remain structurally embedded in Brent and WTI pricing for as long as the Iran-US standoff persists.
- The partial offset of supply disruption fears by continued Iranian export activity, even at reduced volumes, demonstrates that price spikes during Middle Eastern conflicts are typically moderated by grey-market supply responsiveness. Indeed, oil market analysts have noted how the fragile ceasefire has already begun to calm broader market sentiment.
For sanctions policy:
- Unilateral blockades and sanctions regimes face inherent structural limitations when alternative buyers with sufficient market weight remain outside the enforcement coalition.
- The effectiveness of economic pressure on major oil-producing states correlates strongly with the degree of multilateral participation in enforcement, a condition increasingly difficult to achieve in a multipolar trading environment.
For energy transition strategy:
- Episodes like this reinforce the long-term case for reducing structural dependence on Middle Eastern supply corridors, though the speed of any transition away from this dependence remains constrained by the scale of existing refinery infrastructure and petrochemical integration across Asia.
The $18 billion figure is, at its core, a data point about the gap between intended policy outcomes and observed market reality. In energy markets, that gap has always been where the most consequential dynamics actually unfold.
Want to Stay Ahead of the Next Major Resource Discovery?
Discovery Alert's proprietary Discovery IQ model delivers real-time alerts on significant ASX mineral discoveries, instantly turning complex resource data into actionable opportunities — explore historic discoveries and the returns they've generated, then begin your 14-day free trial to position yourself ahead of the broader market.