June 22, 2026
When an Export Weapon Becomes a Storage Trap: Understanding the Iran Oil Crisis
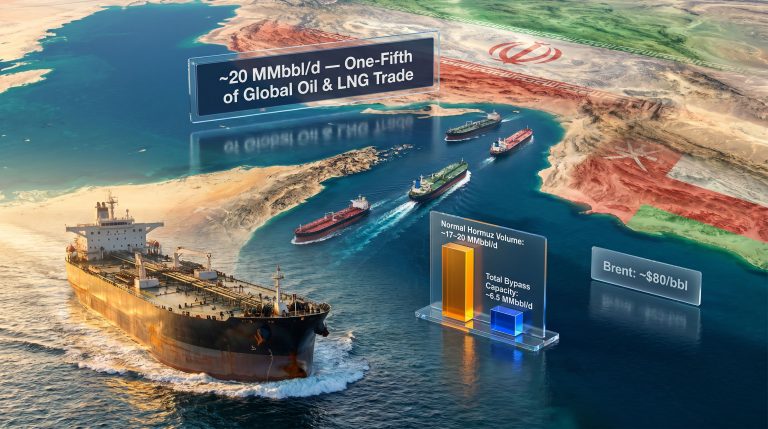
Global energy markets have endured many supply shocks over the past century, but few have unfolded with the particular mechanical cruelty of the current Iran oil storage crisis and US blockade. Most supply disruptions are sudden absences: a field goes offline, a pipeline ruptures, a producer cuts quotas. What makes the present situation structurally distinct is that Iran's production has continued largely uninterrupted, while its ability to move that crude to market has been surgically severed.
The result is not a supply shock in the traditional sense. It is a slow-motion compression event in which a nation's most powerful economic asset is turning against it from the inside.
To understand why this matters for global crude markets, investors, and energy-dependent economies across Asia and Europe, it is necessary to examine the mechanics of how this trap was built, how close it is to closing completely, and what a deal-based reopening of the Strait of Hormuz actually means in practice.
When big ASX news breaks, our subscribers know first
The Architecture of Iran's Pre-Crisis Export Model
For the better part of a decade, Iran operated one of the most sophisticated sanctions-circumvention logistical systems in global commodity markets. The model relied on three interconnected nodes working in sequence.
-
Production and loading at Kharg Island, Iran's primary crude export terminal, generating a continuous stream of barrels regardless of the external political environment.
-
Geographic laundering through ship-to-ship (STS) transfer operations positioned near Malaysian and Singaporean waters, where Iranian crude was effectively relabelled and repackaged for onward sale, obscuring the cargo's origin from compliance-sensitive buyers.
-
Final absorption by China's independent refinery network, known as teapot refiners, operating outside the major state-owned enterprises and therefore less exposed to Western banking system pressure. Payment structures routed through yuan-denominated channels further insulated these transactions from dollar-clearing oversight.
This three-node system proved remarkably durable against financial sanctions, insurance restrictions, and shipping registry pressures. Its structural vulnerability, which the US blockade formally activated on April 13, 2026, was physical rather than financial. The entire model depended on crude being able to exit the Persian Gulf through the Strait of Hormuz. Once that transit was blocked, the relay points near Singapore became irrelevant. Barrels could not reach them.
Furthermore, the broader consequences of sanctions on oil trading have demonstrated repeatedly how financial restrictions alone rarely achieve the same effect as a physical chokepoint.
How Loading Data Reveals the Scale of the Collapse
The Iran oil storage crisis and US blockade can be tracked precisely through tanker loading statistics, which tell a story of near-total export system failure compressed into roughly six weeks.
| Metric | Pre-Crisis Baseline | Post-Blockade Status |
|---|---|---|
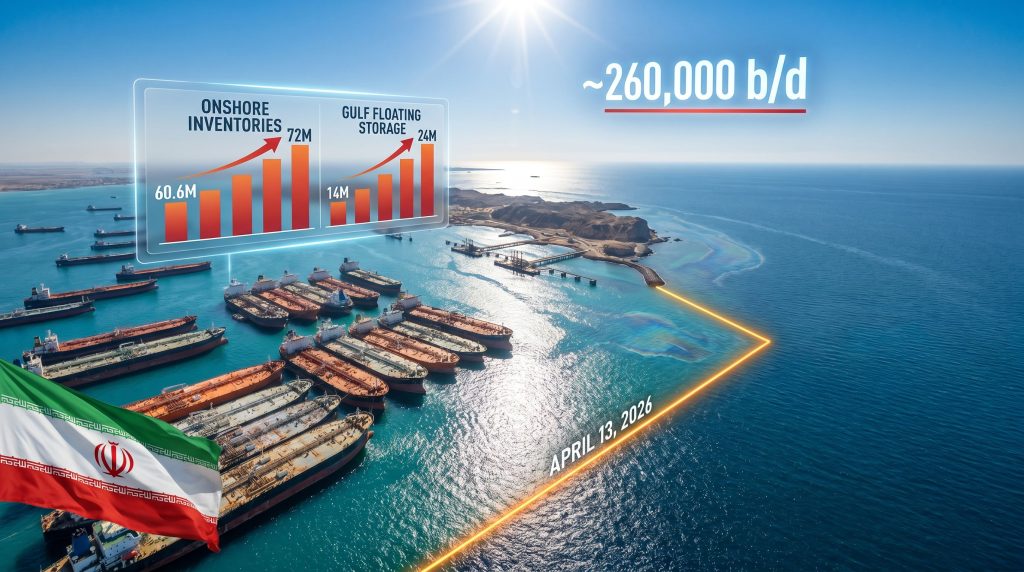
| Iranian crude export loadings | ~1.5 million b/d (April avg.) | ~260,000 b/d (May) |
| Onshore oil inventories | ~60.6 million barrels (mid-Jan 2026) | ~72 million barrels (mid-June 2026) |
| Floating storage inside the Gulf | ~14 million barrels (mid-May) | ~24 million barrels (mid-June) |
| Total floating storage (all regions) | ~43 million barrels (mid-May) | ~33.5 million barrels (mid-June) |
| Iranian Light crude pricing (pre-blockade) | ~$9-10/bbl discount to Brent | +$1.5-2/bbl premium to ICE Brent (April) |
| Chinese seaborne crude imports | ~11.4 million b/d (February) | ~6.8 million b/d (May) |
| Iranian crude reaching China (direct trade) | ~1.5-2 million b/d | ~1.4 million b/d (largely pre-blockade inventory) |
The April loading figure of approximately 1.5 million b/d already reflected a roughly 20% decline from March levels, as conflict uncertainty began disrupting normal tanker operations. The May collapse to just 260,000 b/d represented something qualitatively different: evidence that the blockade had rendered the primary export gateway functionally inoperative.
By June, most newly loaded cargoes remained inside the Gulf with no assigned destination, and only three May-loaded vessels managed to transit the Strait into open waters.
Critical Market Insight: In the weeks immediately before the blockade was formally activated, regional supply scarcity had briefly flipped Iran's crude pricing from a deep discount to a reported premium of $1.5-2/bbl above ICE Brent, generating an estimated $124 million per day in oil revenue for Tehran. The blockade's activation ended that window abruptly, replacing revenue optimisation with the inverse problem of storage accumulation.
The Storage Saturation Timeline: Three Phases of Escalating Pressure
The Iran oil storage crisis and US blockade has followed a recognisable phase structure, each stage compounding the pressure on Tehran's production and revenue position.
Phase One: Monetising the External Buffer (April to May 2026)
Iran's immediate response to losing Gulf transit access was to draw down floating storage that had already been pre-positioned outside the bottleneck. Vessels anchored near Singapore and along Chinese coastal waters, loaded before April 13, continued discharging into Chinese refineries through May and into June.
All five vessels confirmed to have discharged Iranian crude in China during June had departed Kharg Island prior to the blockade's activation. This created a statistically misleading picture of trade continuity that some market participants initially mispriced.
Phase Two: Internal Accumulation (May to June 2026)
As the external buffer depleted, the arithmetic became unavoidable. According to Kpler flow data, Iranian onshore inventories climbed from 60.6 million barrels in mid-January 2026 to 72 million barrels by mid-June — an increase of approximately 18.8 million barrels representing roughly a 15% rise over five months.
Simultaneously, Gulf-trapped floating storage nearly doubled over just five weeks, rising from 14 million barrels in mid-May to approximately 24 million barrels by mid-June. The divergence between declining total floating storage globally and rising Gulf-trapped floating storage captures the blockade's impact precisely: old barrels outside the Gulf continued moving to buyers while new production became stranded.
Phase Three: Production Constraint Signals (Late May Onwards)
A detail largely overlooked in market commentary is particularly significant. Since approximately late May 2026, both onshore inventories and Gulf-trapped floating storage metrics have barely moved despite the blockade remaining fully in place. Under normal continued-production conditions, these numbers should have continued rising.
Their stabilisation is widely interpreted by commodity flow analysts as evidence that Iran has already begun voluntarily reducing or partially suspending crude output, most likely starting around mid-May. A formal production curtailment announcement has not been made by Iranian authorities, but the storage data implies the adjustment is already underway.
Why this matters operationally: Shutting in oil wells is not a reversible, cost-free decision. Reservoir pressure management becomes complex during extended shutdowns, formation damage risks increase, and oilfield services infrastructure that has already been disrupted by the broader conflict compounds restart difficulty. What begins as an export logistics problem can evolve into a permanent reduction in productive capacity if well shutdowns extend beyond several months.
The China Variable: Strategic Buyer, Temporary Bridge, and Pricing Anchor
China's role in this crisis is more nuanced than headline trade figures suggest, and understanding it correctly is essential for interpreting what a post-deal market recovery actually looks like.
Before the conflict, Beijing was absorbing virtually all of Iran's 1.5-2 million b/d of exports, primarily through direct Kharg Island loadings and the STS relay network near Malaysia. China's independent teapot refiners found Iranian crude economically attractive even accounting for compliance risk, because the persistent discount of $9-10 per barrel below Brent translated into meaningful margin advantages at scale.
During the blockade period, China's broader seaborne crude import appetite contracted significantly. Total seaborne crude imports fell from 11.4 million b/d in February to 6.8 million b/d by May — a decline attributable to a combination of strategic reserve drawdowns, reduced refinery run rates, and demand softness in downstream markets.
The fact that direct Iranian crude arrivals remained at approximately 1.4 million b/d during May appears to show remarkable resilience of the Iran-China trade relationship. In reality, however, it reflects the depletion of pre-positioned floating storage rather than active post-blockade export flow.
This distinction has profound implications for the post-deal recovery curve. Once pre-positioned inventory is exhausted, absent a Strait reopening, the pipeline of Iranian crude reaching Chinese refineries will fall far more sharply than May data implies. Equally, once the Strait reopens, Chinese buyers are expected to move quickly to resume procurement, as discounted Iranian barrels remain preferable to alternative Middle Eastern supply at standard pricing.
The complexity of payment infrastructure deserves specific attention. Even before the current crisis, Iranian crude transactions outside the direct China trade required elaborate workarounds. Indian Oil Corporation's reported purchase of 2 million barrels of Iranian crude in late March, worth approximately $200 million, involved payment routed through yuan-denominated settlement via ICICI Bank's Shanghai branch. This payment architecture illustrates why sanctions normalisation is not simply a political act — it involves rebuilding or certifying financial plumbing that most counterparties are reluctant to touch until regulatory clarity is unambiguous.
In addition, crude oil market dynamics in this region have historically been shaped by exactly these kinds of payment and compliance complexities, which persist well beyond any single geopolitical event.
Scenario Analysis: What Happens When the Strait Reopens
A signed ceasefire agreement and the physical reopening of the Strait of Hormuz are not the same event, and market participants who conflate them risk significant mispricing.
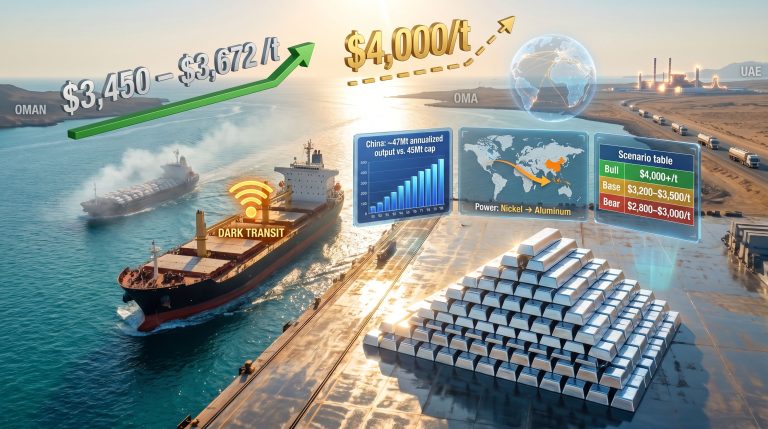
| Scenario | Market Impact | Key Assumption |
|---|---|---|
| Rapid Normalisation (60-day ceasefire holds) | 60+ million barrels of Gulf-trapped crude enters Asian markets; significant Brent/WTI downward pressure | Insurance, chartering, and compliance infrastructure reset within 2-3 weeks |
| Partial Recovery (ceasefire holds but sanctions complex) | Iranian crude returns at steep discounts; prices stabilise at lower levels without collapsing | Teapot refiners absorb volume; Western buyers remain cautious |
| Breakdown (ceasefire fails, blockade resumes) | Forced Iranian production cuts within 3-4 months; 1-1.5 million b/d removed from effective supply; oil price upside | No political solution; storage reaches tank-top; wells shut in permanently |
Goldman Sachs has specifically cautioned that Strait of Hormuz traffic normalisation may proceed more slowly than initial market optimism assumes, with insurance reinstatement, charterer risk reassessment, and tanker repositioning creating structural delays measured in weeks rather than days.
The IEA has separately flagged the possibility of a massive global oil surplus by 2027 if Middle Eastern supply, including Iranian volumes, fully recovers into a market where non-OPEC production growth has continued. Furthermore, OPEC market influence over pricing decisions will remain a critical variable throughout any recovery scenario.
The next major ASX story will hit our subscribers first
The Five Friction Points Slowing Post-Deal Oil Flow Recovery
Even with political agreement in place, five distinct barriers will slow the pace at which Iranian crude returns to global markets:
-
Tanker repositioning and queuing — vessels that rerouted away from Hormuz during the blockade require physical repositioning time before loading can commence.
-
War-risk insurance reinstatement — maritime insurers that cancelled Gulf coverage must formally re-underwrite the route, a process governed by actuarial reassessment rather than political timelines.
-
Charterer risk appetite reset — shipping companies will demand that the 60-day ceasefire demonstrate observable stability before committing to new long-term charter arrangements.
-
Sanctions compliance architecture — lifting oil-specific sanctions requires regulatory process that does not accelerate simply because a ceasefire is signed. Iran's banking system remains substantially sanctioned independently of the oil-specific measures.
-
Crude differential repricing — buyers will demand deeper discounts to compensate for residual geopolitical risk, compressing Iranian revenue per barrel and potentially deterring some marginal volume recovery.
Revenue Recovery Illustration: Even assuming the Strait reopens within two weeks of a signed agreement, Iranian export volumes are unlikely to return to pre-crisis levels of 1.5-2 million b/d for at least 60-90 days. At a conservative $60-65/bbl Brent price with a $9-10/bbl discount applied, Iran's daily oil revenue during the recovery ramp would be approximately $75-100 million per day — roughly 40-50% below the $124 million per day achieved briefly in April 2026.
The Broader Market Fallout: Allies, Competitors, and the ECB
The Iran oil storage crisis and US blockade has not isolated its costs within Iranian borders. Gulf producers allied with Washington were forced to curtail their own oil and gas production during the Strait closure, as the physical geography of the waterway made it impossible to maintain allied exports while simultaneously preventing Iranian transit.
Asian refinery systems in countries maintaining strategic alignment with the United States experienced significant feedstock disruption, with downstream fuel prices rising sharply across several import-dependent economies. Oil price movements during this period reflected the compounding pressure of both blockade constraints and broader geopolitical uncertainty.
European energy markets absorbed a price shock that the ECB has explicitly stated will not be fully erased by a peace agreement. European gas prices fell approximately 6% on initial US-Iran deal announcements, but the ECB's assessment reflects a structural reality: energy infrastructure damage, long-term contract renegotiations, and the repricing of risk premiums across supply chains do not reverse as quickly as futures markets respond to geopolitical headlines.
Poland's government has already moved to tax fuel windfall profits earned during the conflict period, a policy signal of how politically significant the energy price shock became across European economies. The trade war impact on oil supply chains has similarly demonstrated how rapidly geopolitical decisions translate into real-world energy costs for consumers and industries alike.
Investor and Analyst Takeaways
For energy market participants tracking the evolving situation, several structural conclusions emerge from this analysis:
-
The storage data is a leading indicator, not a lagging one. The stabilisation of Iranian onshore and Gulf-trapped floating storage since late May is the single most important signal that production curtailment has likely begun, ahead of any official announcement.
-
China's May trade data overstated export recovery. The 1.4 million b/d of Iranian crude arrivals in China during May reflected pre-blockade floating inventory depletion, not active export normalisation. The true supply gap will become more visible as that buffer exhausts itself.
-
Deal timing reflects operational pressure, not political concession. The convergence of storage constraints, production risk signals, and revenue decline at this precise moment is not coincidental. Tehran's willingness to formalise an agreement aligns with the point at which continued inaction began threatening permanent production capacity loss, not merely short-term revenue compression.
-
Post-deal market normalisation will lag political timelines by 60-90 days minimum. Investors pricing in an immediate supply normalisation following ceasefire formalisation are likely to be disappointed by the pace of actual volume recovery, given the compounding friction of insurance, chartering, sanctions compliance, and crude differential reset.
-
Long-term Iranian productive capacity is at risk. The well shut-in question is the most underappreciated element of this crisis. If production curtailments extend beyond several months, the Iranian oil sector faces a structural damage scenario that cannot be addressed by political agreements alone.
Disclaimer: This article is for informational and educational purposes only and does not constitute financial, investment, or trading advice. All forecasts, scenario projections, and analytical assessments involve uncertainty and should not be relied upon as predictions of future market outcomes. Readers should conduct independent research and consult qualified financial advisers before making investment decisions.
Want to Stay Ahead of the Next Major Resource Market Shift?
Discovery Alert's proprietary Discovery IQ model delivers real-time alerts on significant ASX mineral discoveries, instantly translating complex resource data into actionable investment insights — the same analytical edge that has helped subscribers identify transformative opportunities like those seen with De Grey Mining and WA1 Resources. Explore how historic mineral discoveries have generated substantial market returns, then begin your 14-day free trial at Discovery Alert to position yourself ahead of the broader market.