
June 15, 2026
The Geopolitical Price Premium: How War Risk Gets Built Into Crude
Energy commodity markets possess a distinctive characteristic that separates them from most other asset classes: prices do not simply reflect what is happening today but encode a probabilistic assessment of what might happen tomorrow. This forward-pricing mechanism means that when geopolitical tensions rise in regions controlling critical supply infrastructure, the market begins discounting future disruption scenarios long before any physical barrel of oil is affected. Understanding this mechanism is essential to interpreting why the Iran peace deal cuts Brent to $83 rather than back to pre-war levels, and what that gap tells us about residual market uncertainty.
Before hostilities escalated between the United States and Iran in early 2026, Brent crude traded at approximately $67 per barrel, a level broadly consistent with prevailing supply-demand fundamentals. As tensions mounted through April and into May, markets began incorporating an escalating risk premium into futures prices. By the May conflict peak, Brent had surged to $126.41 per barrel, representing a premium of nearly $60 per barrel above the pre-war baseline, driven almost entirely by anticipated disruption to Middle Eastern supply corridors. Understanding the crude price drivers behind this surge is essential for contextualising what followed.
The June 15, 2026 peace framework triggered an immediate 4.57% single-session decline, pulling Brent down to $83.34 per barrel. That move represented the partial unwinding of accumulated risk positions, as traders began pricing out the most acute disruption scenarios. Yet the price settled at a level that maintained roughly $16 per barrel above the pre-war baseline of $67, a gap that reveals how markets distinguish between a ceasefire and a resolution.
Brent Price Trajectory: Pre-War to Post-Deal
| Price Milestone | Brent Level | Context |
|---|---|---|
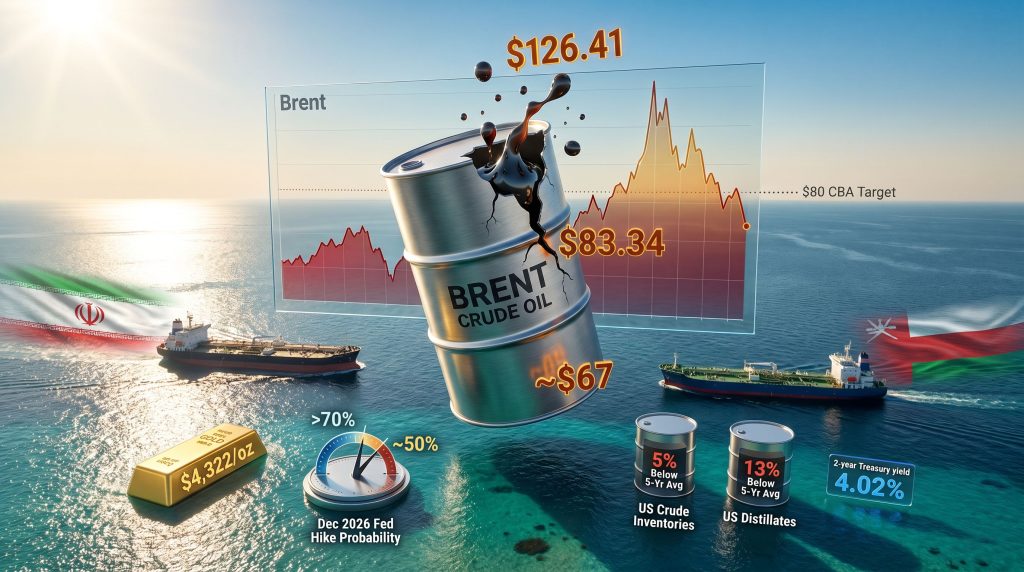
| Pre-war baseline | ~$67/bbl | Before conflict escalation |
| May 2026 conflict peak | $126.41/bbl | Maximum supply disruption fear |
| Post-deal (June 15, 2026) | $83.34/bbl | Partial risk premium removal |
| CBA analyst year-end target | ~$80/bbl | Conditional on Hormuz remaining open |
"The gap between $83 and the pre-war level of $67 represents approximately $16 per barrel of residual risk premium still embedded in global crude prices, reflecting unresolved structural uncertainty rather than restored confidence."
How the Risk Premium Mechanism Operates
The mechanics through which geopolitical risk enters oil pricing involve several reinforcing channels. Options market activity provides early signals, with crude oil volatility measures rising sharply as uncertainty escalates. This increased volatility premium feeds directly into futures pricing through the cost-of-carry framework, elevating the convenience yield component that represents the value of holding physical inventory during periods of potential disruption.
The futures curve structure itself transforms dramatically during geopolitical episodes. During the May conflict peak, the 12-month calendar spread widened substantially as markets priced both immediate disruption risk and longer-term normalisation expectations simultaneously. This structural shift creates a complex pricing environment where near-term and deferred contracts move in different directions depending on how traders assess the conflict's duration and resolution probability.
Historical precedent reinforces these dynamics. During the 1990-1991 Gulf War, oil and geopolitics interacted to surge prices from approximately $20 per barrel to over $40 per barrel before settling around $25 per barrel after hostilities ceased, with a residual premium persisting for nearly two years as markets assessed regional stability. Following the 2011 Libyan civil war, Brent fell from a peak near $127 to approximately $105 despite the conclusion of major hostilities, again reflecting ongoing political and infrastructure uncertainty. The current situation demonstrates comparable dynamics, where diplomatic progress removes the acute disruption premium while structural concerns maintain a persistent baseline risk premium.
When big ASX news breaks, our subscribers know first
What Did the US-Iran Peace Deal Actually Deliver?
The Strait of Hormuz Framework: Reopening With Conditions
The most operationally significant element of the June 15, 2026 peace framework was the commitment to reopen the Strait of Hormuz to commercial shipping. Approximately 20% of global oil supply transits this chokepoint daily, making it the single most consequential maritime corridor for energy markets worldwide. Any friction in this corridor produces disproportionate pricing effects relative to the actual volume disrupted, because the threat of closure is priced continuously regardless of whether physical interruption occurs.
Under the terms of the agreement, Iran and Oman will jointly regulate traffic through the strait, a structure that preserves Tehran's ongoing operational influence over this waterway while providing a nominally neutral oversight framework. This arrangement echoes historical precedents for shared maritime regulation in strategically sensitive corridors, though the specific governance mechanics for this joint framework remain subject to ongoing negotiation. Reuters reporting confirms that oil markets extended losses following Trump's decision to call off planned strikes, reinforcing how sensitive prices remain to diplomatic signals.
A proposed transit toll mechanism represents a particularly consequential but underappreciated element of the deal. While specific rates have not been finalised, preliminary discussions suggest charges based on vessel deadweight tonnage that could translate to meaningful per-barrel costs for commercial shippers. Pre-conflict, the Strait operated with minimal regulatory overhead and no formal toll structure. Introducing even a modest toll introduces a permanent new cost layer into the economics of Persian Gulf crude exports, affecting shipping margins, tanker utilisation decisions, and ultimately end-user import costs.
What the Deal Left Unresolved
The agreement's structural limitations are arguably as important as what it accomplished. Three critical areas remain outside the current framework:
-
Iran's nuclear programme was explicitly excluded, leaving the most consequential long-term geopolitical risk entirely unaddressed. Nuclear talks are described as continuing separately, but their outcome will ultimately determine whether the residual $16 per barrel risk premium compresses further or re-expands.
-
Regional oil infrastructure damage sustained during the conflict creates physical constraints on export recovery that are independent of the diplomatic settlement. Iranian export terminals sustained significant damage, with estimates suggesting a reduction in available export capacity from pre-war levels that will require months of repair work to restore.
-
The transit toll framework remains unresolved in its specifics, creating ongoing uncertainty about shipping economics that prevents tanker operators from fully normalising route planning and freight rate structures.
"A peace framework that reopens a shipping lane without resolving the underlying nuclear dispute is structurally incomplete. Markets are pricing a ceasefire, not a resolution."
Is the $83 Price Level Justified? Dissecting the Supply-Demand Reality
US Fuel Inventory Data Tells a Different Story
The diplomatic breakthrough created an instinct among market participants to treat the oil price decline as reflecting a return toward physical supply normalisation. Weekly EIA inventory data complicates that narrative considerably. Despite the peace agreement, physical oil and fuel markets remain structurally tight across multiple dimensions:
-
US commercial crude inventories: 426.5 million barrels, standing 5% below the five-year seasonal average
-
US distillate inventories: 13% below the five-year average, a significant deficit by historical standards
-
Distillate demand: 3.7 million barrels per day, up 7.2% year-over-year, indicating demand accelerating even as supply remains constrained
-
US crude import volumes: Averaged 5.9 million barrels per day over the relevant four-week period, 5.8% below the prior-year average, indicating reduced inflows preceding the peace agreement
These figures paint a picture of an underlying physical market that has not yet received the supply relief implied by the headline price decline. Crude prices responding to diplomatic signals is a forward-looking market function, but physical fuel supply requires actual barrels to move through actual pipelines and refineries before inventories recover.
Why Distillate Deficits Matter More Than Crude Headlines
The 13% distillate inventory deficit deserves particular attention because it represents a market segment that crude price movements alone cannot address. Distillates, encompassing diesel, jet fuel, and heating oil, are the functional fuel of industrial economies. Unlike crude oil, which can accumulate in storage during price dislocations, distillates are consumed continuously by transport networks, agricultural operations, construction equipment, and logistics chains that have limited ability to curtail usage in response to price signals.
The combination of a 13% inventory deficit against a backdrop of 7.2% demand growth creates a structural tightness that has its own pricing dynamics, partially independent of what happens in crude futures markets. Even if Brent settles at the CBA year-end target of $80 per barrel, distillate markets may remain elevated due to regional refinery damage that has impaired refined product output capacity. The repair timeline for hydrocracking units that produce high-value diesel and jet fuel typically extends 4-6 months from the point of damage assessment, meaning that physical distillate supply constraints could persist well into the second half of 2026 regardless of how the geopolitical situation evolves.
"Headline crude prices have fallen sharply, but downstream fuel markets are operating in deficit conditions. This divergence creates genuine risk for energy-intensive industries and complicates the near-term inflation outlook."
How Does the Iran Deal Reshape the Federal Reserve's Rate Path?
The Oil-Inflation-Fed Transmission Mechanism
The relationship between crude oil prices and US monetary policy operates through a well-established transmission channel that runs from energy costs through consumer price indices to Federal Reserve rate decisions. When oil prices rise substantially, energy components within the Consumer Price Index elevate, creating inflationary persistence that constrains the Fed's ability to ease policy. The reverse mechanism applies when oil prices fall, creating potential space for rate relief.
The transmission process operates in sequence:
-
Higher oil prices elevate energy CPI components, particularly transportation fuel and utility costs that affect both consumers and businesses directly
-
Energy inflation persistence feeds through to broader price indices via second-round effects, including transport costs embedded in goods prices and heating costs that affect service sector operating expenses
-
Sustained inflation above the Fed's 2% target constrains the policy rate path, keeping borrowing costs elevated and pressuring rate-sensitive assets
-
Lower oil prices reverse this sequence, reducing energy's inflationary contribution and providing the Fed with greater flexibility to hold or reduce rates
What CME FedWatch Data Revealed After the Deal
The market's reassessment of the Fed's policy trajectory following the peace announcement was immediate and measurable. CME FedWatch data showed the probability of a December 2026 rate hike fell from more than 70% to approximately 50% following the Brent price decline. Two-year US Treasury yields, which are highly sensitive to near-term rate expectations, declined 6 basis points to 4.02% in the trading session following the announcement. The Fed is broadly expected to hold rates at 3.50%-3.75% at its next scheduled meeting, with the December decision now representing a genuine 50-50 probability assessment.
The Conditional Nature of the Rate Relief
The critical nuance here is conditionality. TD Securities strategists have noted that the reduction in inflation risk reflected in current market pricing may prove temporary if Middle Eastern oil exports and refined fuel supplies recover more slowly than markets currently assume. This warning is well-founded given the inventory data outlined above.
| Scenario | Oil Price Trajectory | Inflation Implication | Fed Rate Outlook |
|---|---|---|---|
| Hormuz fully reopens, exports recover | Brent moves toward $80 | Energy inflation eases | Rate-hike probability falls below 50% |
| Slow export recovery, inventories remain tight | Brent holds $83-$90 range | Inflation stays elevated | December hike probability rebounds above 60% |
| Nuclear talks collapse, conflict resumes | Brent spikes toward $100+ | Inflation shock | Aggressive tightening re-priced |
The weekly EIA inventory reports will serve as the primary real-time signal for investors tracking whether physical supply is actually improving at a pace consistent with the market's current pricing of reduced rate-hike risk. Consecutive distillate inventory draws rather than builds would be an early warning that the diplomatic progress has not yet translated into physical fuel market relief.
Gold's Divergent Response: Why $4,322 Makes Sense in This Environment
The Safe-Haven and Rate-Sensitivity Paradox
Spot gold's 2.5% rise to $4,322 per ounce on June 15, 2026 initially appears counterintuitive against a backdrop of risk-on sentiment generated by the peace deal. If geopolitical risk is declining, conventional wisdom suggests safe-haven assets should face selling pressure. The explanation lies in understanding that gold's price is driven by two distinct forces simultaneously, and on this occasion they both pointed upward. Furthermore, the safe-haven gold dynamics at play here reflect a more nuanced relationship between risk sentiment and precious metals than a simple risk-on/risk-off framework would suggest.
The first driver is geopolitical uncertainty, which does tend to support gold demand. The peace deal reduced but did not eliminate this factor, and the $16 per barrel residual risk premium in oil markets reflects the same incomplete resolution that supports continued safe-haven demand for gold.
The second and more immediately impactful driver was the rate-sensitivity channel. Lower oil prices reduced rate-hike expectations, which in turn reduced the opportunity cost of holding non-yielding gold relative to interest-bearing fixed income alternatives. The 6 basis point decline in 2-year Treasury yields to 4.02% directly supported gold's appeal by reducing the yield advantage that competes with the metal. This dual support mechanism explains how gold could rise simultaneously with equity markets on the same news event, a dynamic that reflects genuine sophistication in how different asset classes respond to complex, multi-variable news flows. Gold and bond volatility have historically interacted in precisely this fashion during geopolitical transitions.
Implications for Gold Mining Margins
The simultaneous movement of gold prices higher and oil prices lower creates a compelling dual margin effect for gold producers, though the actual impact varies considerably by individual producer characteristics. In addition, central bank gold demand continues to provide structural support beneath the gold price regardless of short-term geopolitical fluctuations.
-
Revenue side: Gold at $4,322 per ounce represents a meaningful revenue improvement relative to recent months for all producers regardless of jurisdiction or cost structure
-
Cost side: Brent at $83 per barrel reduces diesel and energy costs relative to the conflict-era peak of $126.41 per barrel, though energy costs remain materially elevated compared to the pre-war $67 per barrel baseline
-
Net margin impact: The benefit depends critically on whether operational budgets were set above or below the $80 per barrel oil threshold, with producers who set budgets expecting sub-$80 energy costs facing ongoing cost pressure despite the price decline from peak levels
"Producers who locked in fuel hedges at pre-war prices face a fundamentally different cost reality than those exposed to spot energy markets. The $83 Brent level is materially better than $126 but does not yet represent a return to pre-conflict operating economics."
What Happens Next? Three Scenarios for Brent and the Broader Market
Scenario 1: Orderly Recovery (Base Case)
The base case assumes that the Strait of Hormuz remains open under the joint Iran-Oman framework, Iranian export infrastructure repairs proceed on schedule, and nuclear negotiations continue without a breakdown. Under this scenario:
-
Brent drifts toward the CBA analyst $80 year-end target
-
US distillate inventories begin recovering toward the five-year seasonal average through weekly builds
-
December rate-hike probability stabilises below 50%, providing a supportive backdrop for gold and rate-sensitive equity valuations
-
The transit toll framework, once finalised, proves modest enough to be absorbed within normal shipping economics without materially disrupting trade flows
Scenario 2: Slow Supply Restoration (Risk Case)
This scenario reflects the possibility that physical supply recovery lags diplomatic progress due to infrastructure damage, logistical constraints, and the complexity of restoring industrial operations after conflict damage:
-
US distillate deficits persist or widen through Q3 2026, maintaining fuel market tightness
-
Brent stabilises in the $85-$92 range, keeping energy inflation elevated above pre-conflict levels
-
December rate-hike probability drifts back above 60%, creating headwinds for gold and rate-sensitive equity sectors
-
The divergence between headline crude prices and tight distillate markets creates sector-specific inflation pressures affecting logistics, aviation, and agricultural industries disproportionately
Scenario 3: Diplomatic Breakdown (Tail Risk)
The tail risk scenario involves a failure of nuclear negotiations that triggers renewed sanctions, conflict escalation, or Iranian reassertion of control over Hormuz transit. Under this scenario:
-
Brent re-tests the $100-$110 range as supply disruption risk is repriced
-
Distillate markets face acute shortages given the existing 13% inventory deficit starting point
-
The Fed confronts a stagflationary dilemma where inflation is rising even as economic growth moderates under high energy cost pressure, complicating the policy response considerably
The next major ASX story will hit our subscribers first
Key Metrics to Monitor: The EIA Inventory Tracker Framework
Weekly Data Points That Will Define the Oil Price Trajectory
The gap between the diplomatic signal sent by the peace deal and the physical reality of fuel markets means that weekly EIA inventory releases will carry elevated significance for oil price direction through the remainder of 2026. Investors tracking this space should focus on four primary data series:
-
Crude inventory builds vs. draws relative to the five-year seasonal average, with the current 5% deficit providing context for interpreting weekly changes
-
Distillate inventory trajectory, where a sustained recovery toward the five-year average would signal genuine supply normalisation. The current 13% deficit represents the most operationally significant constraint in fuel markets.
-
US crude import volumes, where recovery above the prior-year four-week average would confirm that Hormuz flow restoration is translating into actual barrel arrivals at US refinery infrastructure
-
Refinery utilisation rates, which serve as a leading indicator of whether downstream processing capacity is absorbing crude inflows at rates consistent with demand requirements
"Consecutive weekly distillate inventory builds of 1-2 million barrels would provide the clearest signal that the peace deal is generating real fuel market relief. Continued weekly draws would suggest that $83 Brent is not yet supported by physical supply fundamentals and that further price declines face headwinds from underlying tightness."
The interaction between these four data series and evolving nuclear negotiation developments will collectively determine whether Brent consolidates toward $80, stabilises in the $83-$90 range, or faces renewed upward pressure from a deteriorating geopolitical or physical supply environment. CNBC's coverage of the initial deal hopes, despite Tehran's pushback, illustrates just how sensitive these markets remain to diplomatic signals. Market participants who monitor the EIA weekly data with the same attention they apply to diplomatic headlines will be better positioned to anticipate price direction than those relying solely on geopolitical event analysis.
Frequently Asked Questions: Iran Peace Deal and Oil Prices
Why did Brent fall to $83 after the Iran peace deal?
The US-Iran peace framework included a commitment to reopen the Strait of Hormuz to commercial shipping, removing a substantial portion of the war-related supply disruption premium that had driven Brent to a May peak of $126.41 per barrel. The 4.57% single-session decline to $83.34 reflected traders partially unwinding geopolitical risk positions accumulated during the conflict escalation. However, Brent remained well above its pre-conflict level of approximately $67 per barrel, indicating that significant residual risk remained in market pricing.
Why didn't Brent fall back to pre-war levels of $67?
The deal left Iran's nuclear programme unresolved, preserved Tehran's regulatory role over Hormuz through a joint framework with Oman, and introduced an unfinaliseed transit toll mechanism that creates shipping cost uncertainty. Regional oil infrastructure sustained conflict-related damage that constrains how quickly Iranian export volumes can recover to pre-war capacity levels. These factors collectively justify a residual risk premium of approximately $16 per barrel above pre-war price levels.
What is the CBA analyst year-end Brent target?
CBA analyst Vivek Dhar has set an $80 per barrel year-end target for Brent, contingent on the Strait of Hormuz remaining open and Iranian oil and refinery exports recovering progressively. This target represents a further modest decline from the post-deal level of $83.34, and explicitly acknowledges that damage to regional oil and refinery assets creates meaningful uncertainty about the pace of export recovery.
How does lower oil price affect Fed rate decisions?
Lower crude prices reduce energy's contribution to consumer price inflation. With Brent declining from $126.41 to $83.34, the probability of a December 2026 Fed rate hike fell from over 70% to approximately 50%, as markets reassessed the inflation trajectory. The Fed is expected to hold rates at 3.50%-3.75% at its next meeting. However, TD Securities strategists have cautioned that this rate relief may prove temporary if energy supply recovery is slower than current market expectations imply.
What is the US distillate deficit and why does it matter?
US distillate inventories, covering diesel, jet fuel, and heating oil, stood at 13% below the five-year seasonal average as of mid-June 2026, against demand running 7.2% above prior-year levels at 3.7 million barrels per day. This deficit indicates that downstream fuel markets remain structurally tight even as headline crude prices fall, creating ongoing cost pressure for transport, logistics, agriculture, and industrial sectors. This divergence between crude price relief and downstream tightness represents one of the most important and underappreciated market dynamics following the peace deal.
Readers seeking additional context on crude oil pricing dynamics and Middle East geopolitical risk may find related analysis at Crux Investor, which publishes ongoing coverage of energy commodity markets and their intersection with monetary policy and mining sector economics.
This article contains forward-looking statements and scenario analysis based on market data available as of June 15, 2026. Commodity price forecasts, Federal Reserve rate expectations, and scenario projections involve inherent uncertainty and should not be construed as financial advice. Investors should conduct independent due diligence before making investment decisions based on energy market analysis.
Want To Know Which ASX Mining Companies Stand To Benefit From Shifting Commodity Markets?
Discovery Alert's proprietary Discovery IQ model delivers real-time alerts the moment significant ASX mineral discoveries are announced, instantly translating complex market dynamics into actionable investment opportunities for both short-term traders and long-term investors. Explore historic examples of major mineral discoveries and their market returns, then start your 14-day free trial to position yourself ahead of the market.