July 17, 2026
The Chokepoint Economy: How Maritime Warfare Is Rewriting Oil Price Risk
Energy markets have always been hostage to geography. The world's most critical oil and gas volumes do not move through open ocean highways but through narrow, contested maritime corridors where geography confers leverage to whoever controls the shoreline. When those corridors come under genuine military threat, the pricing signals that emerge are not speculative noise but structural warnings that ripple through every economy dependent on seaborne hydrocarbons.
That structural warning is now being transmitted in real time as Iran threatens oil exports and the security of the Persian Gulf's maritime arteries deteriorates at a pace that has caught even experienced energy analysts off guard. The oil price volatility trends now emerging from this confrontation are reshaping how markets price geopolitical risk globally.
When big ASX news breaks, our subscribers know first
The Escalation Architecture Behind the Current Oil Price Movement
Understanding why oil markets moved sharply higher on 15 July 2026 requires looking past the day's headlines and examining the sequence of decisions that brought the US-Iran confrontation to its current intensity.
The fragile ceasefire that briefly held in June 2026 collapsed under the weight of unresolved structural disputes, triggering a return to direct military engagement rather than the proxy conflicts that had characterised earlier phases of the confrontation. What followed was not a gradual deterioration but a rapid escalation: the United States reimposed a naval blockade on Iranian ports, a measure specifically designed to choke off Iran's remaining crude export revenues.
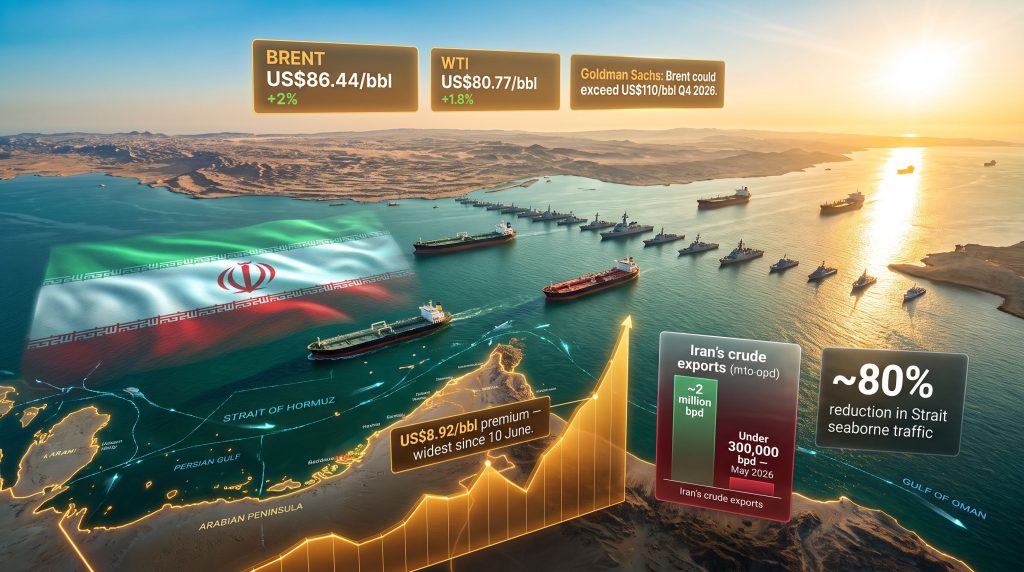
The market consequences of that decision were immediate. Iran's crude production, which had already been compressed by years of sanctions, fell from approximately 2 million barrels per day (bpd) to under 300,000 bpd by May 2026, a reduction exceeding 85% of pre-blockade output. The financial damage is significant: cumulative revenue losses are estimated at around $6 billion, with daily production cut losses running at approximately $435 million per day.
At those loss rates, the economic pressure on Tehran to respond asymmetrically intensifies rapidly. The threat Iran wields is not symmetric military capability but the ability to impose disproportionate costs on the global energy system through targeted disruption of maritime trade routes. Furthermore, geopolitical oil price tensions of this scale have historically preceded prolonged periods of market instability.
Iran's Revenue Collapse: The Numbers Behind the Threat
| Metric | Pre-Blockade | Post-Blockade (May 2026) |
|---|---|---|
| Crude export volume | ~2 million bpd | Under 300,000 bpd |
| Daily revenue loss | Baseline | ~$435 million/day |
| Cumulative revenue loss | Baseline | ~$6 billion total |
| Gulf exports as % of pre-war levels | 100% | Below 50% (~11M bpd) |
A less commonly understood dynamic is the role of storage capacity constraints in accelerating Iran's production decline. When export channels close and domestic storage fills, producers face involuntary production shutdowns because there is physically nowhere to put the crude being extracted. This creates a compounding effect where even partial export disruptions can force production cuts far larger than the export blockage itself would suggest.
How Does the Strait of Hormuz Function as a Geopolitical Weapon?
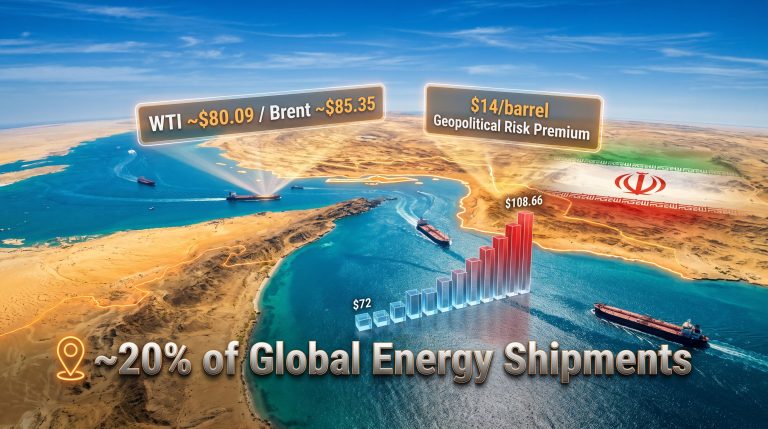
The Strait of Hormuz is a narrow navigational channel separating Iran from Oman, measuring roughly 33 kilometres at its narrowest navigable point. Through this corridor flows close to one-third of the world's seaborne crude oil and a substantial share of global liquefied natural gas volumes. Every major Gulf producer, including Saudi Arabia, the UAE, Kuwait, Iraq, and Qatar, depends on this passage for export access.
There is no viable alternative routing at comparable cost or transit time. Ships rerouted around the Arabian Peninsula or through alternative passages face journeys measured in additional weeks, not days, with corresponding increases in freight costs and insurance premiums that translate directly into landed energy prices for importers.
This asymmetry is the core of Iran's leverage. The economic damage Tehran absorbs from a Hormuz disruption is already priced in through existing sanctions. The damage that a sustained closure would inflict on energy-importing nations, particularly in Asia, far exceeds anything Iran would additionally suffer. That is what makes the threat credible even when operational execution remains uncertain.
What the IRGC's Declaration Actually Signals to Markets
The Islamic Revolutionary Guard Corps issued a statement through Iran's state-owned Islamic Republic News Agency articulating the principle that regional energy exports are either accessible to all parties or denied to all. This is not the language of negotiation but of coercive deterrence, designed to signal that Iran views its remaining leverage as indivisible from its survival as an exporting nation.
Markets are reading this differently from prior cycles of Hormuz rhetoric. The distinction this time lies in the operational evidence accompanying the statements: seaborne traffic through the strait reportedly dropped by approximately 80% on peak disruption days, and major marine insurers withdrew coverage from the corridor. Insurance withdrawal is a harder signal than political rhetoric because it directly prevents commercial operators from transiting regardless of their own risk appetite.
Iran is simultaneously pursuing a dual posture that adds further complexity. While threatening to deny Arab neighbours access to the strait, Tehran has been maintaining its own crude export flows through the Jask terminal and indirect routing through Chinese port networks, exploiting the geographic separation between its own export infrastructure and the Hormuz corridor used by its Gulf rivals.
Oil Price Forecasts and the Futures Market Architecture
Brent crude reached US$86.44 per barrel during the 15 July session, representing a 2% intraday gain, while WTI futures rose US$1.43, or 1.8%, to US$80.77/bbl. These moves followed a session the previous day in which prices settled at a one-month high, extending a rally that has been building as the conflict deepens. The broader context of oil markets under conflict conditions demonstrates how rapidly supply assumptions can be repriced.
Goldman Sachs has provided the most closely watched institutional assessment of the current trajectory. The bank reported that Gulf exports had recovered to above 80% of pre-war levels following the June memorandum of understanding, before collapsing back to below 50%, or approximately 11 million barrels per day, within a single week as hostilities resumed. Goldman Sachs has warned that Brent could surpass US$110/bbl in Q4 2026 if Gulf export recovery remains stalled at current levels.
In extreme scenarios involving a sustained Hormuz closure, some official estimates place the potential price ceiling as high as US$200 per barrel, a level that would trigger emergency International Energy Agency reserve releases and force emergency policy responses across energy-importing economies.
Reading the Backwardation Signal
One of the most technically significant indicators in the current market is the structure of Brent crude futures contracts. As of mid-July, prompt delivery Brent contracts were trading at a US$8.92/bbl premium over contracts six months forward, the widest such margin since 10 June.
What backwardation reveals: When the price for immediate crude delivery trades significantly above the price for future delivery, it indicates that physical barrels are scarce right now, not merely that traders expect future prices to rise. A US$8.92/bbl spread of this kind reflects genuine near-term tightness in the physical market, not speculative positioning. Historically, backwardation of this magnitude has preceded sustained multi-month price rallies.
For investors and energy buyers, the backwardation signal carries practical implications:
- Refiners and importers face stronger incentives to purchase spot cargoes and rebuild inventories immediately rather than relying on forward purchases
- Oil traders with access to physical storage can earn a return by holding crude, further tightening available supply
- Central banks in energy-importing economies must factor in a sustained elevation of input costs when modelling inflation trajectories
The Second Front: Bab el Mandeb and the Dual Chokepoint Threat
A risk that has received less mainstream attention but carries significant market implications involves the simultaneous activation of a second energy chokepoint. Iran has reportedly been signalling through its Houthi proxy network in Yemen that the Bab el Mandeb strait connecting the Red Sea to the Gulf of Aden could face coordinated disruption alongside the Hormuz pressure.
This dual-chokepoint scenario represents a qualitatively different threat than either disruption in isolation. Regional fuel shortages, including jet fuel and gasoline supply disruptions, have already been reported across affected markets as a consequence of elevated transit risk. OPEC market influence is consequently being tested in ways not seen during previous supply crises.
Comparative Risk: Global Energy Chokepoints Under Active Threat
| Chokepoint | Daily Volume at Risk | Current Threat Level | Alternative Routing |
|---|---|---|---|
| Strait of Hormuz | ~20% of global oil supply | Critical: active disruption | None at equivalent scale |
| Bab el Mandeb | ~6-7 million bpd | Elevated: Houthi proxy threat | Cape of Good Hope (weeks longer) |
| Suez Canal | ~9% of global trade | Moderate: indirect exposure | Cape of Good Hope |
The compounding effect of two major transit corridors facing simultaneous disruption creates non-linear supply risk that individual chokepoint models tend to understate. When rerouting options for one corridor (such as the Cape of Good Hope path around Africa) are also degraded by disruption to the second corridor, the system-wide supply impact grows disproportionately.
US Military Escalation and the Risk of Miscalculation
The US military confirmed a new wave of air strikes on 15 July targeting Iranian capabilities used to disrupt commercial shipping through the Strait of Hormuz. Separately, President Trump indicated in a Fox News interview that energy infrastructure targets remained on the strike planning list, though he framed them as a later-phase escalation option rather than an immediate priority.
The strategic tension here is one that energy security analysts identify as a miscalculation risk. The naval blockade is designed to apply economic pressure on Tehran through export denial. However, strikes on Iranian energy infrastructure could trigger the precise retaliatory scenario — specifically a sustained Hormuz closure — that the blockade strategy is implicitly trying to avoid. The sequencing of military options therefore carries direct energy price consequences that go beyond conventional military risk assessment.
The next major ASX story will hit our subscribers first
Australia's Exposure: LNG Exports and Domestic Fuel Vulnerability
Australia's position in this crisis is layered. As one of the world's largest LNG exporters, Australia competes for Asian buyers in a market where Hormuz disruption affects competing supply flows from the Persian Gulf. LNG transit stalls through the strait following carrier attacks have already been recorded, creating supply gaps in Asian markets that Australian exporters could theoretically benefit from, though at the cost of broader regional energy security instability.
The more immediate domestic concern is Australia's reliance on imported refined petroleum products. Australia does not refine sufficient volumes domestically to insulate retail fuel markets from Brent crude price movements. A sustained elevation of Brent toward the US$100/bbl range translates directly into higher retail petrol and diesel prices, with second-order effects on transport costs and inflation. Australia's energy export challenges are consequently becoming more acute as the crisis extends into the second half of 2026.
Several domestic policy developments are contextually relevant as the crisis deepens:
- Queensland has committed $19 million toward gas and fuel security initiatives, reflecting state-level awareness of supply chain exposure
- Western Australian gas users have been pushing for stronger national reservation scheme protections, an argument that Middle East volatility materially strengthens
- The broader policy debate around energy self-sufficiency versus market exposure has been sharpened by the demonstration that geopolitical fracture can move from latent risk to active disruption within a matter of weeks
Three Scenarios for Energy Markets Through Q4 2026
Scenario 1: Negotiated De-escalation
A new US-Iran framework agreement or restored ceasefire that rebuilds shipping confidence would likely see Brent retreat gradually toward the US$75-80/bbl range as Gulf exports recover. The probability of this outcome has diminished following the collapse of the June memorandum of understanding, which demonstrated how fragile negotiated arrangements remain in the current geopolitical environment.
Scenario 2: Prolonged Stalemate
Continued military pressure without a full Hormuz closure, with Gulf exports stabilising below 50% of pre-war levels, would likely sustain Brent trading in the US$85-100/bbl range through Q4 2026. Key watch indicators include Goldman Sachs export recovery data, the re-entry of marine insurers into Hormuz coverage, and the frequency of US air strike activity.
Scenario 3: Full Strait Closure
A sustained Iranian blockade of the Strait of Hormuz in response to strikes on energy infrastructure represents the tail risk scenario. Under these conditions, as analysts have noted, Brent could spike rapidly toward the US$110-200/bbl range, triggering coordinated IEA strategic reserve releases and forcing emergency policy responses across energy-importing economies globally. In this context, Iran threatens oil exports not merely as a diplomatic signal but as a fully operational instrument of economic coercion.
Market positioning insight: The current futures market is not pricing Scenario 3 as a base case, but the US$8.92/bbl backwardation premium and the 2% intraday price move on 15 July indicate that traders are no longer treating a full Hormuz closure as a remote tail risk. The distance between Scenario 2 and Scenario 3 is determined by decisions being made in Washington and Tehran in real time, with very limited lead time for market adjustment.
Key Data Summary: Iran Oil Crisis at a Glance
| Metric | Data Point |
|---|---|
| Brent crude (15 July session) | US$86.44/bbl (+2%) |
| WTI futures (15 July session) | US$80.77/bbl (+1.8%) |
| Iran crude exports (pre-blockade) | ~2 million bpd |
| Iran crude exports (May 2026) | Under 300,000 bpd |
| Gulf exports vs pre-war levels | Below 50% (~11 million bpd) |
| Goldman Sachs Q4 Brent warning | Above US$110/bbl |
| Extreme scenario price ceiling | Up to US$200/bbl |
| Brent backwardation premium | US$8.92/bbl (widest since 10 June) |
| Estimated Iranian revenue loss | ~$6 billion total; ~$435M/day |
| Strait of Hormuz traffic drop | ~80% on peak disruption days |
Disclaimer: This article contains forward-looking price forecasts and scenario projections sourced from third-party analysts including Goldman Sachs. These represent analytical estimates under specific assumed conditions and should not be treated as investment advice. Energy markets involve significant uncertainty, and actual outcomes may differ materially from any forecast presented here. Readers should conduct independent research and consult qualified financial advisers before making investment decisions.
Readers seeking additional context on Middle East energy corridor risks and Australian petroleum sector developments can explore related industry coverage at petroleumaustralia.com.au, including reporting on Hormuz LNG transit disruptions and domestic gas security policy.
Want to Position Ahead of the Next Major Commodity Discovery?
While geopolitical shocks reshape energy price trajectories, Discovery Alert's proprietary Discovery IQ model scans ASX announcements in real time, delivering instant notifications on significant mineral discoveries across more than 30 commodities — from energy to critical minerals — so subscribers can act on actionable opportunities before the broader market responds. Explore historic discoveries and their extraordinary returns, then begin a 14-day free trial at Discovery Alert to secure a market-leading edge during one of the most volatile commodity cycles in recent memory.