July 26, 2026

How Current Iran War Oil Price Dynamics Challenge Traditional Energy Crisis Frameworks
Global energy markets have evolved substantially since the petroleum-centric disruptions of previous decades, fundamentally altering how geopolitical conflicts transmit economic impact across commodity sectors. The iran war oil prices situation demonstrates how structural diversification of energy portfolios, enhanced strategic reserve systems, and geographic market segmentation create resilience mechanisms that were absent during the oil embargo crises of the 1970s.
Understanding contemporary energy market dynamics requires examining three critical factors: the scope of commodities affected, the magnitude of price increases, and the duration of those increases. This analytical framework distinguishes genuine systemic crises from isolated commodity volatility, providing investors and policymakers with clearer assessment tools for economic risk evaluation.
When big ASX news breaks, our subscribers know first
Current Iran War Oil Price Movements Versus Historical Energy Crisis Precedents
Establishing Modern Energy Crisis Definition Parameters
Contemporary energy market analysis demands precision in crisis classification methodology. A comprehensive crisis framework encompasses three simultaneous elements: commodity scope (single versus multiple energy sources), price magnitude (percentage increases above baseline levels), and temporal duration (days versus quarters of elevated pricing).
The 2021-22 European energy crisis exemplifies multi-factor simultaneity, where oil, natural gas, coal, and electricity markets experienced concurrent price spikes lasting multiple quarters. This contrasts sharply with current iran war oil prices dynamics, where price elevation remains concentrated in crude oil and liquefied natural gas markets.
Current Market Indicators:
• Brent crude trading above $80 per barrel represents 38% below 2022 peak of $130+
• European gas at €50/MWh trades 86% below 2022 record of €350/MWh
• Oil price surge limited to approximately 15% since conflict initiation
• Duration measured in days rather than quarters characteristic of historical crises
The structural evolution of global energy systems since the 1970s fundamentally alters crisis transmission mechanisms. Furthermore, petroleum's role in electricity generation declined from 25% during the 1973-74 crisis to less than 3% currently, reducing single-commodity dependency across developed economies.
Price Magnitude Analysis Against Historical Benchmarks
Current Iran war oil price movements remain within ranges previously considered normal market fluctuations. Brent crude's current levels above $80 per barrel, while elevated from pre-conflict baselines, represent standard trading ranges experienced during non-crisis periods over the past decade.
Historical crisis comparison reveals significant magnitude differences. The 1973-74 oil embargo triggered price increases exceeding 300% over sustained periods, while current movements register modest double-digit percentage gains concentrated in specific commodity sectors. Moreover, this oil price rally analysis provides additional context for understanding today's market dynamics.
Comparative Crisis Magnitude Framework:
| Crisis Period | Primary Commodity | Peak Price Increase | Duration | Market Recovery |
|---|---|---|---|---|
| 1973-74 | Crude Oil | 300%+ | 18 months | 3 years |
| 1979-80 | Crude Oil | 150%+ | 12 months | 2 years |
| 1990-91 | Crude Oil | 100%+ | 6 months | 18 months |
| 2021-22 | Multi-commodity | 400%+ (gas) | 15 months | Ongoing |
| 2026 Iran | Oil/LNG | 15-20% | <1 month | TBD |
Market structure evolution provides additional context for current price movements. Enhanced strategic petroleum reserves, diversified supply chains, and improved emergency response coordination create buffer mechanisms absent during previous crisis periods.
Energy Commodities Experiencing Direct Iran Conflict Impact
Primary Affected Energy Sectors
Iran war oil prices dynamics demonstrate selective market transmission, affecting specific commodity sectors while leaving others largely isolated. Oil and liquefied natural gas markets show direct correlation with conflict escalation, reflecting geographic supply chain vulnerabilities and strategic chokepoint concerns.
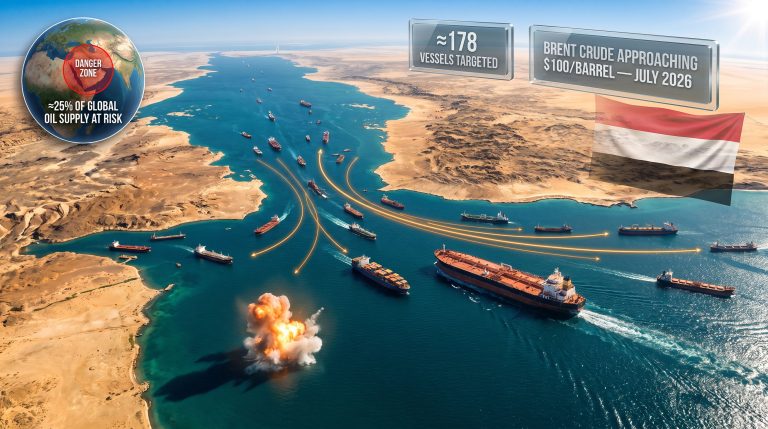
The Strait of Hormuz represents a critical transmission mechanism, with theoretical capacity to disrupt 15-20 million barrels daily through territorial water restrictions. This geographic concentration creates direct linkage between Iranian conflict dynamics and global crude pricing mechanisms.
Affected Commodity Analysis:
• Crude Oil Markets: Brent trading above $80/barrel, representing moderate elevation from pre-conflict levels
• Liquefied Natural Gas: European gas markets experiencing price doubling to €50/MWh
• Refined Petroleum Products: Diesel and jet fuel showing price acceleration exceeding crude movements
• Strategic Reserve Utilisation: Emergency stockpile releases providing market stabilisation
Consequently, refined petroleum products warrant particular attention due to accelerated price movements relative to crude oil benchmarks. This downstream market amplification occurs because refinery capacity constraints create bottlenecks independent of crude supply availability.
Unaffected Energy Market Segments
Energy market segmentation demonstrates remarkable insulation across certain commodity sectors. Coal, electricity, and North American natural gas markets remain largely disconnected from Middle Eastern geopolitical developments, reflecting supply chain diversification and geographic production advantages.
The natural gas price trends illustrate how certain markets maintain independence from Middle Eastern conflicts.
Market Isolation Indicators:
• Asian Coal Markets: Trading at $130/metric ton, 70% below 2022 peak of $440/ton
• European Electricity: German wholesale at €88/MWh, 91% below 2022 crisis peak of €985/MWh
• North American Gas: Henry Hub under $3/mBtu, compared to 2008 peak of $14/mBtu
• Renewable Generation: Spring seasonal factors supporting European grid stability
This market segmentation reflects structural changes in global energy infrastructure over the past five decades. Regional production sufficiency, alternative supply routes, and technological diversification create resilience mechanisms that prevent crisis transmission across all energy sectors simultaneously.
Refined Petroleum Products Present Greater Economic Risk Than Crude Oil
Downstream Market Vulnerability Mechanisms
The fundamental distinction between crude oil trading and refined product markets creates amplified economic risk transmission through downstream channels. Crude oil trades primarily among refiners and strategic buyers, while petrol, diesel, and jet fuel operate in consumer and commercial markets with broader participation and reduced price flexibility.
Refinery configuration constraints amplify product-level price pressures during conflict periods. Refineries engineered for specific crude types (light sweet, medium sour, heavy sour) possess limited flexibility for rapid feedstock switching, creating technological bottlenecks that concentrate price pressure at consumer product levels.
Downstream Risk Factors:
• Product demand inelasticity: Transportation companies cannot defer diesel purchases during price spikes
• Refinery capacity constraints: Limited ability to expand output during supply disruptions
• Commercial aviation exposure: Jet fuel requirements remain fixed regardless of pricing
• Supply chain multiplication: Diesel costs affect logistics across all economic sectors
The transmission mechanism operates through commercial necessity rather than speculative trading. Unlike crude oil markets where storage and redirection provide flexibility, refined products must meet immediate consumer and business demand regardless of pricing conditions.
Consumer Market Transmission Channels
Refined petroleum product price acceleration creates direct economic impact pathways through transportation, logistics, and commercial operations. The real economy purchasing diesel, petrol, and jet fuel experiences immediate cost pressures that crude oil price movements do not directly transmit to end users.
Current market dynamics show refined products rising faster than crude benchmarks, particularly for diesel and jet fuel. This divergence reflects refinery margin expansion during uncertainty periods, when hedging activity and demand acceleration concentrate at processing facilities with limited short-term capacity expansion capability.
"The critical vulnerability lies not in crude oil availability, but in the refining capacity bottlenecks that amplify price transmission to the actual fuel products powering commercial and consumer transportation systems."
Regional refinery utilisation rates become crucial during conflict periods. High utilisation levels reduce flexible capacity available for demand spikes, creating price discovery pressure that exceeds crude cost movements through margin expansion mechanisms.
Worst-Case Economic Scenarios for Prolonged Iran Conflict Escalation
Three-Month Strait of Hormuz Closure Analysis
Extended Strait of Hormuz closure represents the most severe plausible escalation scenario, with potential to disrupt 20 million barrels daily through sustained territorial water restrictions. This volume represents approximately 20% of global oil production, creating supply shortage magnitude comparable to historical crisis periods.
Cascading infrastructure damage scenarios compound baseline disruption impacts. Iranian retaliation targeting Saudi, Kuwaiti, and Emirati production facilities could remove additional 10-15 million barrels daily for extended periods, creating cumulative supply loss approaching 30-35 million barrels daily.
Understanding the broader implications of such scenarios requires examining oil prices and trade wars dynamics that could emerge from prolonged conflict.
Escalation Scenario Modelling:
• Month 1: Strait closure removes 20 million barrels daily, oil prices reach $120-140/barrel
• Month 2: Regional infrastructure damage adds 15 million barrel daily loss, prices exceed $160/barrel
• Month 3: Supply chain disruption affects refinery operations, product shortages emerge
• Recovery Phase: Infrastructure reconstruction requires 12-18 months for full capacity restoration
Economic multiplier effects extend beyond direct energy costs through supply chain disruption, inflation transmission, and demand destruction feedback loops. Transportation-dependent industries face immediate operational constraints, whilst energy-intensive manufacturing confronts input cost pressures that compress profit margins rapidly.
Central Bank Policy Response Implications
Prolonged energy price elevation forces central bank policy dilemmas between inflation control and economic growth support. Interest rate responses to energy-driven inflation create secondary economic contraction risks, particularly in economies with high energy import dependency ratios.
Strategic petroleum reserve coordination becomes critical for crisis management effectiveness. International Energy Agency emergency release protocols provide temporary supply buffer, but sustained disruption requires demand reduction measures and alternative sourcing arrangements that take months to implement fully.
Policy Response Timeline:
• Week 1-2: Emergency strategic reserve releases, coordinated international response
• Month 1: Interest rate policy adjustments, fiscal stimulus considerations
• Month 2-3: Demand reduction policies, alternative energy acceleration programmes
• Long-term: Infrastructure investment, energy security strategy revision
Current Market Fundamentals Differ Substantially From Previous Energy Crises
Structural Energy Market Evolution Since 1970s
Modern energy market architecture demonstrates remarkable diversification compared to petroleum-centric systems of previous crisis periods. Renewable energy capacity, enhanced storage systems, and geographic production distribution create resilience mechanisms absent during historical energy disruptions.
The reduction of oil's role in electricity generation from 25% during the 1973-74 crisis to less than 3% currently represents fundamental structural change. European economies particularly benefit from hydroelectric, nuclear, and renewable generation capacity that operates independently of Middle Eastern supply chains.
Structural Resilience Indicators:
• Energy portfolio diversification: Multiple generation sources reduce single-commodity dependency
• Strategic reserve enhancement: Improved stockpile management and emergency protocols
• Geographic production spread: Reduced concentration in politically volatile regions
• Technology advancement: Enhanced efficiency reduces overall energy intensity requirements
Starting point conditions for current Iran conflict differ markedly from previous crisis environments. Pre-conflict oil inventory levels, seasonal demand patterns, and floating storage availability provide buffer mechanisms that were underdeveloped during 1970s and 1980s disruptions.
2026 Market Conditions Versus Historical Crisis Points
Current market fundamentals include several offsetting factors that distinguish 2026 conditions from previous crisis periods. Millions of barrels of Iranian and Russian oil remained unsold prior to conflict initiation, with tankers maintaining floating storage that provides immediate supply alternatives as buyers emerge.
European market conditions particularly favour resilience against energy disruption. Hydropower reservoir levels remain adequate, spring seasonal patterns support increased solar generation, and diversified import infrastructure reduces dependency on single supply sources.
The OPEC production impact analysis provides additional context for understanding how global production dynamics affect current market conditions.
Favourable Starting Conditions:
• Inventory levels: Above-normal crude and product stockpiles provide initial buffers
• Seasonal factors: Spring timing supports renewable generation increases
• Market balance: Pre-conflict oversupply conditions limit initial price spike magnitude
• Infrastructure capacity: Enhanced import/export flexibility compared to historical periods
The contrast with 2021-22 crisis conditions demonstrates current market strength. That crisis occurred amid French nuclear capacity reductions, European drought affecting hydropower, German panic purchasing, and utility hedging failures that amplified supply constraints across multiple energy sectors simultaneously.
The next major ASX story will hit our subscribers first
Regional Economic Impact Analysis for Investment Strategy
European Market Resilience Assessment
European energy markets demonstrate enhanced resilience compared to previous crisis periods, reflecting infrastructure investment, supply diversification, and policy framework improvements implemented since 2022. Current market indicators suggest substantial buffer capacity against Iran conflict escalation.
Hydropower reservoir management provides critical flexibility during natural gas price elevation. Spring seasonal patterns support increased solar and wind generation capacity, reducing dependency on fossil fuel imports during peak demand periods.
European Resilience Factors:
• Renewable capacity: Solar and wind generation provide import substitution during crisis
• Storage infrastructure: Enhanced LNG import facilities and underground gas storage
• Policy frameworks: Emergency demand reduction protocols and industrial curtailment plans
• Regional coordination: Improved electricity market integration and emergency sharing agreements
German wholesale electricity prices at €88/MWh represent 91% below 2022 crisis peaks, indicating substantial headroom before reaching crisis-level economic impact. This pricing stability reflects diversified generation portfolio and improved emergency management capabilities.
Asian Market Vulnerability Analysis
Asian energy markets present mixed vulnerability profiles during Iran conflict scenarios. Coal price stability provides crucial buffer for China and India, whilst Japan and South Korea face greater exposure through LNG import dependency and limited alternative sourcing flexibility.
Coal markets trading at $130/metric ton maintain 70% below 2022 peak levels, providing cost stability for electricity generation across major Asian economies. This coal price stability insulates Asian manufacturing from energy cost pressures affecting other regions.
Asian Market Dynamics:
• Coal dependency advantage: Stable pricing provides manufacturing cost predictability
• LNG vulnerability: Northeast Asian importers face higher exposure to Middle East disruption
• Strategic reserve utilisation: China and India possess substantial emergency stockpiles
• Alternative sourcing: Australia and Indonesia provide non-Middle Eastern supply options
Regional supply chain alternatives limit Asian market exposure to sustained Iran conflict. Australian LNG exports, Indonesian coal production, and domestic Chinese coal capacity provide supply security independent of Middle Eastern geopolitical developments.
North American Energy Independence Implications
North American energy markets demonstrate remarkable insulation from Iran conflict dynamics, reflecting domestic production sufficiency and limited import dependency. Henry Hub natural gas trading under $3/mBtu illustrates energy cost advantages supporting regional economic competitiveness.
The contrast between North American gas prices and global LNG markets creates arbitrage opportunities for energy-intensive industries. Manufacturing operations benefit from stable, low-cost energy inputs whilst international competitors face elevated costs from conflict-driven price escalation.
North American Advantages:
• Production self-sufficiency: Domestic oil and gas output meets internal demand
• Export opportunity expansion: Higher international prices improve domestic producer margins
• Manufacturing competitiveness: Stable energy costs provide industrial advantage
• Infrastructure isolation: Limited physical connection to conflict-affected supply chains
Energy dominance positioning creates investment opportunities through differential cost structures. North American companies operating energy-intensive processes gain competitive advantages when international competitors face elevated input costs from geopolitical disruption.
Duration Analysis of Iran War Oil Price Premium Sustainability
What Determines Short-Term Price Premium Duration?
Current Iran war oil prices reflect market psychology and fundamental supply concerns in approximately equal measure. The $14/barrel risk premium above pre-conflict baseline represents moderate geopolitical pricing that remains within historical normal ranges for Middle Eastern uncertainty.
Speculative trading influence amplifies initial price discovery during conflict initiation phases. Market participants typically overestimate immediate disruption risk whilst underestimating adaptive capacity and alternative sourcing flexibility available within modern energy markets.
Price Premium Analysis:
• Current risk premium: Approximately $14/barrel above pre-conflict baseline
• Historical comparison: Moderate relative to previous Middle Eastern conflict premiums
• Speculative component: Estimated 40-50% of current premium attributed to trading psychology
• Fundamental component: 50-60% reflects actual supply chain disruption risk assessment
Market psychology during initial conflict phases typically produces price overshooting followed by gradual normalisation as participants assess actual versus perceived disruption magnitude. This pattern suggests current premiums may moderate absent escalation confirmation.
Graduated Escalation Timeline Impacts
Duration scenarios depend critically on conflict escalation pathways and international response coordination. Limited strike scenarios suggest price normalisation within 4-6 weeks, whilst sustained infrastructure targeting could maintain elevated pricing for quarters.
Goldman Sachs four-week disruption projections assume limited conflict scope without regional infrastructure damage. These projections model $15/barrel price increases during active conflict phase, followed by gradual decline as markets adjust to actual supply availability.
Escalation Duration Matrix:
| Conflict Scope | Duration | Price Impact | Recovery Timeline |
|---|---|---|---|
| Limited Strikes | 2-4 weeks | +$10-15/barrel | 6-8 weeks |
| Strait Disruption | 6-12 weeks | +$20-30/barrel | 3-6 months |
| Infrastructure Targeting | 3-6 months | +$40-60/barrel | 12-18 months |
| Regional War | 6+ months | +$70+/barrel | 2+ years |
De-escalation pathway analysis suggests price normalisation occurs through stages: initial ceasefire announcements, supply chain restoration, inventory rebuilding, and market confidence recovery. Each stage typically requires 4-8 weeks for full price transmission.
Investment Strategy Considerations for Iran War Oil Price Volatility
Energy Sector Portfolio Positioning
Iran conflict dynamics create differentiated investment opportunities across energy sector segments. Upstream oil producers benefit from elevated crude pricing, whilst downstream refiners face margin compression from accelerated product price increases relative to crude cost movements.
Geographic diversification becomes crucial for energy investment portfolios during geopolitical uncertainty. North American producers offer conflict insulation, whilst Middle Eastern exposure provides higher returns with elevated political risk profiles.
Sector-Specific Investment Implications:
• Upstream Production: Benefit from crude price elevation, particularly conflict-insulated regions
• Midstream Infrastructure: Pipeline and storage companies gain from volatility and rerouting needs
• Downstream Refining: Mixed signals from margin expansion versus operational disruption risk
• Renewable Energy: Accelerated adoption timeline from energy security considerations
Renewable energy investment acceleration occurs during sustained fossil fuel price elevation periods. Government policy support, corporate energy security strategies, and economic competitiveness improvements drive capital allocation toward alternative energy infrastructure.
Inflation Hedge and Currency Considerations
Energy commodity exposure through ETFs and futures provides portfolio inflation hedging during conflict-driven price increases. However, duration uncertainty requires careful position sizing and exit strategy planning to avoid extended volatility exposure.
Currency hedging becomes critical for international energy investments during geopolitical uncertainty. Dollar strength during crisis periods affects energy company valuations differently based on revenue denomination and operational geography.
Investment Risk Management:
• Position sizing: Limited allocation to conflict-sensitive energy exposure
• Duration management: Clear exit strategies for temporary conflict-driven positions
• Currency hedging: International energy investments require foreign exchange protection
• Diversification: Geographic and sector spread limits concentration risk
Real asset allocation adjustments should consider energy's role within broader inflation protection strategies. Commodity exposure provides valuable diversification, but concentration risk requires balanced portfolio construction across multiple asset classes.
Will We See 2022-Style Global Inflation Resurgence?
Multi-Commodity Crisis Requirements
Replicating 2022-style inflation shock requires simultaneous price elevation across oil, natural gas, coal, and electricity markets for sustained periods. Current Iran conflict affects limited commodity scope, reducing systemic inflation transmission compared to comprehensive energy crisis scenarios.
The 2021-22 crisis emerged from multiple simultaneous contributing factors: reduced French nuclear output, European drought affecting hydropower, German emergency purchasing policies, and utility company hedging failures. These compounding elements created crisis magnitude exceeding any single geopolitical event.
Understanding the relationship between tariff policies and inflation provides important context, as seen in US inflation and tariffs analysis.
Inflation Transmission Requirements:
• Commodity breadth: All major energy sources must experience price elevation simultaneously
• Duration persistence: Price increases must last quarters rather than weeks for inflation embedding
• Economic transmission: Energy costs must transmit through supply chains to consumer prices
• Policy accommodation: Central bank responses must balance inflation versus growth concerns
Current market conditions show isolated commodity impact rather than comprehensive energy crisis characteristics. Coal price stability, North American gas market isolation, and European electricity price resilience limit inflation transmission pathways compared to 2022 precedent.
Central Bank Preparedness Assessment
Central bank policy response capacity differs significantly between current conditions and 2022 crisis period. Enhanced strategic coordination, improved emergency protocols, and lessons learned from previous energy shocks provide better crisis management tools.
Interest rate policy faces complex tradeoffs during energy-driven inflation episodes. Aggressive monetary tightening risks demand destruction and economic contraction, whilst accommodation allows inflation expectations to become embedded in wage and pricing decisions.
Policy Response Framework:
• Strategic reserve coordination: International Energy Agency emergency release protocols
• Monetary policy balance: Inflation targeting versus growth protection considerations
• Fiscal policy support: Targeted energy assistance versus broad economic stimulus
• International coordination: Enhanced cooperation mechanisms since 2022 crisis experience
The key distinction lies in crisis scope and duration. Single-commodity disruptions allow targeted policy responses, whilst multi-commodity crises require comprehensive economic policy adjustment with higher recession risk acceptance.
Long-Term Energy Security and Investment Implications
Strait of Hormuz Dependency Reduction Strategies
Iran conflict highlights persistent global energy infrastructure vulnerability through geographic chokepoint concentration. Long-term energy security requires systematic dependency reduction through alternative transportation routes, pipeline diversification, and regional production capacity expansion.
Alternative shipping route development presents substantial investment opportunities in pipeline infrastructure, Arctic shipping capabilities, and overland transportation networks. These projects require decade-long development timelines but provide strategic value independent of specific geopolitical events.
According to Guardian analysis on oil prices and shipping disruptions, the Strait of Hormuz remains a critical vulnerability point for global energy security.
Infrastructure Development Priorities:
• Pipeline diversification: Alternative routes bypassing Middle Eastern chokepoints
• Arctic shipping: Year-round navigation capabilities reducing dependency on traditional routes
• Storage expansion: Strategic reserve enhancement for emergency supply security
• Production capacity: Regional development reducing import dependency ratios
Regional production capacity expansion creates investment opportunities in previously overlooked geographic areas. Countries with substantial unexplored reserves gain strategic importance as supply chain diversification becomes national security priority.
Accelerated Energy Transition Timeline Adjustments
Sustained geopolitical energy risk accelerates renewable energy investment and policy support across developed economies. Energy independence considerations drive political support for alternative energy infrastructure exceeding pure economic optimisation calculations.
Technology deployment timeline acceleration occurs through enhanced government support, corporate energy security strategies, and improved economic competitiveness during fossil fuel price elevation periods. This creates investment opportunities in renewable energy infrastructure, storage technology, and grid modernisation projects.
Bloomberg's energy market analysis highlights how geopolitical tensions accelerate clean energy adoption timelines.
Transition Investment Implications:
• Government policy acceleration: Enhanced support for domestic renewable capacity
• Corporate strategy shifts: Energy security considerations in technology adoption decisions
• Grid infrastructure: Massive investment requirements for renewable integration
• Storage technology: Battery and alternative storage solutions gain strategic importance
The intersection of energy security and climate policy creates unprecedented investment opportunities in clean energy infrastructure. Geopolitical risk provides additional justification for transition investments beyond environmental considerations alone.
Investment Disclaimer: This analysis contains forward-looking statements and speculative scenarios based on current market conditions and geopolitical assessments. Energy markets involve substantial volatility, and actual outcomes may differ significantly from projections presented. Past performance does not guarantee future results. Investors should conduct independent research and consult financial advisors before making investment decisions based on this analysis.
Ready to Capitalise on the Next Energy Market Discovery?
Discovery Alert's proprietary Discovery IQ model delivers real-time alerts on significant ASX mineral discoveries, instantly empowering subscribers to identify actionable opportunities ahead of the broader market. Understand why major mineral discoveries can lead to significant market returns by exploring Discovery Alert's dedicated discoveries page, showcasing historic examples of exceptional outcomes, and begin your 14-day free trial today to position yourself ahead of the market.