June 13, 2026
The Structural Forces Behind Aluminium's Exchange Inventory Crunch
Global commodity markets have spent years recalibrating around a simple but powerful truth: physical availability, not just production capacity, determines price. In aluminium, this distinction matters more than almost any other base metal. The metal's energy-intensive production cycle, geographic concentration of smelting infrastructure, and deep integration with manufacturing supply chains mean that when exchange-registered stocks begin contracting, price signals travel fast and far across the entire forward curve.
That dynamic is playing out with unusual intensity right now. The LME aluminium price rallies on falling stocks narrative has shifted from a short-term technical observation into a structurally significant market development, with data from May 19, 2026 underscoring just how rapidly the physical availability picture is deteriorating.
When big ASX news breaks, our subscribers know first
Understanding the Inventory-Price Engine in Aluminium Markets
LME warehouse stocks serve a function that is often misunderstood by observers outside the metals trading world. They are not simply a storage figure; they are a real-time proxy for how much immediately deliverable metal exists within the exchange ecosystem. When those stocks shrink, the market's ability to absorb sudden physical demand surges diminishes, and prices adjust accordingly.
Two metrics within the LME inventory system carry particular analytical weight: live warrants and cancelled warrants.
- Live warrants represent metal held in LME-registered warehouses that is immediately available for delivery against a futures contract.
- Cancelled warrants represent metal whose owner has formally requested physical withdrawal. Once cancelled, that tonnage is no longer accessible to other market participants through the exchange system.
The ratio between cancelled and total warrants functions as a leading indicator of near-term supply tightness. When cancellations rise sharply relative to total stock, it signals that physical buyers are pulling metal out of the system at an accelerating rate, which means the pool of available live warrants will shrink further in coming sessions.
May 19, 2026: A Snapshot of a Market Under Physical Stress
The inventory data from the May 18 to May 19 session revealed a pattern that is difficult to interpret as anything other than a meaningful tightening signal.
| Inventory Metric | May 18 | May 19 | Change |
|---|---|---|---|
| Opening Stock | 344,000 t | 341,775 t | -0.65% |
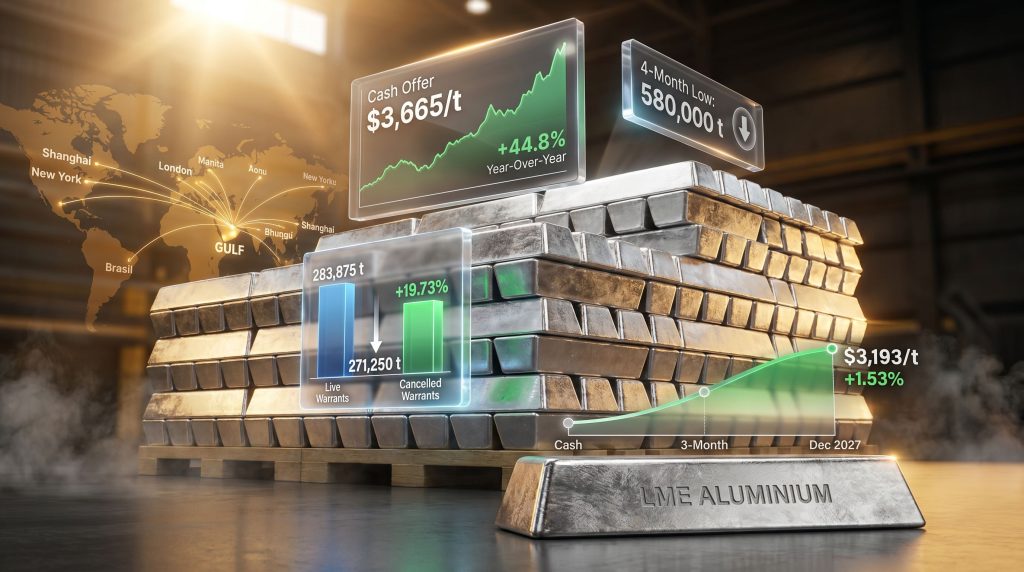
| Live Warrants | 283,875 t | 271,250 t | -4.45% |
| Cancelled Warrants | 57,900 t | 69,325 t | +19.73% |
A near-5% single-session drop in live warrants is not a routine fluctuation. It represents a meaningful compression of the metal that could theoretically be called upon for delivery. Simultaneously, cancelled warrants surged by nearly 20% in a single session, representing approximately 20.3% of total opening stock on May 19. This is a materially elevated cancellation ratio.
Furthermore, LME aluminium stocks are widely projected to continue falling, adding further weight to the directional narrative emerging from these sessions.
When cancelled warrants account for more than one-fifth of total exchange stock in a single session, the market is effectively signalling that physical demand is outpacing the rate at which fresh metal is arriving at LME-registered warehouses. This is the kind of structural imbalance that produces sustained directional moves rather than temporary price spikes.
Total LME aluminium exchange stocks have reached a 4-month low, with combined on-warrant and cancelled tonnage sitting near 580,000 tonnes, a multi-month trough that provides essential context for interpreting the price moves across the forward curve.
How to Read Warrant Data as a Forward Supply Signal
For market participants unfamiliar with the mechanics, here is a step-by-step framework for interpreting LME warrant data as a supply signal:
- Establish the baseline: Identify the current level of live warrants as the starting point for available physical supply within the LME system.
- Track the cancellation flow: Monitor the daily change in cancelled warrants. Rising cancellations indicate that metal owners are requesting physical delivery.
- Calculate the cancellation ratio: Divide cancelled warrants by total opening stock. A ratio above 15-20% in a single session is historically associated with accelerating drawdown conditions.
- Project the forward trajectory: If cancellations persistently outpace fresh warrant creation (new metal entering LME warehouses), total stocks will continue declining over subsequent sessions and weeks.
- Connect to price structure: Sustained inventory drawdowns historically compress the spread between cash and forward prices, sometimes pushing the market into backwardation, where near-term delivery commands a premium over future-dated contracts.
Physical market intelligence suggests that buyers are already paying a reported $40 per tonne premium for near-term delivery over the LME benchmark, a figure that reflects how access to prompt physical metal has become genuinely constrained.
LME Aluminium Price Performance Across the Forward Curve
The price data from May 19, 2026 is notable not just for its direction but for what the shape of the move reveals about market positioning and medium-term expectations. Understanding the aluminium forward curve and its relationship to cancelled warrants is increasingly central to interpreting these signals accurately.
| Contract | May 18 Price (USD/t) | May 19 Price (USD/t) | % Change |
|---|---|---|---|
| Cash Bid | $3,635 | $3,664 | +0.80% |
| Cash Offer | $3,637 | $3,665 | +0.80% |
| 3-Month Bid | $3,563 | $3,611 | +1.35% |
| 3-Month Offer | $3,565 | $3,612 | +1.32% |
| Dec 2027 Bid | $3,145 | $3,193 | +1.53% |
| Dec 2027 Offer | $3,150 | $3,198 | +1.52% |
| Asian Ref. Price (3M) | $3,569 | $3,602 | +0.92% |
The most analytically significant feature of this data is that December 2027 contracts posted the steepest percentage gains of the session, up 1.52-1.53%, outperforming both cash and three-month contracts. In typical short-term squeeze conditions, the opposite pattern tends to prevail: nearby contracts surge while long-dated prices move less aggressively. When the back end of the curve leads the rally, it indicates that market participants are pricing in structural tightness over the medium term, not just a transient physical bottleneck.
This is a critically different signal. It suggests that traders and producers are revising their multi-year supply assumptions upward in terms of tightness, which has implications for capital allocation decisions across the entire aluminium value chain.
The LME aluminium three-month Asian Reference Price, which closed at $3,602 per tonne on May 19 (up 0.92% from $3,569 the prior session), serves as the benchmark underpinning physical contract pricing across Asia-Pacific trade flows. This price point is central to how fabricators, distributors, and end-users in the region lock in procurement costs, making its upward trajectory a direct cost pressure for downstream manufacturers from Japan to Southeast Asia.
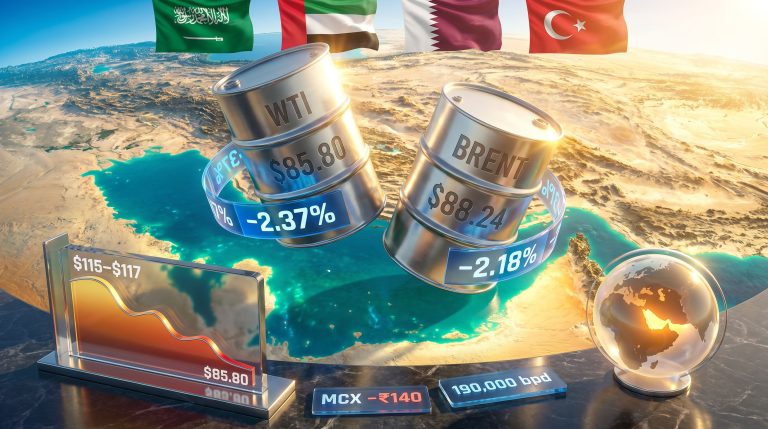
Geopolitical Risk Premium: The Gulf Factor in Aluminium Pricing
No analysis of the current aluminium price environment is complete without addressing the geopolitical dimension that has injected a significant risk premium into the market. The Gulf region plays a structurally important role in global aluminium supply that is frequently underestimated by market observers focused primarily on Chinese production data. In addition, US tariffs on aluminium have already reshaped trade flows in ways that amplify the sensitivity of LME prices to any further supply disruption.
Aluminium smelting is one of the most energy-intensive industrial processes in existence, with energy costs comprising approximately 35-40% of total primary aluminium production costs. The Gulf region hosts some of the world's largest and lowest-cost smelters precisely because of access to cheap natural gas. Any credible threat to that infrastructure carries outsized price implications.
Geopolitical tensions involving Iran and the potential for military escalation in the Gulf region created an acute supply shock narrative that sent LME aluminium futures surging as much as 6% to approximately $3,492 per tonne in the immediate aftermath of reported missile strike threats on major Gulf smelting infrastructure. Unlike demand-driven price moves that build gradually, supply shock narratives in energy-intensive metals can produce single-session price dislocations that are both rapid and difficult to hedge against.
The downstream effect of this risk premium extends beyond futures pricing. Equities of globally listed aluminium producers have responded positively to the same supply disruption narrative, as investors price in both higher aluminium realisations and the potential for market share gains if Gulf production is disrupted.
Where Current Prices Sit in a Multi-Year Historical Context
The current rally does not exist in isolation. Understanding its significance requires placing it within the longer arc of aluminium price history.
| Reference Point | Price (USD/t) | Context |
|---|---|---|
| Recent Multi-Year High | ~$3,676 | Highest level since March 2022 |
| May 19, 2026 Cash Offer | $3,665 | +0.80% single-session gain |
| Late-April 2026 Low | ~$3,530 | Pre-rally base |
| Year-Over-Year Change | ~+44.8% | Structural re-rating in progress |
The approximately 44.8% year-over-year price appreciation is not a number that can be explained by short-term inventory fluctuations alone. It reflects a genuine structural re-rating of aluminium's value proposition, driven by the convergence of energy transition demand (aluminium is central to electric vehicle manufacturing, grid infrastructure, and renewable energy hardware), constrained new smelting capacity additions outside of China, and persistent logistics and supply chain fragilities exposed during the post-pandemic period.
The comparison to the March 2022 price spike, which was driven by the Russia-Ukraine conflict and the resulting European energy crisis, is instructive. That rally was primarily an energy cost shock that compressed smelter margins globally and threatened capacity curtailments. The current dynamic has a different character: it is being driven by a combination of physical inventory depletion, geopolitical supply risk, and medium-term demand confidence, which is a more durable combination of price supports.
Headwinds and Risk Factors That Bulls Cannot Ignore
A balanced assessment of the aluminium market requires equal attention to the forces that could constrain or reverse the current rally.
Chinese Domestic Market Dynamics
China accounts for more than half of global primary aluminium production and consumption. Elevated domestic inventories within China's own warehouse system, combined with periods of subdued downstream manufacturing activity, represent a structural counterweight to LME price strength. If Chinese smelters redirect export volumes toward the LME system, it could replenish exchange stocks and dampen the inventory-driven price narrative.
Profit-Taking Vulnerability
After a ~44.8% year-over-year price appreciation, speculative long positions are technically exposed. Any combination of geopolitical de-escalation in the Gulf, positive Chinese demand disappointment, or broader risk-off sentiment in commodity markets could trigger rapid long unwinding that temporarily reverses recent gains. Consequently, commodities market volatility remains a key risk that participants across the value chain must actively hedge against.
Alumina Price Stability as a Double-Edged Signal
The LME alumina Platts price remained unchanged at USD $305.40 per tonne on May 19, 2026. This stable feedstock cost environment means that smelter margins at current aluminium prices are exceptionally wide. While this is positive for producer earnings in the near term, it also creates an economic incentive to restart idled smelting capacity, which would eventually add supply pressure back into the market. The Alcoa downgrade impact on alumina markets further illustrates how feedstock pricing dynamics can shift rapidly in response to corporate decisions.
Wide smelter margins created by rising aluminium prices against stable alumina costs are a self-correcting mechanism in the long run. History suggests that sustained margin expansion at the primary production level tends to attract capacity restarts within 12-18 months, gradually rebalancing the supply picture.
Investment Flow Dependency
A portion of the current rally reflects broad commodity investment flows rather than pure physical tightness. Passive commodity index rebalancing, managed money positioning, and macro hedge fund exposure to the metals complex can amplify price moves in both directions. When these flows reverse, they do so independently of physical fundamentals, which creates headline volatility that does not always reflect genuine changes in the supply-demand balance. ING's industrial metals analysis highlights this point, noting that further downside risk for aluminium remains a possibility should investment flows retreat.
The next major ASX story will hit our subscribers first
Strategic Implications for Different Market Participants
The current market configuration presents different risks and opportunities depending on where a participant sits in the aluminium value chain.
For Physical Buyers and Downstream Manufacturers
- Rising cash prices combined with shrinking live warrant availability increases the urgency of securing forward procurement commitments.
- The $40/t near-term delivery premium signals that waiting for prices to fall before purchasing physical metal carries meaningful cost risk.
- Three-month LME contracts offer a hedging tool to lock in cost certainty as the cash-to-forward spread evolves, particularly given the uncertainty around how long the Gulf risk premium persists.
For Investors and Commodity Traders
- The simultaneous upward move across cash, three-month, and December 2027 contracts reflects broad-based market conviction rather than a localised short-term squeeze.
- Live warrant data, updated daily by the LME, is the single most important leading indicator for whether the inventory-driven component of the rally has further structural support.
- Chinese manufacturing PMI data, downstream aluminium demand surveys, and SHFE (Shanghai Futures Exchange) warehouse stock movements serve as the primary macro cross-checks against the LME narrative.
For Primary Producers and Smelters
- At current aluminium prices with stable alumina feedstock costs, operating margins are at multi-year highs for smelters with uninterrupted power access.
- Capital allocation decisions should be stress-tested against a scenario in which Gulf geopolitical tensions de-escalate and the risk premium currently embedded in aluminium prices dissipates over a 3-6 month horizon.
- The structural argument for new capacity investment remains more nuanced than spot prices alone suggest, given the energy transition timeline uncertainty and the potential for Chinese export policy shifts. Furthermore, reviewing the top aluminium mining companies provides useful context for understanding which producers are best positioned to capitalise on the current margin environment.
FAQ: LME Aluminium Price Rally and Falling Inventories
What is causing the LME aluminium price rally in 2026?
The rally reflects a convergence of falling LME exchange inventories now at a 4-month low, a sharp surge in cancelled warrants pointing to accelerating physical drawdowns, geopolitical supply disruption risk centred on Gulf region smelting infrastructure, and broad commodity investment flows lifting the metals complex.
What does a rise in cancelled warrants mean for aluminium prices?
Cancelled warrants signal that metal holders are formally requesting physical withdrawal from LME warehouses. A 19.73% single-session surge in cancelled warrants, as recorded on May 19, 2026, indicates intensifying physical demand and points toward further inventory depletion, a condition that is historically associated with sustained upward price pressure. The LME aluminium price rallies on falling stocks precisely because of this mechanism.
Why did December 2027 aluminium contracts rise more than cash prices?
The December 2027 contracts posted the steepest session gain at +1.53%, which is a structurally bullish signal. It indicates that market participants are revising medium-term supply assumptions toward tightness, rather than interpreting the current inventory drawdown as a short-lived technical event.
What is the LME aluminium Asian Reference Price?
The three-month Asian Reference Price is a benchmark derived from LME futures pricing that underpins physical aluminium contracts across Asia-Pacific markets. On May 19, 2026, it closed at $3,602 per tonne, up 0.92% from the prior session, making it a direct input into procurement costs for fabricators and manufacturers across the region.
What is the current LME alumina price?
LME alumina, priced using the Platts benchmark, remained unchanged at USD $305.40 per tonne on May 19, 2026. The stability of feedstock costs against sharply rising aluminium prices reflects significant margin expansion for primary smelters, though this dynamic carries its own longer-term supply implications. The impact on steel markets from related tariff measures also provides useful comparative context for how supply-side pressures ripple across base metal markets.
Disclaimer: This article contains forward-looking analysis, price projections, and market commentary based on publicly available data as of May 19, 2026. It does not constitute financial or investment advice. Commodity markets involve significant risk, and past price performance is not indicative of future results. Readers should conduct independent research and seek professional advice before making any investment or procurement decisions.
Want to Stay Ahead of the Next Major Commodity Discovery?
While aluminium's structural tightening signals are unfolding across LME warrant data and forward curves, Discovery Alert's proprietary Discovery IQ model scans ASX announcements in real time, instantly identifying significant mineral discoveries across 30+ commodities — including those tied to the energy transition metals driving today's supply squeeze. Explore historic discoveries and their market returns, then begin your 14-day free trial to position yourself ahead of the broader market.