
May 20, 2026
The Hidden Architecture of Precious Metals Price Floors
Most market participants fixate on price direction. They want to know whether gold is going up or down, whether silver will recover, and whether the dollar has peaked. But this framing misses the more structurally important question: not where prices are heading, but whether the buyers who are supposed to defend key levels are actually showing up. That distinction sits at the heart of how precious metals support levels and dollar strength interact in today's technically demanding environment.
Understanding how price floors form, why some hold and others collapse, and what macro forces are amplifying every technical signal right now is essential for anyone navigating gold, silver, platinum, and palladium in 2025 and beyond.
When big ASX news breaks, our subscribers know first
Why the U.S. Dollar's Structural Weakness Is the Most Important Macro Force in Precious Metals Right Now
The Dollar's Historic Decline: Putting the Numbers in Context
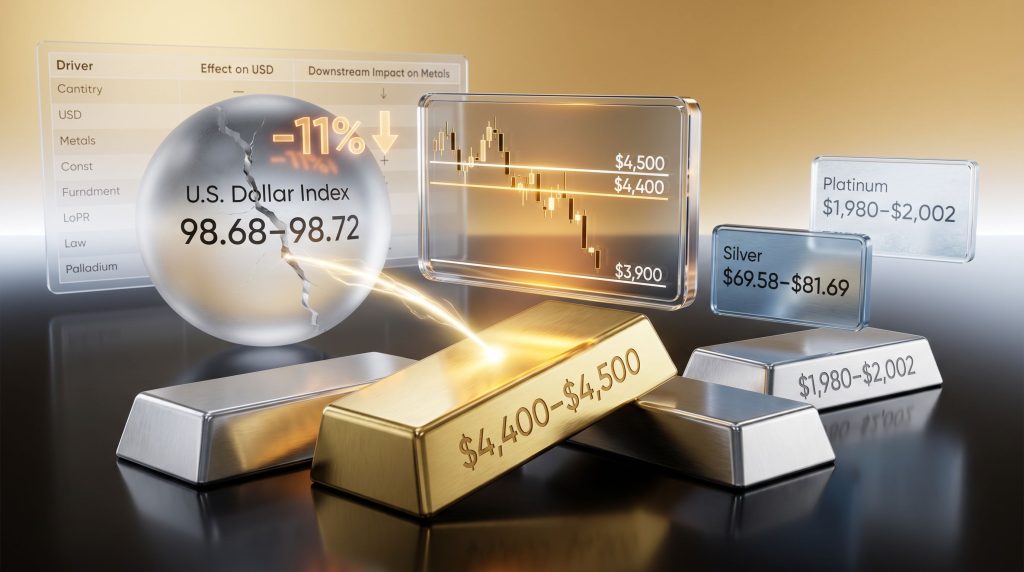
The U.S. dollar's trajectory in the first half of 2025 was not a routine correction. According to Morgan Stanley, the dollar recorded approximately an 11% decline across the first six months of 2025, marking its worst first-half performance since 1973. JPMorgan independently confirmed the scale of this move, citing a 10.7% first-half drop as the steepest in over five decades.
This matters enormously for precious metals because all four major metals — gold, silver, platinum, and palladium — are globally priced in U.S. dollars. When the dollar weakens structurally, non-U.S. buyers gain effective purchasing power, which mechanically supports demand and underpins higher price levels. This is not a short-term sentiment dynamic; it is a structural repricing mechanism that operates across every international metals market simultaneously.
What Drives Dollar Strength or Weakness? A Multi-Variable Framework
The dollar's direction is rarely determined by a single variable. Understanding the interaction between these forces helps traders interpret whether a given dollar move represents durable trend change or short-term noise. Furthermore, gold and bond dynamics often shift in tandem with these dollar movements, making cross-asset awareness essential.
| Driver | Effect on USD | Downstream Impact on Metals |
|---|---|---|
| Rising U.S. interest rates | Strengthens USD | Headwind for precious metals |
| Persistent trade deficits | Weakens USD | Tailwind for precious metals |
| Declining investor confidence in U.S. assets | Weakens USD | Tailwind for precious metals |
| Real yield compression | Weakens USD | Strong tailwind for gold |
| Short-term technical pullbacks | Neutral | Temporary relief for metals |
Key Insight: A short-term dollar retracement does not necessarily indicate a structural reversal. Traders who mistake a technical pullback for a trend change risk repositioning prematurely in metals, only to face renewed pressure if the dollar recovers its footing. The dollar's broader technical structure can remain bullish even when it pulls back toward support.
Historically, the most powerful driver of gold demand is real yield compression — the scenario where nominal interest rates fail to keep pace with inflation, eroding the true return on fixed-income assets and redirecting capital toward hard assets. This dynamic, combined with persistent trade deficits and softening institutional confidence in U.S. fiscal policy, creates a multi-layered tailwind for precious metals that is considerably more durable than a simple dollar-weakness narrative. In addition, central bank gold demand has reinforced this structural shift, with institutional accumulation providing an additional layer of price support beneath market-driven demand.
How Precious Metals Support Levels Form and Why They Matter
The Technical Architecture Behind Price Floors
Support levels are not arbitrary lines drawn on a chart. They represent price zones where historical buying activity has been concentrated enough to arrest downward momentum. In precious metals markets, these zones tend to cluster around several identifiable structural features:
- Psychologically significant round numbers such as $4,500 in gold or $2,000 in platinum, where retail and institutional traders alike tend to concentrate limit orders
- Prior consolidation ranges, where the market spent extended time digesting a prior move, leaving behind a dense concentration of historical transaction activity
- Technically significant moving averages, which algorithmic systems often use as reference points for automated execution
- Unfilled gap zones, which act as magnetic targets as the market attempts to reconcile prior price discontinuities
One of the more analytically precise signals in current precious metals markets involves the failure to close bearish gaps. A bearish gap occurs when a market opens significantly lower than its prior close, leaving an untraded price range on the chart. When buyers repeatedly attempt to push price back into that gap and fail to achieve a closing recovery, it signals that selling pressure remains structurally dominant even during intraday relief rallies.
Why Today's Closing Prices Function as Verdict Moments
Technical Principle: The daily closing price carries far more analytical weight than any intraday price movement. An intraday dip below support that recovers by the close is treated as noise. A confirmed close below a defined support zone is treated as signal, typically triggering additional selling from algorithmic systems and activating stop-loss orders in subsequent sessions. The difference between these two outcomes can define a metal's directional trend for weeks.
This is why, across all four precious metals currently in focus, the phrase today's close carries such weight. Proximity to a support level creates the possibility of a reversal. Only confirmed buyer participation at that level, demonstrated through a strong closing price, transforms that possibility into a statistically meaningful probability.
Where Is Gold's Critical Support Zone in 2025?
Mapping the $4,400 to $4,500 Battleground
Gold's primary support cluster currently sits within the $4,400 to $4,500 range, with the $4,500 level carrying the heaviest psychological significance. Independent futures pivot analysis places gold's key architectural zone between approximately $4,439.87 and $4,650.07, broadly confirming the technical levels that active traders are monitoring.
As long as gold sustains daily closes within this support band, the near-term bullish structure remains constructive. The $4,500 level is not merely a round number — it represents a zone where prior buying conviction was demonstrated at scale, giving it a layered technical significance that purely arbitrary levels lack.
Bullish vs. Bearish Scenario Framework for Gold
| Scenario | Trigger Condition | Price Target |
|---|---|---|
| Bullish continuation | Daily close sustained above $4,500 | Retest of prior highs |
| Neutral / range-bound | Price oscillates within $4,400 to $4,500 | No directional resolution |
| Bearish breakdown | Confirmed daily close below $4,400 | $3,900 zone and potentially lower |
A confirmed breakdown below $4,400 would redirect analytical attention toward the $3,900 zone as the next meaningful downside reference. This is not a prediction but a conditional scenario that traders should have mapped in advance, allowing them to respond systematically rather than reactively. Gold as a safe haven continues to attract capital during periods of dollar uncertainty, however, which makes outright bearish conclusions premature without confirmed technical evidence.
Silver's Support Architecture: Is the $70 to $71.50 Zone Holding?
The Technical Case for Silver's Near-Term Floor
Silver occupies a unique position within the precious metals complex. Silver's dual nature as both a monetary metal and an industrial commodity means its price dynamics reflect financial market sentiment and real-economy demand signals from sectors including solar panel manufacturing, electronics, and medical technology. This makes silver both more volatile and more informationally rich than gold alone.
From a purely technical standpoint, silver's most closely watched support sits in the $70 to $71.50 range. Futures pivot analysis independently identifies silver's key structural range between approximately $69.58 and $81.69, with the lower boundary aligning closely with the zone that technical analysts are currently prioritising.
The failure to close open bearish gaps on silver's chart mirrors the pattern visible across platinum and represents a technically meaningful warning that buyers have not yet demonstrated the conviction required to reclaim upside momentum. Consequently, examining the gold-silver ratio analysis provides additional context about the relative positioning of these two metals.
What a Silver Support Failure Would Signal
- A confirmed daily close below $70 would likely accelerate selling pressure toward a deeper corrective target in the $50 to $54 range
- This outcome would also generate negative sentiment implications for the broader precious metals complex, given silver's role as a risk appetite barometer within the sector
- Silver's industrial demand component provides some underlying support that purely monetary metals lack, but this factor operates over longer timeframes and does not provide meaningful short-term price protection during technically driven selloffs
Platinum's Precarious Position: What the Bearish Gap Failure Means
Technical Deterioration in the Platinum Market
Platinum's technical picture is currently the most concerning across the four major precious metals. The metal has repeatedly failed to close its bearish gap, and each failed attempt reinforces seller dominance while progressively depleting the buying energy available to mount a sustained recovery. This pattern is not simply a signal of weak demand; it reflects a structural shift in the balance of order flow between buyers and sellers.
Platinum has also broken back below its key support line, a development that changes the technical context from one of consolidation to one of potential continuation lower. The $1,980 to $2,002 zone now represents the threshold that buyers must reclaim on a closing basis to meaningfully alter the current trajectory.
Platinum Decision Matrix for Traders
| Price Action | Interpretation | Next Key Level |
|---|---|---|
| Close above $2,002 and gap closure | Bullish signal; momentum shift | $2,048 rebound target |
| Oscillation below $2,002 | Continued bearish control | $1,980 to $2,002 as resistance |
| Daily close below current support | Bearish acceleration | $1,800 support zone |
Risk Warning: Platinum is currently in a technically vulnerable position. Without a strong close above the $2,000 level, the path of least resistance remains to the downside. The $1,800 area represents the next significant floor, but reaching it would represent a substantial decline from current levels and would likely trigger reassessment of medium-term positioning across the platinum group metals complex.
It is worth noting that platinum's industrial demand profile, heavily concentrated in catalytic converter manufacturing and hydrogen fuel cell technology, does provide a fundamental demand floor that purely financial assets lack. However, near-term technical breakdowns can significantly outpace fundamental repricing timelines, meaning fundamental support offers little practical protection during a technically driven decline.
The next major ASX story will hit our subscribers first
Palladium's Downside Scenario Has Played Out: What Comes Next?
How the Bearish Thesis Unfolded: A Case Study in Scenario Modelling
Palladium offers a valuable case study in the analytical utility of pre-defined scenario frameworks. Prior technical analysis identified the bullish gap between $1,481 and $1,494 as the critical line of defence for palladium bulls. The thesis was explicit: if that gap closed, the market would likely move rapidly toward the lower boundary of the consolidation zone, with downside targets of $1,425 or $1,387 emerging as sequential objectives.
The market followed this bearish trajectory with notable precision, validating the scenario framework and demonstrating why pre-defined conditional targets serve traders more effectively than reactive price-chasing.
Palladium's Current Position: The Last Line of Defence
Palladium has now declined into the $1,357 to $1,375 green support zone, which technical analysis identifies as the final meaningful buffer before the March low comes into focus. This is not a zone that can be treated as a guaranteed bounce level; it is a zone where the probability of a buyer response increases meaningfully, but where outcome remains conditional on actual demonstrated buying conviction.
Palladium Scenario Table
| Outcome | Condition | Implication |
|---|---|---|
| Technical rebound | Buyers defend $1,357 to $1,375 on close | Short-term recovery possible |
| Continued decline | Daily close below $1,357 | Downside continuation toward $1,315 |
| Deeper bear case | Break of March low | Structural downtrend confirmation |
If buyers fail to defend this zone on a closing basis, the path toward $1,315 opens with limited technical obstruction. The quality of the closing price at this support zone will function as a real-time verdict on the health of palladium's buyer base.
The U.S. Dollar Index: Reading the Technical Structure Beneath the Short-Term Noise
Key Levels That Define the Dollar's Directional Bias
Despite the dollar's historically weak first-half performance in 2025, its near-term technical structure remains relevant to precious metals traders because short-term dollar strength can create near-term headwinds even within a broader downtrend. The 98.68 to 98.72 support zone represents the dollar's primary near-term defence. As long as this zone holds, the broader technical structure remains intact.
The key conditional price levels to monitor:
- Break above 99.30 opens the path toward 99.69
- Weekly close above 99.00 strengthens the case for a move toward the psychologically significant 100.00 level
- Daily close below 98.72 shifts probability toward a pullback targeting the 98.45 area
The Dollar-Metals Inverse Relationship: How to Use It Analytically
Macro Correlation: Gold and the U.S. dollar have historically maintained an inverse relationship. A weakening dollar makes gold less expensive for buyers using other currencies, which typically stimulates demand and supports higher price levels. A strengthening dollar raises the effective cost of gold in foreign currency terms, creating demand headwinds. This relationship is not absolute — during periods of acute systemic financial stress, both assets can rise simultaneously — but it remains one of the most reliable macro correlations in commodity markets over multi-year cycles.
The critical nuance for 2025 is that the dollar's structural backdrop and its technical near-term posture can point in different directions simultaneously. According to analysis from APMEX, the dollar's influence on precious metals pricing is multi-layered and operates differently across short, medium, and long-term timeframes. Traders should therefore be precise about which timeframe they are analysing and resist conflating a short-term dollar technical bounce with a structural reversal of the broader 2025 downtrend.
What Factors Will Determine the Next Major Move in Precious Metals?
The Three-Variable Framework Traders Should Monitor
- Dollar trajectory: Whether the dollar's 2025 structural weakness persists or reverses is the single most consequential macro variable for the entire precious metals complex. A sustained reversal driven by rising real yields would represent a materially more bearish environment for metals than a simple technical rebound within an ongoing downtrend.
- Daily closing prices at support: Intraday volatility is noise; confirmed closes above or below key levels across gold, silver, platinum, and palladium are the signal that drives subsequent directional momentum.
- Gap closure dynamics: For platinum and silver specifically, the ability or inability to close open bearish gaps will define the near-term directional bias and either confirm or challenge the broader narrative of buyer exhaustion.
Macro Conditions That Could Shift the Balance
- A sustained U.S. interest rate increase would likely strengthen the dollar and apply renewed pressure across the metals complex
- Persistent trade deficits or declining institutional confidence in U.S. fiscal management would extend dollar weakness and provide ongoing structural support for gold and silver
- Real yield compression, where nominal rates fail to keep pace with inflation expectations, historically represents the most powerful structural driver of gold demand and is capable of sustaining elevated gold prices even during periods of moderate dollar recovery
Furthermore, as noted by GoldSilver, the broader erosion of dollar dominance is a trend that precious metals markets have begun to systematically price in, adding a structural dimension to what might otherwise appear as cyclical price moves.
FAQ: Precious Metals Support Levels and Dollar Strength
What does a support level mean in precious metals trading?
A support level is a price zone where historical buying activity has been concentrated enough to prevent further price declines. In precious metals markets, these zones typically align with round numbers, prior consolidation ranges, or technically significant moving averages. When price approaches a support level, traders monitor whether buyers will defend it with sufficient conviction to arrest the downward move.
How does a weaker U.S. dollar affect gold prices?
Because gold is priced globally in U.S. dollars, a weaker dollar makes gold effectively less expensive for buyers operating in other currencies, which typically stimulates demand and supports higher price levels. The dollar's approximately 11% decline in the first half of 2025, as reported by Morgan Stanley, is widely identified as a key structural factor underpinning gold's elevated price levels during this period.
What is a bearish gap in technical analysis?
A bearish gap forms when a market opens significantly below its prior close, leaving an untraded price range on the chart. These gaps often act as resistance levels, as the market tends to attempt recovery toward the prior close. When buyers repeatedly fail to achieve this recovery on a closing basis, it signals that selling pressure remains dominant and that the gap is functioning as a ceiling rather than a temporary anomaly.
Why does the daily closing price matter more than intraday price action?
A daily close below a defined support level is considered a materially more reliable bearish signal than an intraday breach. It indicates that sellers maintained control throughout the full trading session, which typically triggers algorithmic responses and stop-loss activation in subsequent sessions. Intraday dips that recover by the close are treated as tests of a level rather than confirmed breakdowns.
What would a dollar recovery mean for precious metals in 2026?
A sustained reversal in the dollar's 2025 downtrend would create headwinds across precious metals support levels and dollar strength dynamics simultaneously. The degree of impact would depend critically on the driver of that recovery. A dollar rebound driven by rising real yields would be considerably more bearish for metals than a technical rebound occurring within the context of an ongoing structural downtrend.
The Battle Between Technical Support and Macro Tailwinds
Synthesising the Multi-Asset Picture
Precious metals currently sit at an analytically compelling intersection. On one side, the macro environment — characterised by historically significant dollar weakness, compressed real yields, and persistent fiscal uncertainty — provides meaningful structural support for the entire complex. On the other side, technical signals across platinum and silver point to buyer fatigue, failed gap closures, and broken support lines that increase the probability of further downside before any durable recovery takes hold.
The resolution of this tension will not be delivered by macro commentary or forecast models. It will be delivered by a sequence of daily closing prices at the key support zones identified across gold ($4,400 to $4,500), silver ($70 to $71.50), platinum ($1,980 to $2,002), and palladium ($1,357 to $1,375).
Core Principle: The presence of a support level creates the possibility of a reversal. Only confirmed buyer participation, demonstrated through strong closing prices at those levels, transforms that possibility into probability. Assuming a bounce because price is near support is one of the most common and costly errors in active precious metals trading.
The more analytically rigorous question is never whether the market should bounce at a given level. It is whether buyers with real capital, real conviction, and real order flow are actually present when that level is tested. That question, across precious metals support levels and dollar strength dynamics simultaneously, is exactly what the current market environment is forcing traders to answer in real time.
This article is intended for informational and educational purposes only and does not constitute financial advice. Precious metals markets are inherently volatile and involve significant risk of loss. Past technical patterns and scenario outcomes do not guarantee future results. Readers should conduct their own research and consult a qualified financial adviser before making investment decisions.
Want to Identify the Next Major ASX Mineral Discovery Before the Broader Market?
Discovery Alert's proprietary Discovery IQ model delivers real-time alerts on significant ASX mineral discoveries, instantly translating complex data across 30+ commodities into a single, actionable gold-equivalent metric — giving both short-term traders and long-term investors a meaningful edge the moment a discovery is announced. Explore historic discoveries and the substantial returns they have generated, then begin your 14-day free trial at Discovery Alert to position yourself ahead of the market.