June 27, 2026
Global energy markets are experiencing unprecedented structural tensions as traditional supply patterns face systematic disruption. The interconnected nature of worldwide petroleum flows means that localised conflicts can rapidly cascade into global economic instability, fundamentally altering investment strategies and industrial planning across continents. Understanding these dynamics requires examining how concentrated production regions, critical transportation infrastructure, and market psychology interact during periods of heightened geopolitical uncertainty, particularly regarding Iran war oil price escalation scenarios.
Economic Mechanisms Behind Triple-Digit Oil Pricing During Regional Conflicts
Energy price volatility during military escalations stems from fundamental supply-demand imbalances that create exponential rather than linear price responses. When regional conflicts threaten major production areas or transportation routes, markets immediately price in worst-case scenarios while physical supply constraints take weeks or months to materialise fully.
The current Iran war oil price escalation exemplifies these economic forces in action. West Texas Intermediate crude reached approximately $103 per barrel while Brent crude approached $113 per barrel by March 30, 2026, marking the first time since 2022 that WTI traded above the psychologically critical $100 threshold. This represents more than a 40% increase from typical baseline pricing, demonstrating how geopolitical risk premiums can overwhelm traditional supply-demand calculations.
Furthermore, these oil rally dynamics create sustained market pressures that extend beyond immediate supply concerns. The complexity of modern energy markets means that pricing mechanisms respond to perceived risks as much as actual shortages.
Supply Disruption Amplification Effects
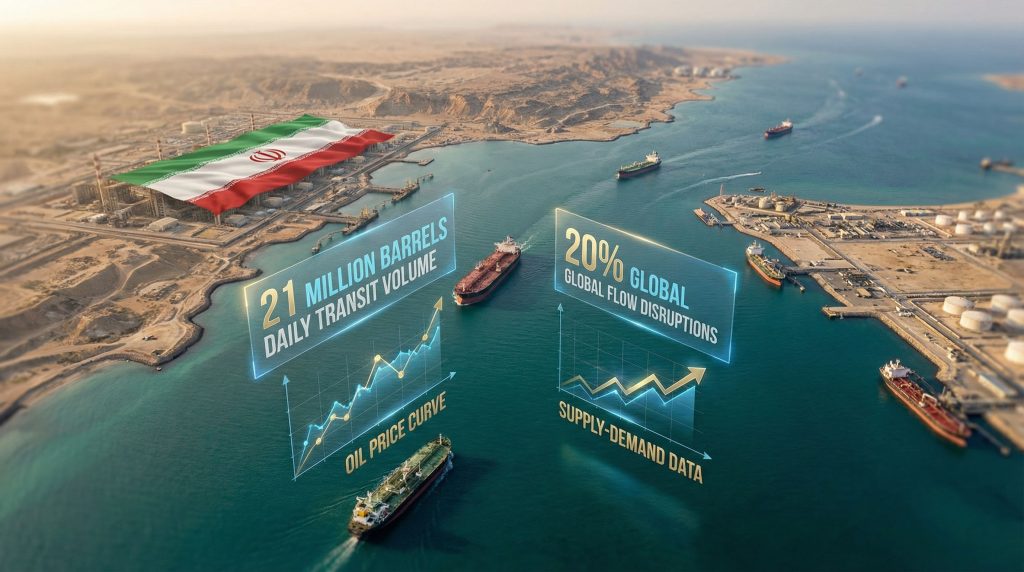
Critical infrastructure chokepoints create asymmetric economic impacts because even modest disruptions to high-volume transit routes force expensive alternative arrangements across global supply chains. The Strait of Hormuz typically handles approximately one-fifth of worldwide oil flows, representing roughly 20 million barrels daily. When vessel traffic through this corridor becomes severely restricted, the ripple effects extend far beyond the immediate region.
Market psychology plays an equally important role in price formation during conflicts. Traders focus increasingly on physical supply availability rather than broader financial conditions, as highlighted by current market behaviour. This shift from financial speculation to commodity fundamentals creates a different pricing dynamic where traditional hedging strategies become less effective and price volatility increases substantially.
Historical precedent analysis reveals that oil price spikes above $100 per barrel typically prove unsustainable beyond 6-8 months due to demand destruction and recession-induced consumption decline. However, the timeline for this self-correcting mechanism depends heavily on alternative supply development, strategic reserve deployment, and conflict resolution prospects.
Risk Premium Calculation Framework
Geopolitical risk premiums represent traders' attempts to quantify uncertainty about conflict duration, escalation potential, and infrastructure damage. These calculations incorporate multiple variables:
- Conflict duration probability matrices based on historical precedents and current diplomatic progress
- Infrastructure vulnerability assessments for critical production and export facilities
- Alternative supply development timelines from non-affected regions
- Strategic petroleum reserve deployment thresholds and coordination mechanisms
Insurance and shipping cost multipliers significantly compound these risk premiums. Maritime insurance rates for tankers transiting conflict zones can increase by 300-500%, while longer routing through alternative passages adds 20-25 days to transit times. These additional costs flow directly through to crude pricing, creating sustained upward pressure independent of actual supply shortages.
When big ASX news breaks, our subscribers know first
Critical Infrastructure Vulnerability and Global Supply Concentration
The Persian Gulf region's dominance in global oil production creates systemic vulnerabilities that explain why localised conflicts generate worldwide economic disruption. This concentration risk extends beyond simple production volumes to encompass export infrastructure, refining capacity, and financial market structures.
Current production data illustrates the scale of this concentration risk:
| Gulf Producer | Daily Output (mbpd) | Hormuz Dependency | Alternative Export Routes |
|---|---|---|---|
| Saudi Arabia | 11.5 | 85% | Red Sea terminals (limited) |
| UAE | 4.2 | 95% | Fujairah pipeline (partial) |
| Kuwait | 2.8 | 100% | None |
| Iraq | 4.6 | 90% | Turkey pipeline (constrained) |
| Iran | 3.8 | 100% | None |
This data reveals that approximately 26.9 million barrels per day of production capacity, representing 27% of global output, depends on a single geographic chokepoint vulnerable to military action, political instability, or infrastructure attacks.
In addition, understanding the OPEC production impact becomes crucial when assessing how coordinated producer responses might stabilise or exacerbate market conditions during regional conflicts.
Alternative Route Limitations
Existing bypass infrastructure cannot absorb full rerouting during major Hormuz disruptions. The Suez Canal primarily serves Mediterranean and European markets rather than Asian consumers who depend heavily on Persian Gulf crude. Cape of Good Hope routing adds substantial time and cost while reducing effective tanker fleet capacity through longer voyage cycles.
Pipeline alternatives face similar constraints. The UAE's Fujairah pipeline provides partial export capability but cannot handle the country's full production volume. Iraq's connections through Turkey remain subject to political complications and capacity limitations that prevent complete rerouting during crisis periods.
The inability of producers outside the Persian Gulf region to offset supply losses in the near term reinforces upward price pressure. Non-OPEC spare capacity typically requires 90-180 days for significant increases, creating a gap period where disrupted supplies cannot be quickly replaced through alternative sources.
Economic Cascade Effects Across Industrial Sectors
Energy price escalations during conflicts create cascading economic impacts that extend far beyond direct fuel costs. These transmission mechanisms operate through multiple channels with varying timelines, affecting different sectors according to their energy intensity and supply chain flexibility.
Transportation costs increase immediately, creating inflationary pressures throughout consumer goods distribution networks. Industrial sectors with high energy inputs face margin compression that can trigger production cutbacks or price increases within 30-60 days of sustained higher energy costs.
Consequently, trade war oil movements demonstrate how energy markets respond to broader geopolitical tensions, often amplifying regional conflicts' economic impacts through interconnected global supply chains.
Sectoral Impact Distribution
The aviation industry faces particularly acute challenges during energy price spikes. Jet fuel typically represents 20-30% of airline operating costs, making carriers extremely vulnerable to sustained crude oil prices above $100 per barrel. Historical precedents from 2008 and 2011 demonstrate that airlines implement fuel surcharges, capacity reductions, and route eliminations within 90-120 days of major price increases.
Petrochemical manufacturing experiences dual impacts from higher energy costs and increased feedstock prices. Many chemical production processes require both petroleum-based energy inputs and crude oil derivatives as raw materials. This creates compounding cost pressures that force production adjustments and pricing changes throughout downstream industries.
Agricultural sectors face fertiliser and diesel cost increases that propagate through food production systems over seasonal cycles. While immediate impacts may be modest, planting and harvesting decisions made during high energy price periods influence food costs for 6-12 months, creating delayed but persistent inflationary effects.
Central Bank Policy Constraints
Monetary policymakers face difficult tradeoffs during energy-driven inflation episodes. Traditional anti-inflation measures like interest rate increases risk triggering economic recession while oil prices remain elevated due to supply constraints rather than excess demand. Conversely, accommodative policies designed to support economic growth may allow inflationary expectations to become entrenched.
The current situation places particular pressure on central banks because energy price increases coincide with existing concerns about global growth prospects and financial stability. Policy responses must balance multiple objectives while acknowledging that monetary tools have limited effectiveness against supply-driven inflation.
Historical Patterns and Price Sustainability Analysis
Energy market behaviour during extended military conflicts follows recognisable patterns that provide insights into current price sustainability and potential resolution scenarios. Analysis of previous crises reveals consistent relationships between conflict duration, price levels, and economic adaptation mechanisms.
"Historical data suggests oil prices above $100 per barrel become economically unsustainable beyond 6-8 months due to cumulative demand destruction and recession-induced consumption decline."
The current Iran war oil price escalation entering its fifth week represents approximately 8% of this typical sustainability timeline. This suggests either substantial downside risk if conflicts resolve quickly, or that demand destruction mechanisms are operating more rapidly than historical precedents would indicate.
Moreover, patterns of oil price stagnation during prolonged geopolitical uncertainty reveal how markets eventually adapt to new equilibrium levels, though often at considerable economic cost.
Demand Destruction Timeline Mechanics
Energy consumption responds to price increases through predictable stages. Industrial demand contracts within 30-45 days through inventory management, efficiency improvements, and production scheduling adjustments. Commercial transportation adapts over 60-90 days through routing optimisation and fuel efficiency measures. Consumer demand shows the slowest response, requiring 90-180 days for behavioural changes and vehicle replacement decisions.
The cumulative effect of these adjustments typically reduces global oil consumption by 2-4% during sustained price periods above $100 per barrel. This demand destruction eventually creates supply-demand equilibrium even with ongoing production disruptions, though the adjustment period involves significant economic costs.
Strategic Reserve Deployment Patterns
International Energy Agency member countries maintain strategic petroleum reserves specifically for supply disruption scenarios. Historical deployments during Libya (2011), Iraq conflicts, and Hurricane disruptions demonstrate coordinated release patterns ranging from 30-60 million barrels during acute shortages.
The timing and scale of strategic reserve releases significantly influence price trajectories. Early deployment can prevent panic buying and speculation, while delayed responses may allow prices to reach levels that trigger broader economic damage. Current market conditions suggest reserve deployment decisions will be critical for managing the Iran war oil price escalation.
Alternative Supply Development and Production Surge Capacity
Non-Persian Gulf producers play crucial roles in offsetting supply disruptions, though their response capabilities face technical and economic constraints. Understanding these limitations helps explain why price increases persist even when theoretical spare capacity exists in other regions.
United States shale production can respond relatively quickly to price incentives, with new wells coming online within 60-90 days. However, pipeline capacity, labour availability, and equipment constraints limit how rapidly total production can increase. Furthermore, US drilling trends indicate how domestic production capacity responds to market incentives during price volatility periods.
Brazil's offshore fields require longer lead times but offer substantial volume potential for sustained price increases. Norwegian production benefits from existing infrastructure and rapid deployment capability, though total volumes remain modest compared to Persian Gulf output. Combined, these alternative sources can potentially add 1-2 million barrels per day within 90-180 days, providing partial but incomplete offset to major supply disruptions.
Market Indicators for Escalation vs. De-escalation Scenarios
Energy markets provide leading indicators for conflict trajectory through futures curve shapes, volatility patterns, and related market behaviours. Sophisticated traders monitor these signals to position for either continued escalation or potential resolution scenarios.
Technical Market Signals
Futures curve contango development indicates market expectations for supply normalisation over time. When longer-dated contracts trade below spot prices, traders anticipate current disruptions will resolve within months rather than years. Conversely, backwardation steepening suggests expectations for prolonged or worsening supply constraints.
Shipping insurance premiums provide real-time assessment of maritime security conditions. Stabilising insurance rates typically precede physical supply recovery by 2-4 weeks, offering early warning of improving conditions. Currency market flight-to-safety patterns also reflect broader geopolitical risk perceptions that influence energy pricing.
Refinery utilisation rates in major importing regions like Asia-Pacific indicate actual physical supply availability versus financial market speculation. Rising utilisation suggests adequate crude supplies despite elevated prices, while declining rates confirm genuine shortage conditions.
Warning Indicators for Further Escalation
Several market signals would indicate deteriorating rather than improving supply prospects. Accelerating strategic petroleum reserve drawdowns beyond emergency thresholds suggests inadequate alternative supplies. Increasing backwardation in crude futures markets reflects expectations for worsening physical availability.
Investment flows into alternative energy projects often accelerate during sustained energy price crises as companies and governments seek to reduce exposure to volatile petroleum markets. Monitoring these capital allocation shifts provides insight into whether market participants expect temporary or permanent changes to energy supply security.
The next major ASX story will hit our subscribers first
Supply Chain Adaptation and Industrial Restructuring
Extended periods of energy price volatility force structural changes in global supply chains and industrial location decisions. Companies implement strategies to reduce vulnerability to future disruptions while managing current cost pressures.
Manufacturing industries reassess location strategies based on energy cost differentials and supply security considerations. Energy-intensive production increasingly concentrates in regions with abundant domestic energy resources or diversified supply sources. This restructuring process accelerates during crisis periods when cost differentials become acute.
Investment Flow Redirection Patterns
Capital markets redirect investment toward energy security and efficiency projects during sustained high-price periods. Renewable energy project financing accelerates as investors seek alternatives to volatile fossil fuel markets. Infrastructure investment increases for alternative transportation routes and domestic production capacity.
These investment patterns create long-term structural changes that persist after immediate crises resolve. Enhanced energy efficiency, diversified supply chains, and alternative energy capacity reduce future vulnerability to similar disruptions while changing competitive dynamics across industries.
Strategic alliance formation for energy security cooperation becomes more important as countries and companies seek to reduce dependence on vulnerable supply sources. Bilateral agreements and regional energy partnerships provide insurance against future disruptions while offering more predictable cost structures.
Long-term Structural Economic Implications
Current energy market disruptions accelerate existing trends toward energy independence and supply chain regionalisation. These changes create permanent alterations to global trade patterns and economic relationships that extend beyond immediate conflict resolution.
Energy Independence Policy Acceleration
Importing nations dramatically increase domestic production investment during supply crises. The United States shale development, European renewable energy expansion, and Asian alternative energy programmes all received major impetus from previous energy security concerns. Current disruptions will likely accelerate similar initiatives globally.
Technology development receives enhanced priority and funding during energy crises as governments and companies seek solutions to supply vulnerability. Advanced battery storage, hydrogen production, synthetic fuel development, and carbon capture technologies benefit from crisis-driven investment that might otherwise occur more gradually.
Regional energy bloc formation reduces long-distance transportation dependency while creating more resilient supply networks. North American energy integration, European renewable energy cooperation, and Asian LNG partnerships exemplify this trend toward regional self-sufficiency and security coordination.
Global Trade Pattern Evolution
Supply chain regionalisation trends accelerate during energy crises as companies prioritise reliability over cost optimisation. Local sourcing, nearshoring, and regional manufacturing hubs become more attractive when transportation costs and supply security risks increase substantially.
These changes create lasting competitive advantages for regions with abundant energy resources or advanced alternative energy infrastructure. Economic geography shifts toward energy-secure locations while traditional trade routes and relationships face reduced importance.
Strategic Implications for Economic Resilience
Building economic resilience against future energy supply disruptions requires coordinated policy frameworks, infrastructure investment, and market mechanism improvements. Current crisis experiences provide valuable lessons for enhancing global energy security and economic stability.
Emergency response mechanism development based on current crisis management experiences will improve future preparedness. International coordination for strategic reserve deployment, alternative supply activation, and market stability measures requires enhancement based on real-world testing during actual disruptions.
Market stability tool development aims to prevent excessive volatility during supply disruptions while maintaining price signals necessary for efficient resource allocation. These mechanisms might include automatic strategic reserve releases, coordinated spare capacity activation, and enhanced market transparency requirements.
Technology development focus areas for energy security include enhanced storage capacity, rapid deployment renewable systems, and flexible production technologies that can quickly respond to supply disruptions. Investment in these capabilities during crisis periods creates long-term resilience while addressing immediate needs.
However, the effectiveness of these measures depends largely on understanding how energy market analysis evolves during sustained geopolitical tensions and implementing appropriate policy responses before crisis conditions become entrenched.
Disclaimer: This analysis contains forward-looking statements and market projections that involve significant uncertainties. Energy market conditions can change rapidly based on geopolitical developments, economic factors, and policy decisions. Historical patterns may not predict future outcomes accurately. Investors should conduct independent research and consider professional advice before making investment decisions based on energy market analysis.
Looking for Investment Opportunities During Energy Market Volatility?
Discovery Alert's proprietary Discovery IQ model provides instant notifications on significant ASX mineral discoveries, particularly energy-related opportunities that often emerge during periods of heightened commodity price volatility. Experience how major mineral discoveries can generate substantial returns by exploring Discovery Alert's dedicated discoveries page, showcasing historic examples of exceptional market outcomes during similar market conditions.