June 17, 2026
The Hidden Transmission Mechanism Behind Thermal Coal's 2026 Price Surge
Energy markets rarely respond to geopolitical conflict in a straight line. The relationship between military events and commodity pricing is almost always mediated through a chain of substitution effects, supply rerouting decisions, and buyer psychology that can take weeks or months to fully materialise in price data. Understanding this transmission mechanism is essential context for any serious analysis of how Iran war thermal coal prices have moved since early 2026, and where they may be headed through the Northern Hemisphere summer.
The price of seaborne thermal coal in Asia has risen in the wake of the US-Israeli military conflict with Iran, though the gains remain modest when measured against the dramatic coal price surge that followed Russia's invasion of Ukraine in February 2022. What makes the 2026 dynamic genuinely interesting is not the size of the price move but the mechanism driving it, which is fundamentally different from anything seen in the post-2020 commodity cycle.
When big ASX news breaks, our subscribers know first
Why LNG Scarcity Is Doing the Heavy Lifting
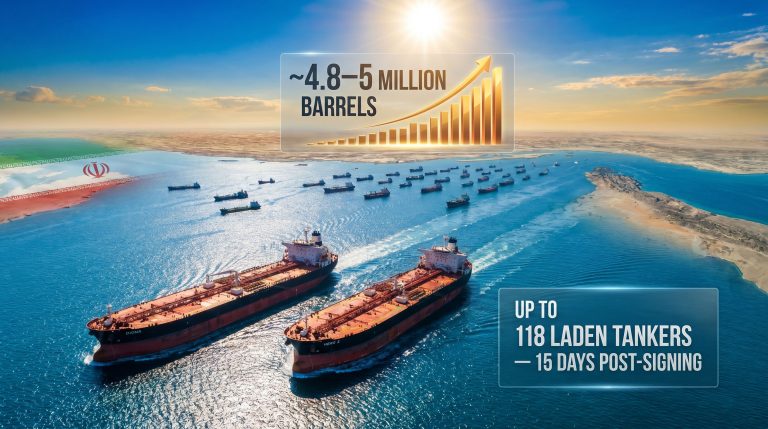
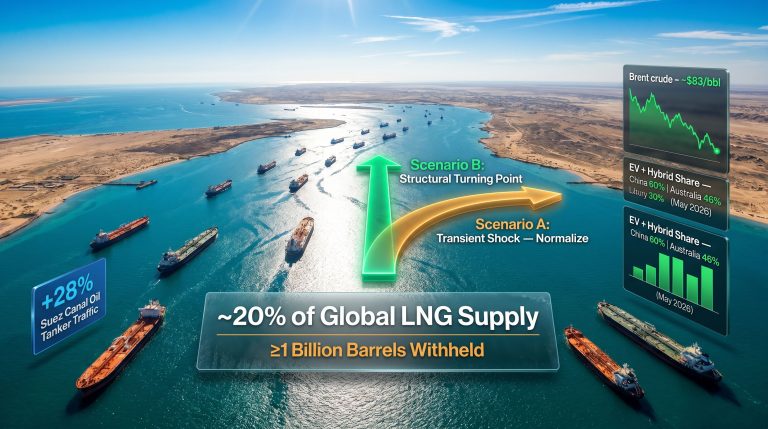
Iran does not export meaningful volumes of thermal coal. The country's role in the current coal price rally is entirely indirect, operating through its geographic command of the Strait of Hormuz, the narrow maritime passage connecting the Persian Gulf to the Gulf of Oman. A substantial portion of the world's liquefied natural gas exports transit this corridor, and the conflict has effectively constrained it.
The result has been an estimated 20% reduction in global LNG supplies, according to Reuters market analysis published May 5, 2026. That is a supply shock of considerable magnitude for a fuel that serves as the primary alternative to coal in power generation across North and Southeast Asia, as well as increasingly in Europe. The global LNG supply outlook heading into 2025 had already signalled potential tightness, making the Hormuz disruption all the more consequential.
The transmission mechanism works through a concept energy economists call fuel-switching economics. When LNG prices rise above a specific cost threshold, utilities and industrial power consumers face a straightforward financial calculation: continuing to burn natural gas destroys economic value compared to switching to coal. The threshold at which coal becomes the cheaper fuel for electricity generation varies by market:
- Japan: Coal becomes economically preferable when spot LNG prices exceed $10.24 per million British thermal units (mmBtu), according to LSEG data
- South Korea: The equivalent threshold sits at $10.45/mmBtu
- Current spot LNG (North Asia delivery, as of early May 2026): Approximately $10.06/mmBtu, still marginally below both switching thresholds
- Forward pricing projection (Brent-linked LNG, Japan, July 2026): $12.73/mmBtu, which would sit well above both switching thresholds
This forward pricing trajectory, derived from current Brent crude futures levels, is arguably the single most important variable for thermal coal demand in the months ahead.
The Brent crude price rally saw futures end Monday at $114.44 per barrel, representing an increase of approximately 32% from the post-war low of $86.09 recorded on April 17, 2026. Since a significant share of long-term LNG contracts in Asia are priced against Brent, rising crude futures directly translate into elevated LNG contract costs, even when spot LNG remains marginally below the fuel-switching threshold. (Reuters / Mining.com, May 5, 2026)
Grade-by-Grade: What the Coal Price Data Actually Shows
Not all thermal coal has responded uniformly to the geopolitical disruption. The seaborne coal market is segmented by energy content measured in kilocalories per kilogram (kcal/kg), with different grades serving distinct buyer bases across Asia. Each grade has its own pricing reference point and buyer profile.
| Coal Grade | Energy Content | Primary Buyers | Price (May 1, 2026) | Rally from Pre-War |
|---|---|---|---|---|
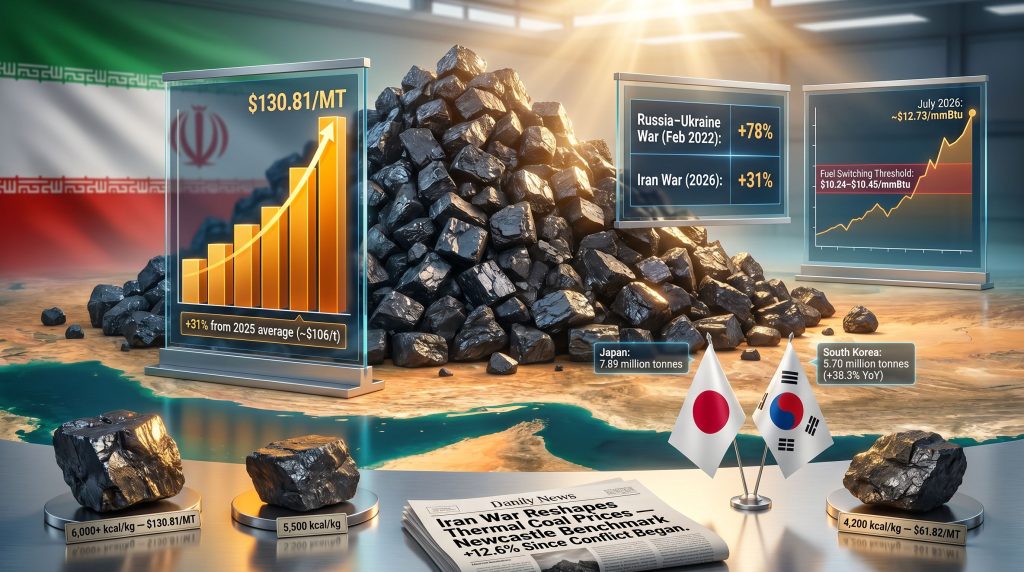
| High-quality Australian | 6,000+ kcal/kg | Japan, South Korea, Taiwan | $130.81/MT (Newcastle benchmark) | +12.6% |
| Mid-quality Australian/Indonesian | 5,500 kcal/kg | China, India | Argus assessed | +11.7% |
| Lower-grade Indonesian | 4,200 kcal/kg | China, India | $61.82/MT | +11.6% |
Source: Reuters / Mining.com analysis, Argus commodity price data, May 5, 2026
The Newcastle weekly benchmark index, the global reference price for high-quality Australian coal exported from the Port of Newcastle in New South Wales, closed at $130.81 per metric ton on May 1, 2026, representing a 12.6% increase from the week immediately preceding the outbreak of conflict.
Mid-quality Australian coal, assessed by Argus at an energy content of 5,500 kcal/kg, rose 11.7% over the same period. Indonesian coal at the 4,200 kcal/kg energy level reached $61.82 per tonne, up 11.6% from February 27. For context on how such commodity price transmission flows through to broader market performance, the relationship between spot movements and producer valuations has been well documented across recent cycles.
The near-lockstep performance across all three grades, ranging from +11.6% to +12.6%, carries an important analytical implication. If the rally were driven by grade-specific supply constraints or buyer-specific shortages, price performance would diverge more meaningfully across the quality spectrum. The tight clustering of returns instead points to broad market sentiment and uniform LNG substitution pressure as the primary driver, rather than any structural change in coal supply dynamics. Furthermore, the slight outperformance of premium Australian grades reflects the specific buyer profiles of Japan and South Korea, the two Northeast Asian economies that maintain both substantial coal-fired generation capacity and significant LNG dependency.
Their theoretical ability to switch between the two fuels at scale gives them a structural position in the market that no other Asian economy replicates, making premium coal the marginal fuel of choice when that switch begins to occur. The commodity price transmission effect from this dynamic is already visible in the share price performance of major Australian coal producers.
Comparing 2026 to 2022: Same Fuel, Different Mechanism
Any serious analysis of the current situation requires placing it alongside the only comparable modern event: the coal price surge that followed Russia's invasion of Ukraine in February 2022.
| Event | Mechanism | Peak Price Impact | Duration |
|---|---|---|---|
| Russia-Ukraine War (Feb 2022) | Supply rerouting; Western sanctions on Russian coal exports | +78% from pre-war levels | Multi-quarter; normalisation over ~18 months |
| Iran War (2026) | LNG supply disruption via Strait of Hormuz; indirect demand pull | +31% from 2025 average (~$106/t) | Ongoing as of May 2026 |
The distinction between these two events is structurally significant. The 2022 Ukraine crisis disrupted coal supply chains directly, forcing a physical rerouting of Russian coal shipments as Western buyers refused delivery and new trading relationships were established. This was a supply-side shock that created genuine physical scarcity in certain regional markets.
The 2026 Iran war is operating through an entirely different pathway. Coal supply chains themselves have not been disrupted. Australian, Indonesian, and South African coal continue to flow normally through established shipping routes. What has changed is the relative price competitiveness of coal versus LNG for power generation, creating a demand-pull dynamic that is drawing additional volumes into markets where LNG has become prohibitively expensive.
This structural difference has significant implications for the likely duration and reversibility of the current price rally. A demand-pull rally driven by LNG price elevation can unwind quickly once the underlying LNG supply constraint is resolved. A supply-shock rally, by contrast, takes longer to normalise because new physical supply routes must be established before prices can rebalance.
Japan and South Korea: The Swing Buyers That Haven't Yet Swung
The most revealing data in the current market analysis comes not from price indices but from actual physical import volumes. According to DBX Commodities data cited in Reuters reporting, the import behaviour of Japan and South Korea as of April 2026 tells a nuanced story.
Japan thermal coal imports:
- April 2026: 7.89 million tonnes
- March 2026: 9.10 million tonnes
- April 2025 (prior year): 7.69 million tonnes
- Status relative to five-year average: Below average
South Korea thermal coal imports:
- April 2026: 5.70 million tonnes
- March 2026: 5.81 million tonnes
- April 2025 (prior year): 4.12 million tonnes
- Year-on-year growth: +38.3%
South Korea's 38.3% year-on-year increase is the headline figure, but context matters considerably. Despite that apparently dramatic growth, April 2026 import volumes for both Japan and South Korea remained well below their respective five-year average levels for the same month. This indicates that the fuel-switching incentive that exists in theory has not yet translated into large-scale operational changes at the utility level.
The gap between financial incentive and operational response reflects what might be called contractual and logistical inertia. Power utilities typically operate under long-term LNG supply agreements that cannot be immediately suspended, and coal-fired units that have been operating at reduced load factors require time to ramp up to full capacity. This lag between price signal and operational response is a well-documented feature of energy market transitions.
The critical near-term question is whether the arrival of summer peak electricity demand across Japan and South Korea, typically concentrated between June and August, provides the catalyst for a more decisive shift in fuel procurement behaviour. If Brent-linked LNG contract prices reach the projected $12.73/mmBtu level by July 2026, the financial case for coal switching will have become overwhelming. According to thermal coal market data, prices have continued to trend upward in the weeks following the initial conflict escalation.
Europe's Parallel Pressure: Policy Tension Meets Energy Economics
The geopolitical disruption has not confined its effects to Asia. European energy markets have registered their own response, with thermal coal delivered to the Amsterdam-Rotterdam-Antwerp hub averaging $116 to $117 per tonne in early May 2026, compared to a pre-war baseline of approximately $107.49 per tonne.
More striking than the price movement is the economic signal coming from German power generation markets. Gas-fired plant margins in Germany had reached negative €8.82 per megawatt-hour, meaning that running natural gas plants at prevailing market prices was actively destroying economic value. At these margin levels, coal-fired generation is not merely competitive but financially superior, creating direct incentive for utilities to maximise coal utilisation wherever grid regulations permit.
This dynamic has reopened a politically charged debate in Europe. Germany legislated a coal phase-out deadline of 2038, a commitment that has faced renewed scrutiny from political leaders publicly questioning whether that timeline can be sustained given current energy security pressures. The tension between long-term climate commitments and short-term energy security arithmetic is not a new debate in European policy circles, but the Iran conflict has given it fresh urgency.
Scenario modelling for European coal import volumes suggests the following trajectories based on conflict duration:
| Conflict Resolution Timeline | Estimated Additional European Coal Imports |
|---|---|
| Rapid resolution by mid-May 2026 | Approximately 0.5 million additional tonnes |
| Prolonged conflict through late Q2 2026 | Approximately 2.3 million additional tonnes |
Meanwhile, China's energy demand trends have followed a distinctly different trajectory. Rather than increasing coal imports significantly, China has reduced LNG arrivals and redirected energy procurement toward domestic natural gas production and pipeline imports. This strategic pivot has served a secondary function of partially freeing up global LNG supply for buyers in South Korea, Japan, and Southeast Asia, providing a modest buffer against the full severity of the Hormuz disruption.
Taiwan has been reported to be evaluating the reactivation of mothballed coal-fired generation assets, a development that, if confirmed, would add another layer of demand pressure to the seaborne thermal coal market.
The next major ASX story will hit our subscribers first
Forward Scenarios: Three Paths Through the Second Half of 2026
The trajectory of Iran war thermal coal prices through the remainder of 2026 is fundamentally contingent on a single upstream variable: the duration and severity of the Strait of Hormuz disruption. Analysts monitoring the market have framed the forward outlook around three primary scenarios.
Scenario 1: Rapid conflict resolution (low probability as of early May 2026)
If the Strait reopens quickly and LNG supply begins normalising, spot LNG prices in North Asia would likely retreat toward the $8 to $9/mmBtu range. At those levels, the fuel-switching incentive evaporates and coal demand reverts to baseline. The Newcastle benchmark would likely retrace toward the $110 to $115/MT range within four to six weeks of resolution.
Scenario 2: Prolonged conflict through Northern Hemisphere summer (elevated probability)
If the disruption extends through June and July 2026, Brent-linked LNG contract prices in Japan could reach the projected $12.73/mmBtu level, which sits well above both the Japanese ($10.24/mmBtu) and South Korean ($10.45/mmBtu) fuel-switching thresholds. This scenario would likely produce a more decisive shift in utility-level procurement behaviour, potentially pushing the Newcastle benchmark toward the $140 to $145/MT range.
Scenario 3: Escalation and sustained Hormuz closure (tail risk)
A deeper escalation that extends the LNG supply disruption well beyond the current 20% reduction would create the conditions for emergency coal procurement across multiple major consuming regions simultaneously. However, the structural difference between a demand-pull rally and a supply-shock rally makes a repeat of the +78% peak unlikely under any but the most extreme circumstances. Broadly speaking, the oil market disruption risk associated with a prolonged Hormuz closure remains the key variable that energy traders are monitoring most closely.
The gap between current spot LNG pricing at approximately $10.06/mmBtu and the fuel-switching threshold of $10.24 to $10.45/mmBtu is razor-thin. A marginal further increase in Brent crude futures, which have already risen approximately 32% from their post-war low, would be sufficient to push Brent-linked LNG contracts above both switching thresholds and catalyse a more significant demand rotation toward coal. (Reuters / Mining.com, May 5, 2026)
The Structural Ceiling: Why This Rally Has Limits
Even in the most bullish near-term scenarios, Iran war thermal coal prices are operating against a structural backdrop that will reassert itself once the geopolitical pressure eases. Several fundamental forces continue to work against sustained coal price elevation:
- Renewable energy capacity additions continue to accelerate across Asia and Europe, reducing the residual demand for fossil-fuel generation over the medium term
- Carbon pricing mechanisms in the European Union and increasingly in Asian markets create persistent cost headwinds for coal-fired generation that price rallies cannot eliminate
- LNG infrastructure investment including new regasification terminals and long-term supply diversification agreements is expanding global LNG availability on a multi-year horizon, reducing structural dependency on the Strait of Hormuz as a single chokepoint
- National energy phase-out policies remain embedded in the legislative frameworks of most major coal-importing economies, even if near-term implementation is under pressure
The historical pattern of geopolitically driven commodity price spikes is instructive here. Sharp, sentiment-driven surges in commodity prices caused by conflict or supply disruption have consistently proven mean-reverting once the underlying physical disruption resolves. The 2022 Ukraine coal rally, which peaked at approximately +78% from pre-war levels, took roughly 18 months to normalise as new supply routes were established and demand destruction occurred at elevated price levels.
The 2026 Iran war rally, being a demand-pull event rather than a supply disruption, may prove even more transient. Unlike the 2022 scenario where actual coal supply chains were rerouted and physical trading relationships had to be rebuilt, the current price elevation rests entirely on LNG price competitiveness. Consequently, once LNG supply normalises, the substitution economics that are currently supporting coal demand will evaporate without requiring any structural adjustment in coal trade flows. Analysts at Mining Weekly had flagged this dynamic as early as April 2026, noting that LNG-driven coal demand spikes tend to be self-correcting once the supply constraint is lifted.
Frequently Asked Questions: Iran War and Thermal Coal Markets
Why did the Iran war cause thermal coal prices to rise if Iran doesn't export coal?
Iran's role is entirely indirect. The conflict has constrained the Strait of Hormuz, reducing global LNG supply by approximately 20% and driving up natural gas prices across Asia and Europe to levels that make coal-fired power generation economically competitive by comparison. The coal price increase is a substitution effect, not a supply shock.
How does the 2026 rally compare to the 2022 Ukraine crisis?
The 2022 Ukraine crisis produced a thermal coal price increase of approximately 78% from pre-war levels, driven by direct supply chain disruption and the rerouting of Russian coal exports. The 2026 Iran war rally has produced a more moderate increase of around 31% from the 2025 average of approximately $106 per tonne, reaching the Newcastle benchmark level of $130.81/MT as of May 1, 2026.
At what LNG price does coal switching become economically justified?
Based on LSEG market data, Japanese utilities reach the coal-switching threshold when LNG spot prices exceed $10.24/mmBtu, while South Korean utilities reach their equivalent threshold at $10.45/mmBtu. Forward pricing on Brent-linked LNG contracts suggests these thresholds could be exceeded by July 2026 if current crude oil pricing persists.
Which Asian economies have the most capacity to switch between LNG and coal?
Japan and South Korea are identified as the primary swing buyers because they are the only two major Asian economies that maintain both substantial coal-fired generation infrastructure and significant LNG dependency simultaneously, giving them the operational flexibility to shift fuel consumption in response to price signals at meaningful scale.
Is the current coal price rally sustainable beyond the conflict?
The structural evidence suggests not, at least not at current elevated levels. The rally is demand-pull in nature and dependent on LNG price elevation. Once Strait of Hormuz transit normalises and LNG supply recovers, the substitution economics underpinning coal demand will weaken. Longer-term structural headwinds including renewable capacity growth, carbon pricing, and LNG infrastructure expansion continue to pressure thermal coal's medium-term demand outlook.
Want to Position Yourself Ahead of the Next Major Commodity Discovery?
Discovery Alert's proprietary Discovery IQ model delivers real-time alerts on significant ASX mineral discoveries, instantly transforming complex commodity data into actionable investment insights — whether you're tracking energy market shifts or capitalising on exploration opportunities across 30+ commodities. Explore historic discoveries and their exceptional market returns, then begin your 14-day free trial to secure a genuine market-leading advantage.